. 2023 Mar 14:39:147-162.
doi: 10.1016/j.jot.2023.02.005. eCollection 2023 Mar.

Forkhead box O3 attenuates osteoarthritis by suppressing ferroptosis through inactivation of NF-κB/MAPK signaling

Affiliations

Forkhead box O3 attenuates osteoarthritis by suppressing ferroptosis through inactivation of NF-κB/MAPK signaling

Chen Zhao et al. J Orthop Translat. .

Abstract

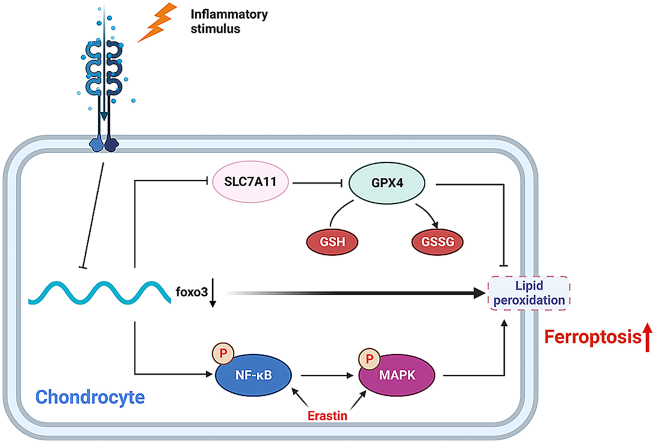
Background: Ferroptosis is a nonapoptotic cell death process that is characterized by lipid peroxidation and intracellular iron accumulation. As osteoarthritis (OA) progresses, inflammation or iron overload induces ferroptosis of chondrocytes. However, the genes that play a vital role in this process are still poorly studied.

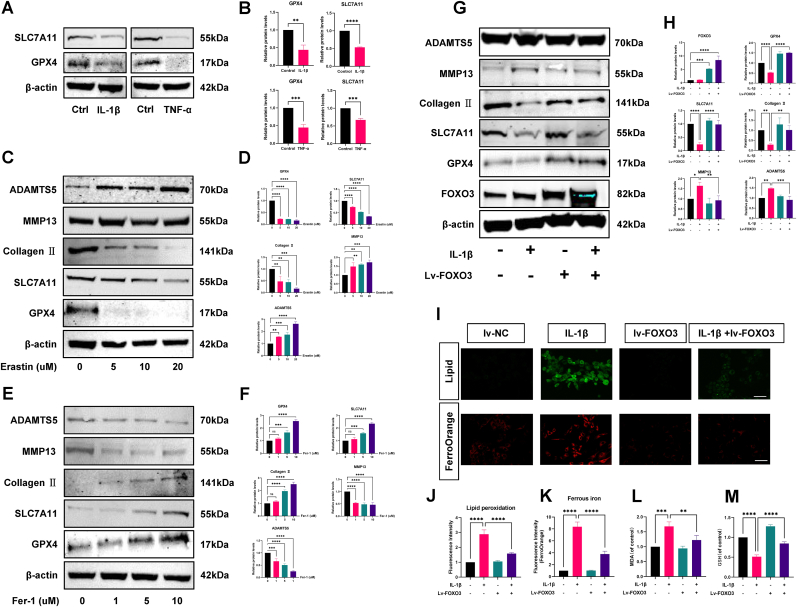
Methods: Ferroptosis was elicited in the ATDC5 chondrocyte cell line and primary chondrocytes by administration of the proinflammatory cytokines, interleukin (IL)-1β and tumor necrosis factor (TNF)-α, which play key roles in OA. The effect of FOXO3 expression on apoptosis, extracellular matrix (ECM) metabolism, and ferroptosis in ATDC5 cells and primary chondrocytes was verified by western blot, Immunohistochemistry (IMHC), immunofluorescence (IF) and measuring Malondialdehyde (MDA) and Glutathione (GSH) levels. The signal cascades that modulated FOXO3-mediated ferroptosis were identified by using chemical agonists/antagonists and lentivirus. In vivo experiments were performed following destabilization of medial meniscus surgery on 8-week-old C57BL/6 mice and included micro-computed tomography measurements.

Results: In vitro administration of IL-1β and TNF-α, to ATDC5 cells or primary chondrocytes induced ferroptosis. In addition, the ferroptosis agonist, erastin, and the ferroptosis inhibitor, ferrostatin-1, downregulated or upregulated the protein expression of forkhead box O3 (FOXO3), respectively. This, suggested, for the first time, that FOXO3 may regulate ferroptosis in articular cartilage. Our results further suggested that FOXO3 regulated ECM metabolism via the ferroptosis mechanism in ATDC5 cells and primary chondrocytes. Moreover, a role for the NF-κB/mitogen-activated protein kinase (MAPK) signaling cascade in regulating FOXO3 and ferroptosis was demonstrated. In vivo experiments confirmed the rescue effect of intra-articular injection of a FOXO3-overexpressing lentivirus against erastin-aggravated OA.

Conclusions: The results of our study show that the activation of ferroptosis promotes chondrocyte death and disrupts the ECM both in vivo and in vitro. In addition, FOXO3 can reduce OA progression by inhibiting ferroptosis through the NF-κB/MAPK signaling pathway.

The translational potential of this article: This study highlights the important role of chondrocyte ferroptosis regulated by FOXO3 through the NF-κB/MAPK signaling in the progression of OA. The inhibition of chondrocyte ferroptosis by activating FOXO3 is expected to be a new target for the treatment of OA.

Keywords: Chondrocyte; Extracellular matrix; Ferroptosis; Forkhead box O3; Osteoarthritis.


Conflict of interest statement

The authors have declared that no competing interest exists.

Figures

Image 1
Graphical abstract
Figure 1
Figure 1
Inflammation can induce ferroptosis in ATDC5 cells, and FOXO3 is involved (A) Measurement of GSH content 24 ​h post IL-1β (10 ​ng/ml) or TNF-α (10 ​ng/ml) treatment (B) Measurement of MDA content 24h post IL-1β (10 ​ng/ml) or TNF-α (10 ​ng/ml) treatment (C) The expression level of GPX4 and SLC7A11 in ATDC5 cells were determined by WB analysis. (D) Semiquantitative analysis of GPX4 and SLC7A11 expression based on WB analysis (E) Detection of intracellular lipid peroxidation by Liperfluo fluorescence probe (scale bar: 50 ​μm). Semiquantitative analysis of the fluorescence intensity of lipid peroxidation (F) Detection of intracellular lipid peroxidation by Liperfluo fluorescence probe (scale bar: 50 ​μm). Semiquantitative analysis of the fluorescence intensity of lipid peroxidation(G) After treatment of ATDC5 cells with different concentrations of erastin (24h), FOXO3, GPX4 and SLC7A11 were determined by WB analysis (H) Semiquantitative analysis of FOXO3, GPX4 and SLC7A11 expression based on WB analysis. (I) After treatment of ATDC5 cells with different concentrations of Fer-1 (24h), FOXO3, GPX4 and SLC7A11 were determined by WB analysis. (J) Semiquantitative analysis of FOXO3, GPX4 and SLC7A11 expression based on WB analysis. ∗P ​< ​0.05; ∗∗P ​< ​0.01; ∗∗∗P ​< ​0.001; ∗∗∗∗P ​< ​0.0001. All data are from n ​= ​3 independent experiments.
Figure 2
Figure 2
Knockdown of FOXO3 promotes ECM metabolic disorder and apoptosis (A) WB analysis verified the success of three lenti-sh-FOXO3 knockdown of FOXO3 in ATDC5 cells. (B) Semiquantitative analysis of FOXO3 expression based on WB analysis (C) Alcian blue staining of shRNA-treated ATDC5s. (D) Protein levels of MMP13, ADAMTS5 and Collagen Ⅱ in ATDC5s infected with FOXO3 shRNA #1#2/#3 lentivirus or control shRNA lentivirus (E) Semiquantitative analysis of MMP13, ADAMTS5 and Collagen Ⅱ expression based on WB analysis. (F) Protein levels of BAX, cleaved-caspase-3, BCL-2 and cleaved-PARP in ATDC5s infected with FOXO3 shRNA #1#2/#3 lentivirus or control shRNA lentivirus (G) Semiquantitative analysis of BAX, cleaved-caspase-3, BCL-2 and cleaved-PARP expression based on WB analysis. (H) TUNEL staining assay was conducted on the ATDC5 chondrocytes infected with FOXO3 shRNA #1 lentivirus or control shRNA lentivirus (scale bar: 100 ​μm). (I) Immunofluorescence staining of Collagen Ⅱ in ATDC5 chondrocytes (scale bar: 50 ​μm). ∗P ​< ​0.05; ∗∗∗P ​< ​0.001; ∗∗∗∗P ​< ​0.0001. All data are from n ​= ​3 independent experiments. (For interpretation of the references to colour in this figure legend, the reader is referred to the Web version of this article.)
Figure 3
Figure 3
FOXO3 rescues IL-1β treatment-induced disturbance of extracellular matrix metabolism and apoptosis (A) WB analysis verified the success of overexpression of FOXO3 in ATDC5 cells treated with lenti-FOXO3. (B) Semiquantitative analysis of FOXO3 expression based on WB analysis (C) Alcian blue staining of lenti-FOXO3 treated ATDC5s. (D) Protein levels of MMP13, ADAMTS5 and Collagen Ⅱ in ATDC5s infected with FOXO3 lentivirus and IL-1β (10 ​ng/ml) (E) Semiquantitative analysis of MMP13, ADAMTS5 and Collagen Ⅱ expression based on WB analysis. (F) Protein levels of BAX, cleaved-caspase-3, BCL-2 and cleaved-PARP in ATDC5s infected with FOXO3 lentivirus and IL-1β (10 ​ng/ml) (G) Semiquantitative analysis of MMP13, ADAMTS5 and Collagen Ⅱ expression based on WB analysis. (H) TUNEL staining assay was conducted on the ATDC5 chondrocytes infected with FOXO3 lentivirus and IL-1β (10 ​ng/ml) (scale bar: 100 ​μm) (I) Immunofluorescence staining of Collagen Ⅱ in ATDC5 chondrocytes (scale bar: 50 ​μm). ∗∗P ​< ​0.01; ∗∗∗P ​< ​0.001; ∗∗∗∗P ​< ​0.0001. All data are from n ​= ​3 independent experiments. (For interpretation of the references to colour in this figure legend, the reader is referred to the Web version of this article.)
Figure 4
Figure 4
FOXO3 suppresses IL-1β-induced ferroptosis in ATDC5 chondrocytes (A) Protein levels of GPX4 and SLC7A11 in ATDC5s infected with FOXO3 lentivirus and IL-1β (10 ​ng/ml) (B) Semiquantitative analysis of GPX4 and SLC7A11 expression based on WB analysis. (C) Immunofluorescence staining of GPX4 in ATDC5 chondrocytes as treated above (scale bar: 50 ​μm) (D) Semiquantitative analysis of the fluorescence intensity of GPX4. (E) Detection of intracellular ROS by DCFH-DA (Up), detection of intracellular lipid peroxidation by Liperfluo fluorescence probe (Middle), detection of intracellular Fe2+ by FerroOrange Assay (Down) (scale bar: 50 ​μm). Semiquantitative analysis of the fluorescence intensity of intracellular ROS (F), lipid peroxidation (G) and intracellular Fe2+ (H) (I) MDA levels in ATDC5 cells were quantitatively determined using an MDA assay kit. (J) GSH levels in ATDC5 cells were quantitatively determined using an GSH assay kit (K) The cell counting kit-8 (CCK-8) assay detects cell viability. ∗∗P ​< ​0.01; ∗∗∗P ​< ​0.001; ∗∗∗∗P ​< ​0.0001. All data are from n ​= ​3 independent experiments.
Figure 5
Figure 5
FOXO3 knockdown increased the sensitivity of ATDC5 chondrocytes to ferroptosis (A) Protein levels of GPX4, SLC7A11, MMP13, ADAMTS5 and Collagen Ⅱ in ATDC5s infected with erastin (10 ​μM), Fer-1 (10 ​μM) and sh-FOXO3 (B) Semiquantitative analysis of protein expression based on WB analysis. (C) Immunofluorescence staining of GPX4 in ATDC5 chondrocytes as treated above (scale bar: 50 ​μm) (D) Semiquantitative analysis of the fluorescence intensity of GPX4. (E) Detection of intracellular ROS by DCFH-DA (Up), detection of intracellular lipid peroxidation by Liperfluo fluorescence probe (Middle), detection of intracellular Fe2+ by FerroOrange Assay (Down) (scale bar: 50 ​μm). Semiquantitative analysis of the fluorescence intensity of intracellular ROS (F), lipid peroxidation (G) and intracellular Fe2+ (H) (I) MDA levels in ATDC5 cells were quantitatively determined using an MDA assay kit. (J) GSH levels in ATDC5 cells were quantitatively determined using an GSH assay kit (K) The cell counting kit-8 (CCK-8) assay detects cell viability. ∗P ​< ​0.05; ∗∗P ​< ​0.01; ∗∗∗P ​< ​0.001; ∗∗∗∗P ​< ​0.0001. All data are from n ​= ​3 independent experiments.
Figure 6
Figure 6
Erastin activates ferroptosis by targeting NF-κB and MAPK signaling (A) Western blotting showed that erastin affected NF-κB signal-related proteins IKK/p-IKK, p-IκBα, and P65/p-P65 (A, B) and MAPK signal-related proteins p-JNK/JNK, p-ERK/ERK and p-P38/P38 (D, E). Overexpression of FOXO3 inhibited erastin-activated NF-κB (C) and MAPK (D) signaling (G) Effect of intracellular overexpression of FOXO3 on NF-κB/MAPK signaling pathway. (H) Protein levels of GPX4 and SLC7A11 in ATDC5s treated with erastin (10 ​μM) and MAPK-IN-1 (10 ​μM) (I) Semiquantitative analysis of GPX4 and SLC7A11 expression based on WB analysis. (J) Protein levels of GPX4 and SLC7A11 in ATDC5s treated with erastin (10 ​μM) and NF-κB-IN-1 (50 ​μM) (K) Semiquantitative analysis of GPX4 and SLC7A11 expression based on WB analysis. (L, N) MDA levels in ATDC5 cells were quantitatively determined using an MDA assay kit. (M, O) GSH levels in ATDC5 cells were quantitatively determined using an GSH assay kit. ∗P ​< ​0.05; ∗∗P ​< ​0.01; ∗∗∗P ​< ​0.001; ∗∗∗∗P ​< ​0.0001. All data are from n ​= ​3 independent experiments.
Figure 7
Figure 7
FOXO3 also regulates ferroptosis in primary mouse chondrocytes (A) The expression level of GPX4 and SLC7A11 in primary chondrocytes were determined by WB analysis. (B) Semiquantitative analysis of GPX4 and SLC7A11 expression based on WB analysis (C) After treatment of primary chondrocytes with different concentrations of erastin (24h), GPX4, SLC7A11, Collagen Ⅱ, MMP13 and ADAMTS5 were determined by WB analysis (D) Semiquantitative analysis of F GPX4, SLC7A11, Collagen Ⅱ, MMP13 and ADAMTS5 expression based on WB analysis. (E) After treatment of primary chondrocytes with different concentrations of Fer-1 (24h), GPX4, SLC7A11, Collagen Ⅱ, MMP13 and ADAMTS5 were determined by WB analysis (F) Semiquantitative analysis of GPX4, SLC7A11, Collagen Ⅱ, MMP13 and ADAMTS5 expression based on WB analysis. (G) Protein levels of FOXO3, GPX4, SLC7A11, Collagen Ⅱ, MMP13 and ADAMTS5 in primary chondrocytes infected with FOXO3 lentivirus and IL-1β (10 ​ng/ml) (H) Semiquantitative analysis of FOXO3, GPX4, SLC7A11, Collagen Ⅱ, MMP13 and ADAMTS5 expression based on WB analysis. (I) Detection of intracellular lipid peroxidation by Liperfluo fluorescence probe (Up), detection of intracellular Fe2+ by FerroOrange Assay (Down) (scale bar: 50 ​μm). Semiquantitative analysis of the fluorescence intensity of lipid peroxidation (J) and intracellular Fe2+ (K) (L) MDA levels in primary chondrocytes were quantitatively determined using an MDA assay kit. (M) GSH levels in primary chondrocytes were quantitatively determined using an GSH assay kit. ∗P ​< ​0.05; ∗∗P ​< ​0.01; ∗∗∗P ​< ​0.001; ∗∗∗∗P ​< ​0.0001. All data are from n ​= ​3 independent experiments.
Figure 8
Figure 8
FOXO3 overexpression alleviates erastin-exacerbated OA in mice (A) Schematic of the time course used for the DMM-induced in vivo osteoarthritis experiments. (B) Reconstruction images of micro-CT scanning of the knees and osteophytes (red arrow). Scale bars, 1 ​mm (C) The BV/TV, trabecular number (Tb. N), trabecular thickness (Tb. Th), and trabecular spacing (Tb. Sp) of the subchondral bone (D) H&E staining and Safranin O and fast green staining were performed to observe the cell morphology and tissue integrity in the articular cartilage tissues of the mouse knee undergoing DMM surgery. Scale bars, 20 ​μm. (E) OARSI grade used for evaluation of the cartilage degradation in the four groups (F, G) TUNEL staining assay in the articular cartilage tissues of the mouse knee undergoing DMM surgery. Scale bars, 20 ​μm. (H– K) Representative images for FOXO3 (up), GPX4 (middle), and collagen Ⅱ (down) immunostaining in cartilage tissues obtained from sham or DMM mouse knees. Scale bars, 25 ​μm. The bar graphs show quantification of the FOXO3-, GPX4-, or COL2-positive cells from total cell population per field, in immunohistochemical and immunofluorescence sections. ∗P ​< ​0.05; ∗∗P ​< ​0.01; ∗∗∗P ​< ​0.001; ∗∗∗∗P ​< ​0.0001. All data are from n ​= ​3 independent experiments. N ​= ​5. (For interpretation of the references to colour in this figure legend, the reader is referred to the Web version of this article.)
Figure 9
Figure 9
Schematic illustration of effect of FOXO3-regulated ferroptosis in osteoarthritis development.

Similar articles

Cited by

References

    1. Barnett R. Osteoarthritis. Lancet. 2018;391 - PubMed
    1. Bortoluzzi A., Furini F., Scire C.A. Osteoarthritis and its management - epidemiology, nutritional aspects and environmental factors. Autoimmun Rev. 2018;17(11):1097–1104. - PubMed
    1. Wan Y., Lv Y., Li L., Yin Z. 15-Lipoxygenase-1 in osteoblasts promotes TGF-beta1 expression via inhibiting autophagy in human osteoarthritis. Biomed Pharmacother. 2020;121 - PubMed
    1. Latourte A., Kloppenburg M., Richette P. Emerging pharmaceutical therapies for osteoarthritis. Nat Rev Rheumatol. 2020;16(12):673–688. - PubMed
    1. Martel-Pelletier J., Wildi L.M., Pelletier J.P. Future therapeutics for osteoarthritis. Bone. 2012;51(2):297–311. - PubMed