. 2023 May 15;9(1):164.
doi: 10.1038/s41420-023-01457-3.

IGF2BP3 promotes adult myocardial regeneration by stabilizing MMP3 mRNA through interaction with m6A modification

Affiliations

IGF2BP3 promotes adult myocardial regeneration by stabilizing MMP3 mRNA through interaction with m6A modification

Simeng Li et al. Cell Death Discov. .

Abstract

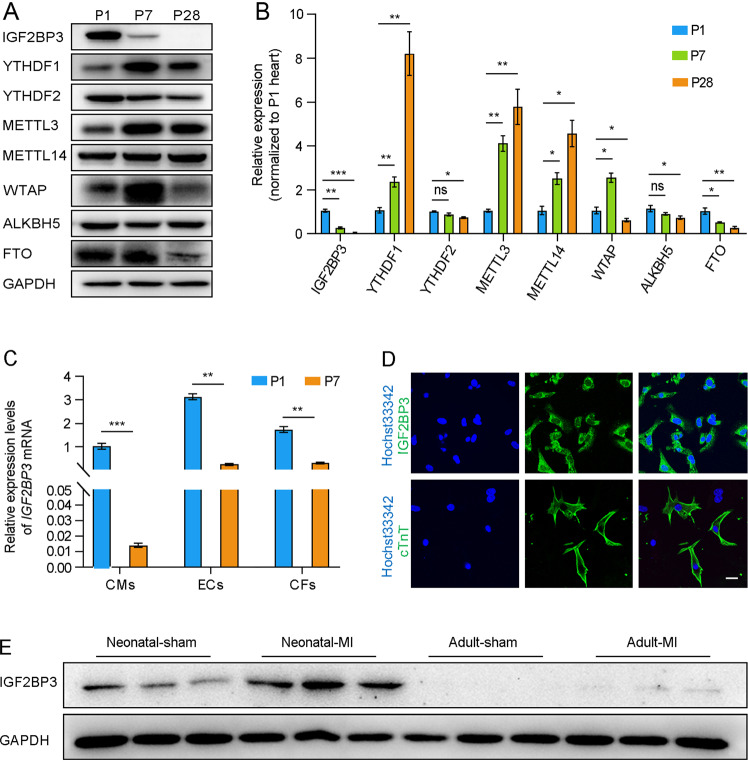
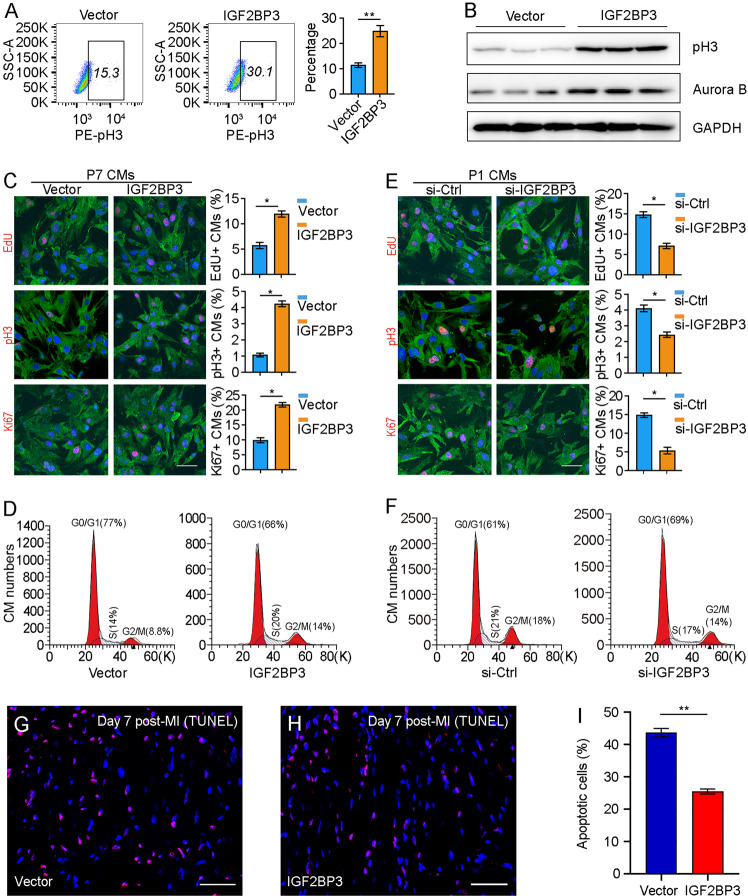
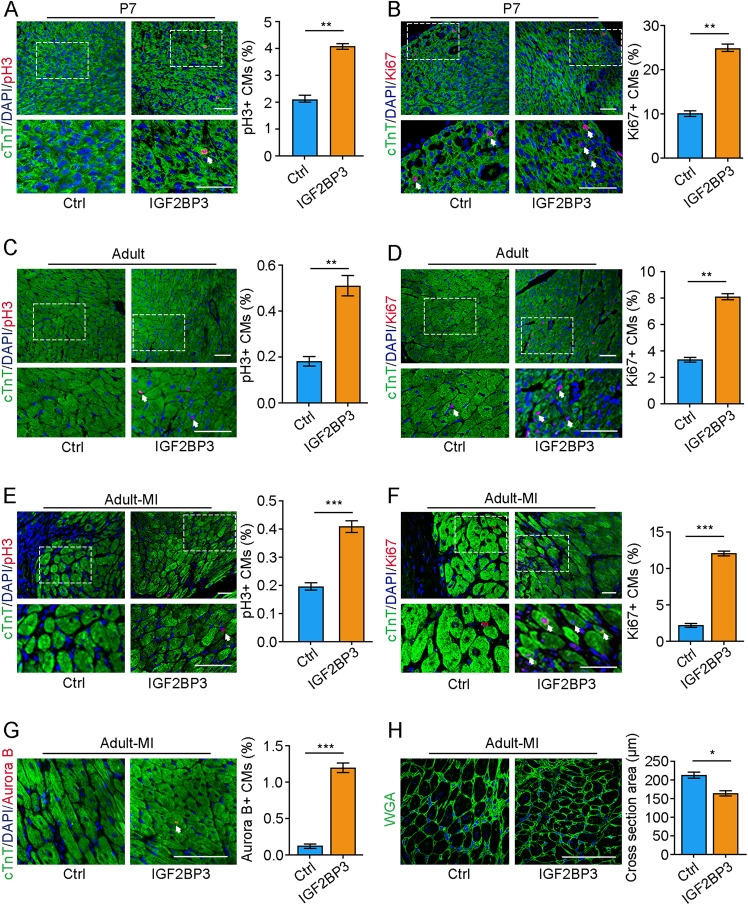
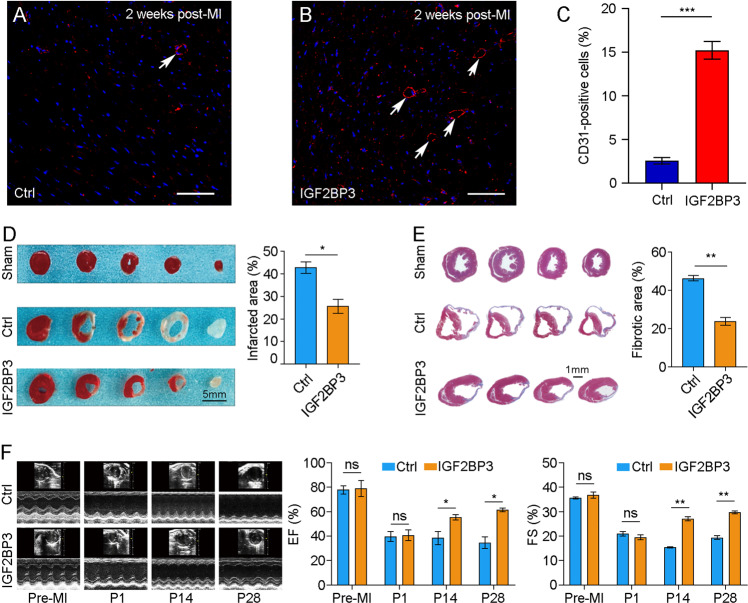
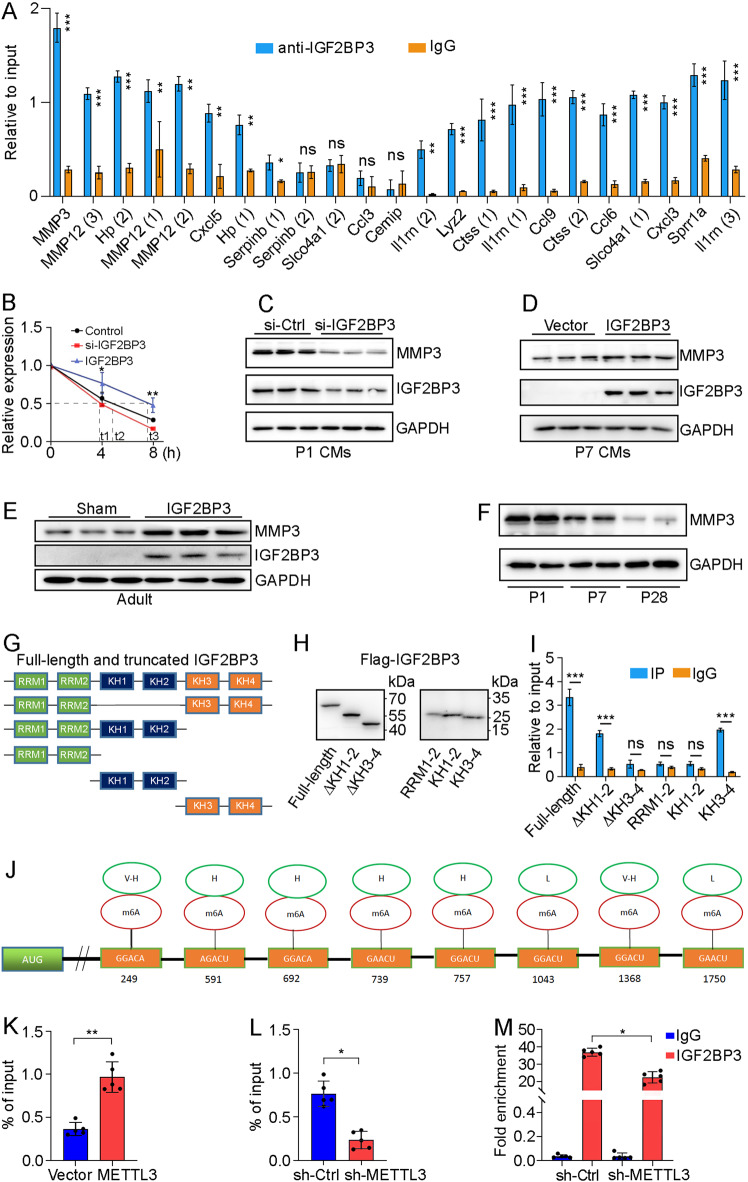
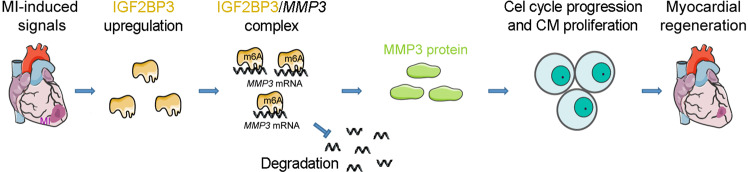
Myocardial infarction that causes damage to heart muscle can lead to heart failure. The identification of molecular mechanisms promoting myocardial regeneration represents a promising strategy to improve cardiac function. Here we show that IGF2BP3 plays an important role in regulating adult cardiomyocyte proliferation and regeneration in a mouse model of myocardial infarction. IGF2BP3 expression progressively decreases during postnatal development and becomes undetectable in the adult heart. However, it becomes upregulated after cardiac injury. Both gain- and loss-of-function analyses indicate that IGF2BP3 regulates cardiomyocyte proliferation in vitro and in vivo. In particular, IGF2BP3 promotes cardiac regeneration and improves cardiac function after myocardial infarction. Mechanistically, we demonstrate that IGF2BP3 binds to and stabilizes MMP3 mRNA through interaction with N6-methyladenosine modification. The expression of MMP3 protein is also progressively downregulated during postnatal development. Functional analyses indicate that MMP3 acts downstream of IGF2BP3 to regulate cardiomyocyte proliferation. These results suggest that IGF2BP3-mediated post-transcriptional regulation of extracellular matrix and tissue remodeling contributes to cardiomyocyte regeneration. They should help to define therapeutic strategy for ameliorating myocardial infarction by inducing cell proliferation and heart repair.


Conflict of interest statement

The authors declare no competing interests.

Figures

Fig. 1
Fig. 1. IGF2BP3 expression during mouse postnatal cardiac development and after MI.
A Western blot analysis of proteins related to m6A modification. Note the strong decrease and absence of IGF2BP3 expression at P7 and P28, respectively. B RT-qPCR analysis compares the relative expression of genes associated with m6A modification. Values in P1 conditions are set to 1 as a reference, after normalization to GAPDH. Data are the mean ± s.e.m. from three independent samples (*P < 0.05; **P < 0.01; ***P < 0.001; ns, not significant). C RT-qPCR analysis compares IGF2BP3 expression levels in CMs, ECs, and CFs from P1 and P7 hearts. The expression levels of IGF2BP3 in P1 conditions are set to 1 as a reference, after normalization to GAPDH. Data are the mean±s.e.m. from three independent samples (**P < 0.01; ***P < 0.001). D Immunostaining shows cytoplasmic localization of IGF2BP3 in cultured CMs, which were confirmed by the expression of cardiac Troponin T (cTnT). Scale bar: 20 µm. E Western blot analysis of cardiac IGF2BP3 expression at day 7 post-MI in neonatal and adult mice.
Fig. 2
Fig. 2. IGF2BP3 promotes proliferation of postnatal CMs in vitro.
A Flow cytometry analysis shows the increase of pH3-positive P7 CMs overexpressing IGF2BP3. B Western blot analysis of pH3 and Aurora B proteins in P7 CMs overexpressing IGF2BP3. C Effects of IGF2BP3 overexpression on CM proliferation. Representative images and statistical analyses of P7 CMs stained by cell proliferation markers. For each condition, 500–600 cells were analyzed from 6 independent samples (*P < 0.05). Scale bar: 50 µm. D Flow cytometry analysis shows increased proportion of CMs overexpressing IGF2BP3 at the S and G2/M phases of the cell cycle. E Effects of IGF2BP3 knockdown on CM proliferation. Representative images and statistical analyses of P1 CMs stained by indicated cell proliferation markers. For each condition, 500–600 cells were analyzed from 8 independent samples (*, P < 0.05). Scale bar: 50 µm. F Flow cytometry analysis shows decreased proportion of P1 CMs at the S and G2/M phases of the cell cycle following IGF2BP3 knockdown. GI TUNEL assay shows reduced apoptosis following overexpression of IGF2BP3 in MI heart. Data are the mean ± s.e.m. from three independent experiments (**P < 0.01). Scale bar: 50 µm.
Fig. 3
Fig. 3. IGF2BP3 promotes cardiac regeneration in adult mice after MI.
AD Immunostaining of CMs by pH3 and Ki67 at 7 days and 56 days (adult) after overexpression of IGF2BP3 in P1 mice. Sections are also stained with cTnT to show CMs, and DAPI staining helps to count individual CMs. For each condition, 2000–3000 cells from 8 mice were included in statistical analyses (**P < 0.01). Images at the bottom of each panel are higher magnifications corresponding to the boxed regions. Scale bars: 50 µm. EG Overexpression of IGF2BP3 increases the proportion of proliferating CMs, as shown by immunostaining of pH3 (E), Ki67 (F), and Aurora B (G) at 14 days post-MI. For each condition, 2100–2800 cells from 8 mice were included in statistical analyses (***P < 0.001). Images at the bottom of each panel are higher magnifications corresponding to the boxed regions. Scale bars: 50 µm. H Wheat germ agglutinin (WGA) staining shows increased CMs following IGF2BP3 expression in the adult MI heart, as determined by measuring the average cross section area of each CM. Data represent the mean ± s.e.m. from six independent sections using a total of 300 cells (*P < 0.05). Scale bar: 50 µm.
Fig. 4
Fig. 4. IGF2BP3 promotes myocardial regeneration and improves cardiac function after MI in adult mice.
AC Immunostaining of CD31 shows increased vasculature (arrows) in the MI heart following overexpression of IGF2BP3. Data are the mean ± s.e.m. from three independent experiments (***P < 0.001). Scale bar: 50 µm. D TTC staining of adult ventricular sections at 28 days post-MI shows reduced infracted area (red) following IGF2BP3 overexpression. Statistical analysis of infarcted area (white) was performed using 3 independent mice for each condition (*P < 0.05). E Representative images of Masson trichrome-stained adult heart sections show reduced fibrotic area at 28 days post-MI. Statistical analysis of fibrotic area was performed using 3 independent mice for each condition (**P < 0.01). F IGF2BP3 improves post-MI cardiac functionality. Cardiac ultrasound and analysis of ejection fraction (EF) and fractional shortening (FS) at indicated time point. Data are the mean ± s.e.m. from 3 independent mice (*P < 0.05; **P < 0.01; ns not significant).
Fig. 5
Fig. 5. RNA-seq analysis of IGF2BP3-dependent gene expression changes in P1 CMs.
A Heat map shows differentially expressed genes (DEGs) following IGF2BP3 knockdown (red, upregulated; blue, downregulated). B Volcano plot shows the numbers of differentially expressed genes. C Heat map shows the 15 top downregulated genes after knockdown of IGF2BP3. D GO analysis of the DEGs.
Fig. 6
Fig. 6. IGF2BP3 binds to MMP3 mRNA through m6A modification.
A RIP-qPCR analysis of IGF2BP3 interaction with indicated transcripts. Data are the mean ± s.e.m. from three independent experiments (*P < 0.05; **P < 0.01; ***P < 0.001; ns, not significant). B RT-qPCR analysis of MMP3 mRNA stability following overexpression or knockdown of IGF2BP3 in actinomycin D-treated P3 CMs. Data are the mean±s.e.m. from 3 independent experiments (*P < 0.05; **P < 0.01). C Knockdown of IGF2BP3 decreases the expression of MMP3 protein in P1 CMs. D Overexpression of IGF2BP3 increases the expression of MMP3 protein in P7 CMs. E Overexpression of IGF2BP3 in the apical region of adult mouse heart leads to increased expression of MMP3 protein. F MMP3 protein expression progressively decreases during postnatal development. G, H Schematic representation and western blot analysis of Flag-tagged full-length and truncated versions of IGF2BP3. I RIP-qPCR analysis shows the interaction between IGF2BP3 KH3 and KH4 domains with MMP3 mRNA. Data are the mean ± s.e.m. from three independent experiments (***P < 0.001; ns, not significant). J Predicted m6A recognition sites in MMP3 mRNA with indicated confidence levels (V-H, very high; H, high; L, low). K, L MeRIP enrichment followed by RT-qPCR analysis shows METTL3-dependent MMP3 mRNA methylation modification. Data are the mean±s.e.m. from 5 independent experiments (*P < 0.05; **P < 0.01). M RIP-qPCR analysis shows that knockdown of METTL3 reduces the binding of IGF2BP3 to MMP3 mRNA. Data are the mean ± s.e.m. from five independent experiments (*P < 0.05).
Fig. 7
Fig. 7. MMP3 functions downstream of IGF2BP3 in CM proliferation.
AC Overexpression of MMP3 in P7 CMs promotes cell proliferation, as revealed by flurescence staining (A), flow cytometry sorting (B), and western blot analysis (C) of cell cycle-related proteins. Statistical analyses of proliferating cells stained by EdU, pH3, and Ki67 were performed using 500–600 cells from 6 independent samples in each condition (*P < 0.05; **P < 0.01). Scales bar: 50 µm. D Western blot analysis shows that overexpression of MMP3 rescues the inhibitory effects of IGF2BP3 knockdown on the expression of cell cycle-related proteins. E Knockdown of MMP3 in P1 CMs decreases cell proliferation. Scale bar: 50 µm. For each condition, about 600 cells from six independent samples were included in statistical analyses (**P < 0.01). F Overexpression of MMP3 rescues the inhibitory effects of IGF2BP3 knockdown (designated as KD) on P1 CM proliferation. Scale bar: 50 µm. For each condition, about 600–900 cells from six independent samples were included in statistical analyses (*P < 0.05; **P < 0.01). G Flow cytometry analysis shows that overexpression MMP3 rescues CM proliferation inhibited by IGF2BP3 knockdown (*P < 0.05). H Flow cytometry analysis shows rescue effects of MMP3 overexpression on cell cycle progression inhibited by IGF2BP3 knockdown (*P < 0.05; **P < 0.01).
Fig. 8
Fig. 8. Model of functional interaction between IGF2BP3 and MMP3 in cardiac regeneration.
MI-induced signals activate IGF2BP3 expression in CMs. IGF2BP3 in turn stabilizes MMP3 mRNA by interacting with m6A methylation modification through the KH3 and KH4 domains. MMP3 may be implicated in remodeling the ECM to promote CM proliferation and regeneration.

References

    1. Shah AH, Puri R, Kalra A. Management of cardiogenic shock complicating acute myocardial infarction: a review. Clin Cardiol. 2019;42:484–93. doi: 10.1002/clc.23168. - DOI - PMC - PubMed
    1. Zhao L, Borikova AL, Ben-Yair R, Guner-Ataman B, MacRae CA, Lee RT, et al. Notch signaling regulates cardiomyocyte proliferation during zebrafish heart regeneration. Proc Natl Acad Sci USA. 2014;111:1403–8. doi: 10.1073/pnas.1311705111. - DOI - PMC - PubMed
    1. Wang W, Hu YF, Pang M, Chang N, Yu C, Li Q, et al. BMP and Notch signaling pathways differentially regulate cardiomyocyte proliferation during ventricle regeneration. Int J Biol Sci. 2021;17:2157–66. doi: 10.7150/ijbs.59648. - DOI - PMC - PubMed
    1. Porrello ER, Mahmoud AI, Simpson E, Hill JA, Richardson JA, Olson EN, et al. Transient regenerative potential of the neonatal mouse heart. Science. 2011;331:1078–80. doi: 10.1126/science.1200708. - DOI - PMC - PubMed
    1. Haubner BJ, Schneider J, Schweigmann U, Schuetz T, Dichtl W, Velik-Salchner C, et al. Functional recovery of a human neonatal heart after severe myocardial infarction. Circ Res. 2016;118:216–21. doi: 10.1161/CIRCRESAHA.115.307017. - DOI - PubMed