. 2023 May 15;14(1):2514.
doi: 10.1038/s41467-023-38093-5.

Extracellular matrix educates an immunoregulatory tumor macrophage phenotype found in ovarian cancer metastasis

Affiliations

Extracellular matrix educates an immunoregulatory tumor macrophage phenotype found in ovarian cancer metastasis

E H Puttock et al. Nat Commun. .

Abstract

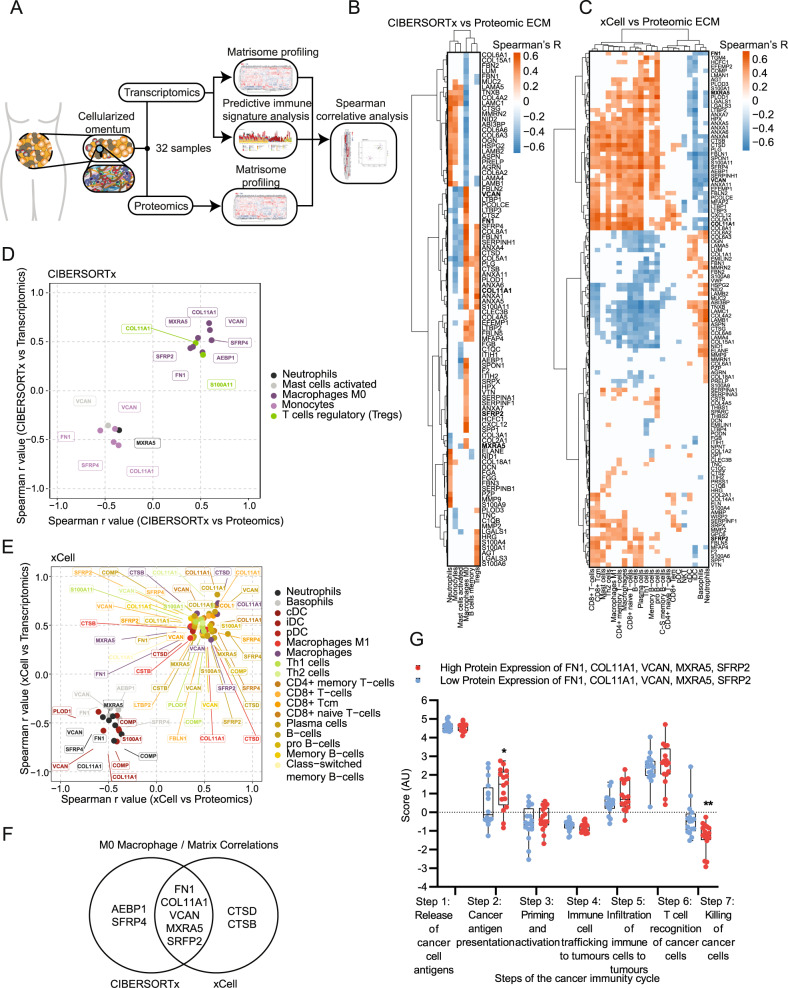
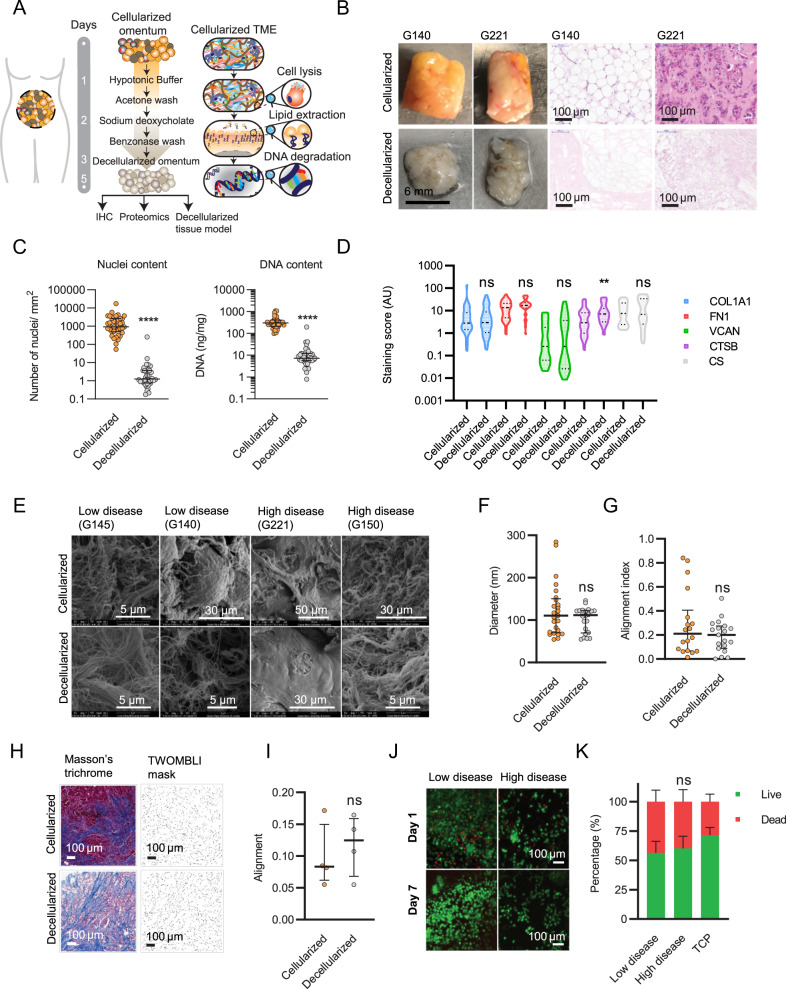
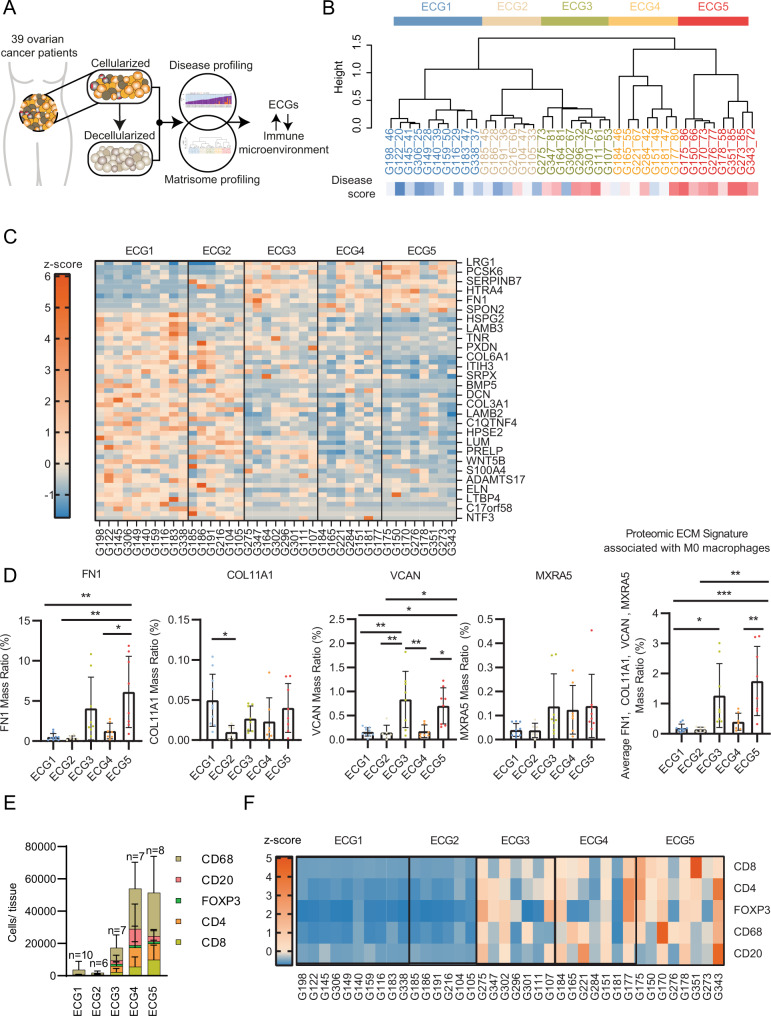
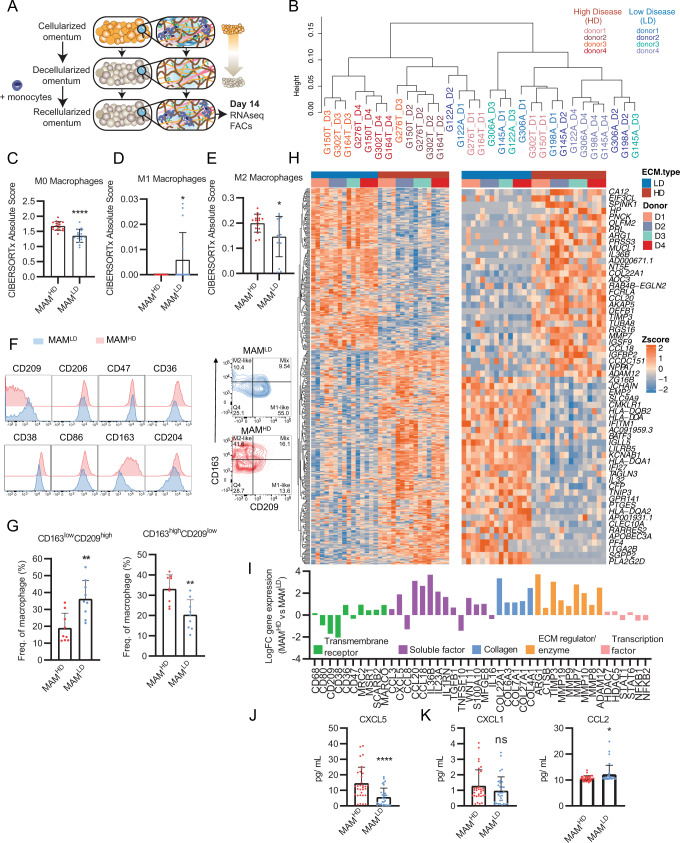
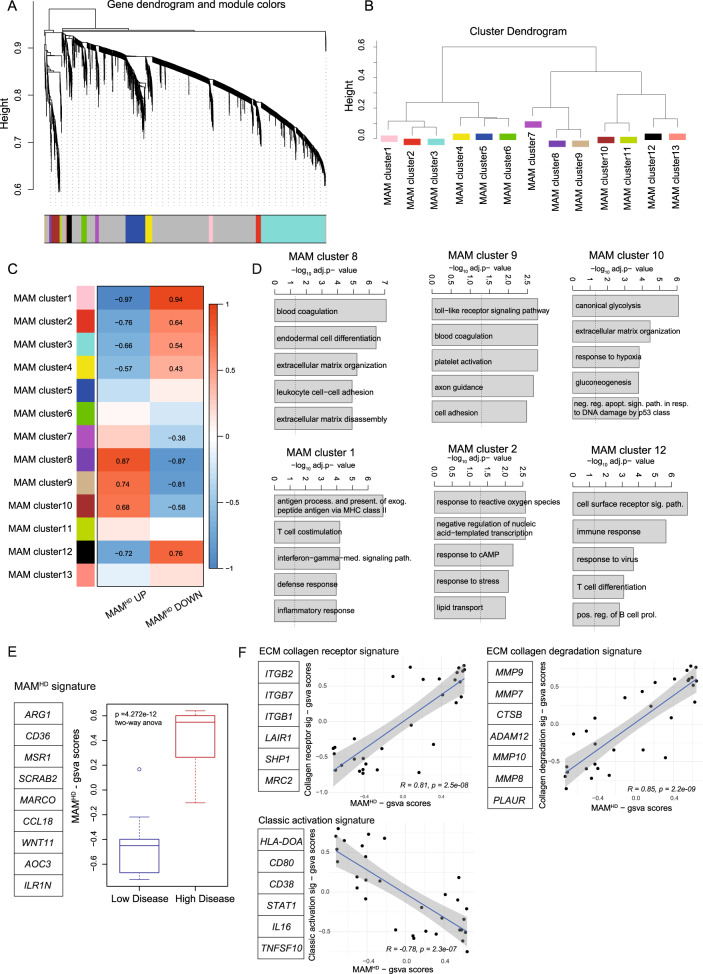
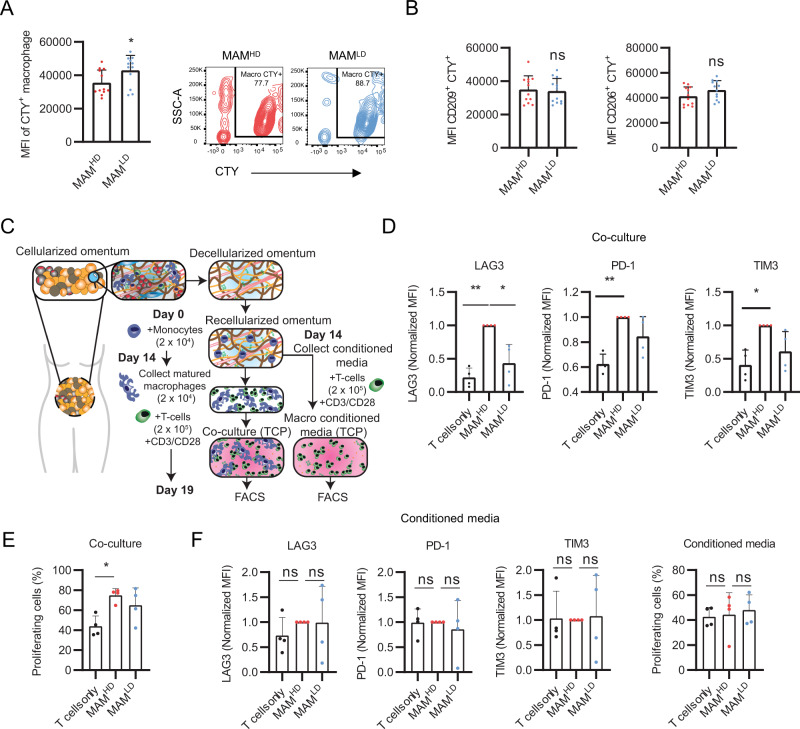
Recent studies have shown that the tumor extracellular matrix (ECM) associates with immunosuppression, and that targeting the ECM can improve immune infiltration and responsiveness to immunotherapy. A question that remains unresolved is whether the ECM directly educates the immune phenotypes seen in tumors. Here, we identify a tumor-associated macrophage (TAM) population associated with poor prognosis, interruption of the cancer immunity cycle, and tumor ECM composition. To investigate whether the ECM was capable of generating this TAM phenotype, we developed a decellularized tissue model that retains the native ECM architecture and composition. Macrophages cultured on decellularized ovarian metastasis shared transcriptional profiles with the TAMs found in human tissue. ECM-educated macrophages have a tissue-remodeling and immunoregulatory phenotype, inducing altered T cell marker expression and proliferation. We conclude that the tumor ECM directly educates this macrophage population found in cancer tissues. Therefore, current and emerging cancer therapies that target the tumor ECM may be tailored to improve macrophage phenotype and their downstream regulation of immunity.


Conflict of interest statement

The authors declare no competing interests.

Figures

Fig. 1
Fig. 1. M0 macrophages are enriched in highly diseased HGSOC samples and significantly correlate with a matrisome signature.
A Schematic of bioinformatics pipeline. B Heatmap of ECM proteins significantly associated with immune cells from CIBERSORTx analysis. Spearman’s r values with two-sided alternative hypothesis testing representing correlation between immune abundances and protein expression levels are plotted according to the color scale, with positive correlations in red and negative in blue. White colored associations are insignificant with a correlation p > 0.05, N = 32 HGSOC samples. Ordered by unsupervised clustering. C Heatmap of ECM proteins significantly associated with significant immune cells from xCell analysis. Spearman’s r values with two-sided alternative hypothesis testing representing correlation between immune abundances and protein expression levels are plotted according to the color scale, with positive correlations in red and negative in blue. Cream-colored associations are insignificant with a correlation p > 0.05, N = 32 HGSOC samples. Ordered by unsupervised clustering. D, E Scatterplot of significant protein and gene correlations with associated immune cell types using D CIBERSORTx and E xCell in HGSOC. Spearman’s regression analysis with two-sided alternative hypothesis testing was completed to generate plotted r values. Points are colored based on their associated immune cell type as depicted in the key. F Venn diagram showing overlap of ECM molecules significantly associated with CIBERSORTx M0 macrophage signature and xCell macrophage signature. G Boxplot of predicted tumor immune phenotype stage scores by TIP, with HGSOC samples separated by high (red) and low (blue) protein expression levels of FN1, VCAN, MXRA5, COL11A1, SFRP2. Scores are based upon expression of signature genes and represent activity levels. Within each box, the center line denotes the median value (50th percentile) while the box extends from the 25th to the 75th percentile; whiskers mark the maximum and minimum values. Two-way ANOVA significance between each group is presented as **p = 0.005 and *p = 0.0204. N = 32 HGSOC samples (16 low and 16 high).
Fig. 2
Fig. 2. A decellularized tissue model of ovarian cancer metastasis.
A Schematic of the decellularization procedure and tissue processing. B Fresh tissue biopsies taken from ovarian cancer patients. Histologically uninvolved samples from benign tumors were used as part of the group of low disease tissues. H&E staining of sectioned ovarian cancer samples (G140, G221). Tissue biopsies, Scale bar = 6 mm. H&E, Scale bar = 100 µm. C Nuclei and nucleic acid content in cellularized and decellularized tissue samples. Data are presented as median values +/− interquartile range (IQR). Two-tailed unpaired t test. Nuclei ****p = 0.000085; Nucleic acid content ****p = 1.198 × 10−13. N = 39 each. D IHC staining analysis using Definiens® digital image software for matrix molecules in cellularized and decellularized samples. Violin plot in which the center line denotes the median value (50th percentile) and dashed lines denote the 25th and 75th percentile. Mixed-effects analysis, with Sidak’s multiple comparisons test, **p = 0.0096. N = 39 per stain. E Representative Scanning Electron Microscopy (SEM) images for cellularized and decellularized samples. N = 6 each. F Quantitative fiber diameter analysis from SEM images. Three to six fields of view were chosen at random in cellularized and matched decellularized tissue micrographs. Data are presented as median values +/− IQR. Two-tailed unpaired t test. N = 6 each. Fiber diameter angles were recorded (minimum 30 fibers quantified per field of view). G Quantitative fiber alignment (alignment index) from SEM images. The alignment index ranges from 0 to 1, with 1 indicating perfect alignment, and 0 indicating disorganized fibers (as described in the methodology). Data are presented as median values +/− IQR. Two-tailed unpaired t test. N = 6 each. H Representative images of cellularized and decellularized tissue stained by Masson’s trichrome stain and representative images of the TWOMBLI mask generated for alignment analysis. Four fields of view were chosen at random. Scale bar = 100 µm. I TWOMBLI analysis showing alignment of collagen fibers stained in blue. Data are presented as median values +/− IQR. Two-tailed unpaired t test. N = 4 tissues. J Representative live (green)/dead (red) immunofluorescence (IF) images from decellularized tissue model cultures using monocytes/macrophages at day 1 and 7. N = 3. Scale bar = 100 µm. K Flow cytometry analysis of viable macrophages collected after 14 days of culture from low disease samples, high disease samples and tissue culture plastic (TCP). Data are presented as mean values +/− standard deviation (SD). Two-way ANOVA with Sidak’s multiple comparisons test. N = 3.
Fig. 3
Fig. 3. ECM composition correlates with the immune cell landscape.
A Schematic showing integration analysis using the disease score (disease profiling) and ECM proteomics (matrisome profiling) of ovarian metastatic samples to define the ECM composition and explore the synergy with ECM composition and the immune cell landscape. B Hierarchal unsupervised clustering (ward.D2 method) separated the tissue samples into five groups, based on the samples ECM protein expression, that we have termed as ECM composition groups (ECG) 1–5. Labels: tissue ID _disease score. Disease score (DS) displayed as heatmap from low disease score (blue) to high (red). N = 39 samples. C Heat map using row z-scores of positively and negatively regulated matrisome proteins, columns grouped by ECG1-5. Protein names illustrated for every other row. Full list in source data. N = 39 samples. D Bar plots of protein expression (proteomics) for FN1, VCAN, COL11A1 and MXRA5 in ECG1-5. Data are presented as mean values +/− SD. One-way ANOVA with Tukey’s post-hoc test, significance between each group is presented as **p < 0.01 and *p < 0.05. ECG1 N = 10 samples; ECG2 N = 6 samples; ECG3 N = 8 samples; ECG4 N = 7 samples; ECG5 N = 8 samples. E Immune cells were detected by IHC and analyzed by QuPath; mean number of immune cells/number of tissues between ECG1-5. Data are presented as mean values +/− SD. ECG1 N = 10 samples; ECG2 N = 6 samples; ECG3 N = 7 samples (G164 not included as not enough tissue for this analysis); ECG4 N = 7 samples; ECG5 N = 8 samples. F Row z-scores of IHC immune cells/mm2. ECG1 N = 10 samples; ECG2 N = 6 samples; ECG3 N = 7 samples (G164 not included as not enough tissue for this analysis); ECG4 N = 7 samples; ECG5 N = 8 samples.
Fig. 4
Fig. 4. Tumor ECM alters the macrophage transcriptome.
A Schematic of macrophage decellularized tissue culture. Monocytes/macrophages from four separate blood donors were cultured for 14 days on high disease (MAMHD) (N = 4) or low disease (MAMLD) (N = 4) decellularized tissues. Total N = 31, 4 blood donors, x4 high disease samples, x4 low disease samples (minus G198_D3 (Supplementary Fig. 19B)). Each sample represents six (wells) pooled culture samples from a 96-well plate, each well containing 200,000 cells. B Unsupervised cluster dendrogram using DE genes from HD or LD MAMs. CE Bar plots of CIBERSORTx analysis using DE genes between HD and LD MAMs for C M0 macrophage, D M1 macrophage, and E M2 macrophage signatures. Data are presented as mean values +/− SD. Two-tailed unpaired t test. ****p = 0.000034; M1 *p = 0.0368; M2 *p = 0.0216. N = 16 HD MAM samples, N = 15 LD MAM samples. F Flow cytometry histograms of transmembrane receptors expressed on HD and LD ECM cultured macrophages. Representative contour plot of HD and LD MAMs. G Bar plots of flow cytometry expression patterns of CD163 and CD209 between HD and LD MAMs, shown as percentage from the CD45+ CD14+ macrophage population. For example, CD163low and CD209high populations were selected from the bottom-right gating (M1-like) and CD163high and CD209low populations were selected from the top-left gating (M2-like) from Fig. 4F contour flow cytometry plots. Data are presented as mean values +/− SD. Two-tailed Mann-Whitney U test, p = 0.004 and two-tailed unpaired t test, p = 0.0016, respectively. N = 3 LD MAM or HD MAM samples, with 3 technical repeats for each sample. H Heatmap of row z-scores of log2TPM gene expression for top 30 (right panel) up- and downregulated genes; total (left panel) up- and downregulated genes (adj. p < 0.05, logFC > |1|, protein coding). Samples split by ECM type (LD (blue) or HD (brown)) and donor 1–4 i.e., blood donors. I Bar plot of selected DE genes (from the list of top 30) between HD versus LD cultured macrophages. J LEGENDPLEX™ assay of secreted CXCL5. Each dot represents the mean value of sample duplicates for each blood donor per tissue. Data are presented as mean values +/− SD. Two-tailed Mann-Whitney U test, p < 0.0001. N = 16 each. K LEGENDPLEX™ assay of secreted CXCL1 and CCL2 expression levels. Data are presented as mean values +/− SD. Two-tailed unpaired t test, *p = 0.0151. N = 16 each.
Fig. 5
Fig. 5. HD MAMs infer immunoregulatory phenotype.
A WGCNA of human macrophages cultured on HD and LD decellularized tissue showing clusters of co-expressed genes as dendrogram. Numbers indicate different modules (gene programs). N = 16 HD MAM samples, N = 15 LD MAM samples. B Cluster dendrogram of module eigenvalues (MEs) showing associated gene programs from WGCNA of human macrophages cultured on high and low disease decellularized tissue. N = 16 HD MAM samples, N = 15 LD MAM samples. C Heatmap of association of ME with gsva scores of the HD vs. LD, up and down. Pearson’s r-values with two-sided alternative hypothesis testing are noted for the significant correlations p < 0.05. N = 16 HD MAM samples, N = 15 LD MAM samples. D Bar plots for significantly enriched gene ontology biological processes in clusters 8, 9, 10, and 1, 2, 12 gene programs. Broken line denotes adjusted p = 0.05. Hypergeometric test with multiple comparisons correction using the Bonferroni method. N = 16 HD MAM samples, N = 15 LD MAM samples. E Boxplot of selected DE HD MAM genes termed HD MAM signature. Boxplots illustrate median (center of the box) with the upper (Q3: 75th percentile) and lower (Q1: 25th percentile) quartiles (ends of the box); The whiskers correspond to Q3 + 1.5 x Interquartile Range (IQR) to Q1 − 1.5 x IQR; Dots beyond the whiskers show potential outliers. Two-way ANOVA, p = 4.272e−12. N = 16 HD MAM samples, N = 15 LD MAM samples. F Correlation scatter plots of gsva scores from gene lists. GSVA scores were calculated from the MAM RNAseq dataset using the gene lists indicated next to the scatterplots and R package gsva. Correlation coefficient corresponds to Pearson’s correlation. Line was fitted with linear model (lm) with 95% confidence interval displayed. p values and correlation coefficients correspond to Pearson’s method, with two-sided alternative hypothesis testing. N = 16 HD MAM samples, N = 15 LD MAM samples.
Fig. 6
Fig. 6. HD MAMs have a reduced phagocytic response and alter T cell activation in the presence of CD3 and CD28 stimulation.
MAMs were cultured for 14 days and K562 cells were cultured for 5 days prior to use in phagocytosis assay. Cell types were mixed for phagocytosis assay. A Flow cytometry analysis of mean fluorescence intensity (MFI) of HD (MAMHD) and LD MAMs (MAMLD). Data are presented as mean values +/− SD. p = 0.02. Two-tailed Mann-Whitney U test used. Representative contour plots of CTY+ macrophages cultured between HD and LD ECM. N = 4 LD MAM or HD MAM samples, with 3 technical repeats per sample. B MFI of CD209+ and CD206+ CTY+ cells. Data are presented as mean values +/− SD. Two-tailed unpaired T-test used. p = 0.77, p = 0.11, respectively. N = 4 LD MAM or HD MAM samples, with 3 technical repeats per sample. C Schematic of MAMs and T cell co-culture workflow. Flow gating strategy provided in Supplementary Fig. 24. D Normalized MFI of LAG3, PD1 and TIM3 expression on CD3+ T cells as assessed using flow cytometry after 5 days culture alone or co-culture with HD or LD MAMs. Data are presented as mean values +/− SD. One-way ANOVA followed by Dunnett’s multiple comparisons test. LAG3 **p = 0.0026, *p = 0.0444, PD-1 **p = 0.0039, TIM3 *p = 0.0209, N = 4. E Percentage of proliferating CD3+ T cells as assessed by Cell Trace Violet dilution using flow cytometry after 5 days culture alone or co-culture with high or low disease MAMs. Data are presented as mean values +/− SD. One-way ANOVA followed by Dunnett’s multiple comparisons test. *p = 0.013, N = 4. F Normalized MFI of LAG3, PD-1, and TIM3 expression on CD3+ T cells and percentage of proliferating CD3+ T cells as assessed using flow cytometry after 5 days culture alone or co-culture with high or low disease MAMs conditioned media. Data are presented as mean values +/− SD. One-way ANOVA followed by Dunnett’s multiple comparisons test. N = 4.

References

    1. Pearce OMT, et al. Deconstruction of a metastatic tumor microenvironment reveals a common matrix response in human cancers. Cancer Disco. 2018;8:304–319. doi: 10.1158/2159-8290.CD-17-0284. - DOI - PMC - PubMed
    1. Chakravarthy A, Khan L, Bensler NP, Bose P, De Carvalho DD. TGF-β-associated extracellular matrix genes link cancer-associated fibroblasts to immune evasion and immunotherapy failure. Nat. Commun. 2018;9:4692. doi: 10.1038/s41467-018-06654-8. - DOI - PMC - PubMed
    1. Mariathasan S, et al. TGFβ attenuates tumour response to PD-L1 blockade by contributing to exclusion of T cells. Nature. 2018;554:544–548. doi: 10.1038/nature25501. - DOI - PMC - PubMed
    1. Tauriello DVF, et al. TGFβ drives immune evasion in genetically reconstituted colon cancer metastasis. Nature. 2018;554:538–543. doi: 10.1038/nature25492. - DOI - PubMed
    1. Nicolas-Boluda A, et al. Tumor stiffening reversion through collagen crosslinking inhibition improves T cell migration and anti-PD-1 treatment. Elife. 2021;10:e58688. doi: 10.7554/eLife.58688. - DOI - PMC - PubMed

Publication types