. 2023 May 15;14(1):2779.
doi: 10.1038/s41467-023-38410-y.

Peripheral modulation of antidepressant targets MAO-B and GABAAR by harmol induces mitohormesis and delays aging in preclinical models

Affiliations

Peripheral modulation of antidepressant targets MAO-B and GABAAR by harmol induces mitohormesis and delays aging in preclinical models

Luis Filipe Costa-Machado et al. Nat Commun. .

Abstract

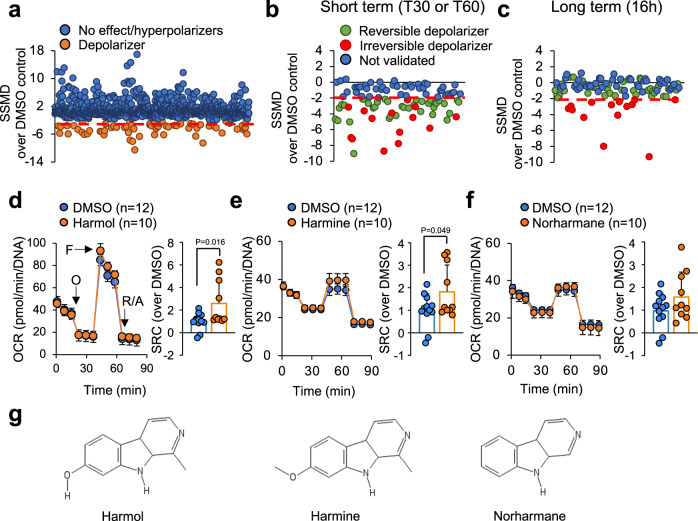
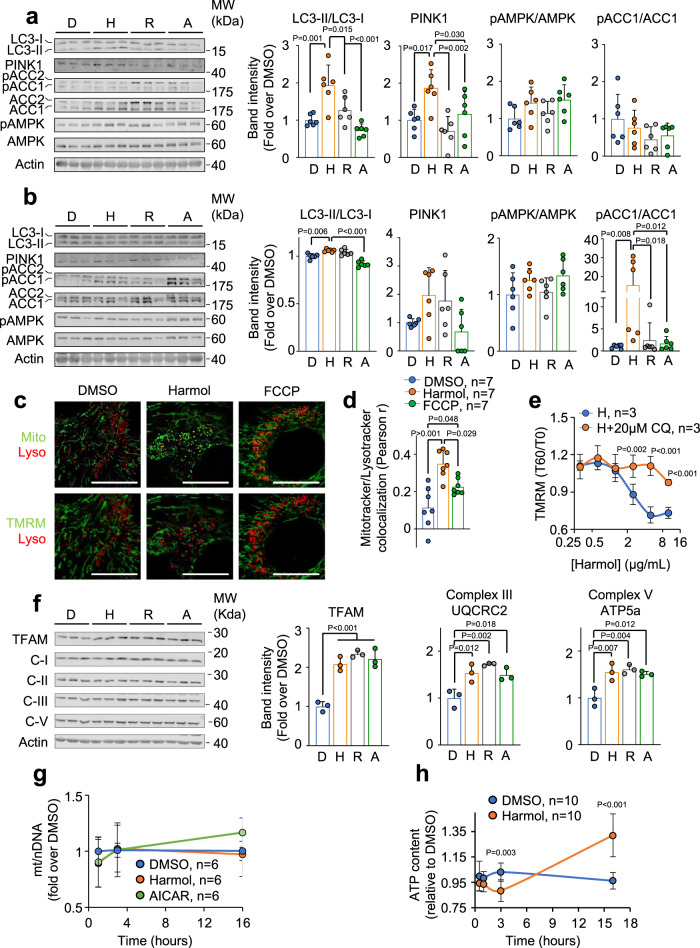
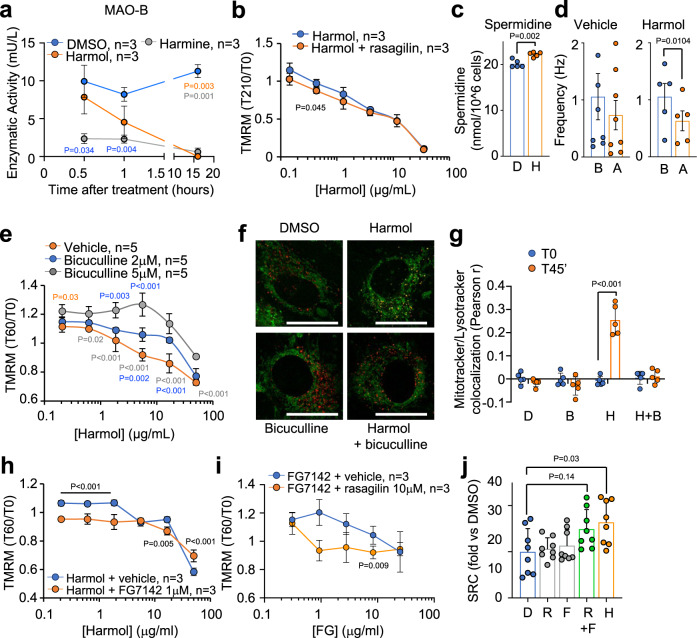
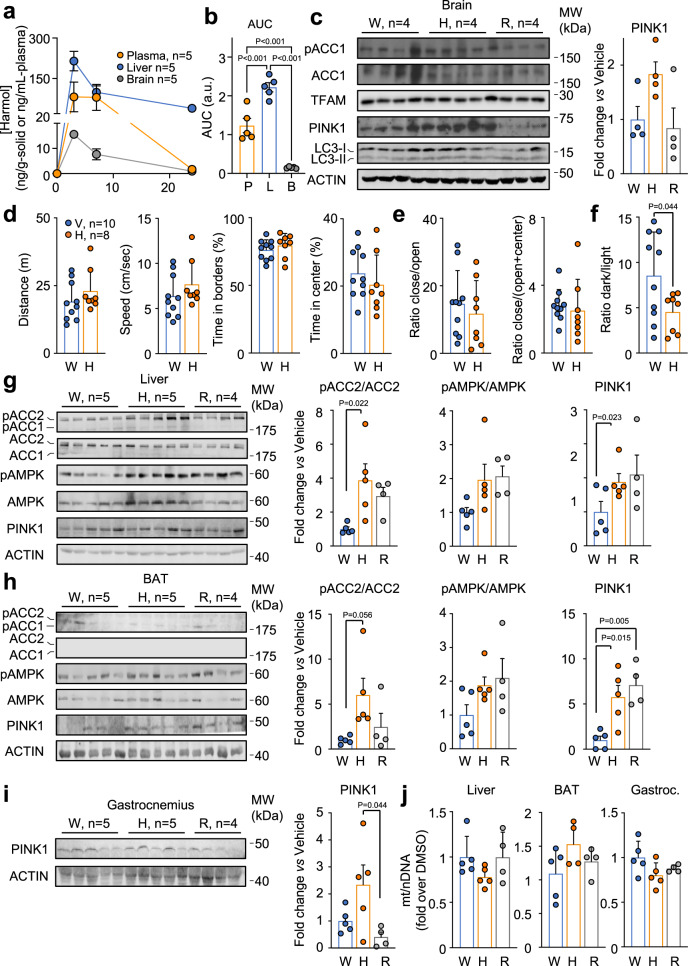
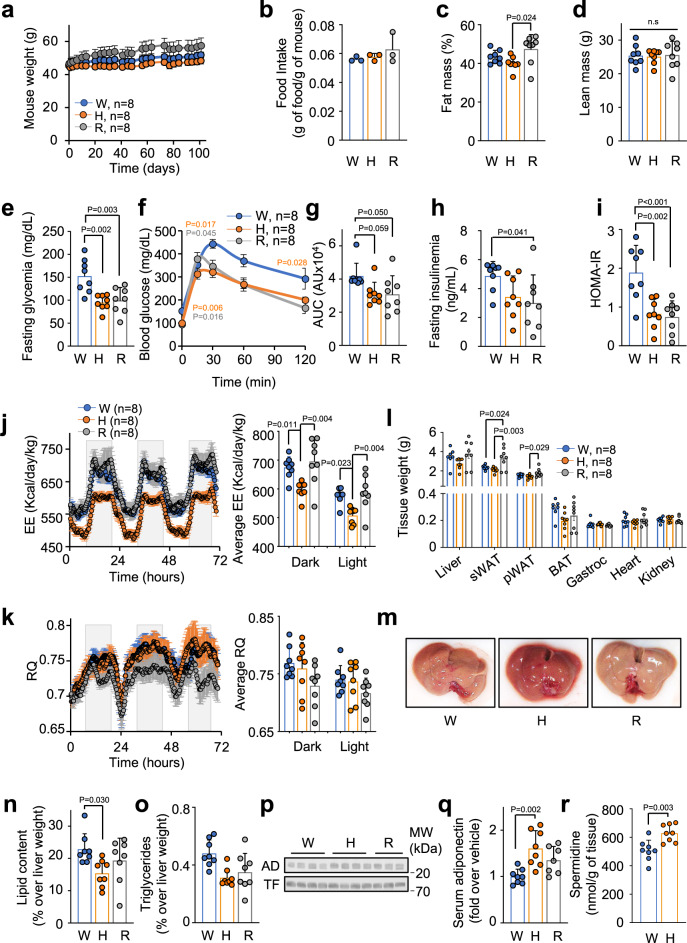
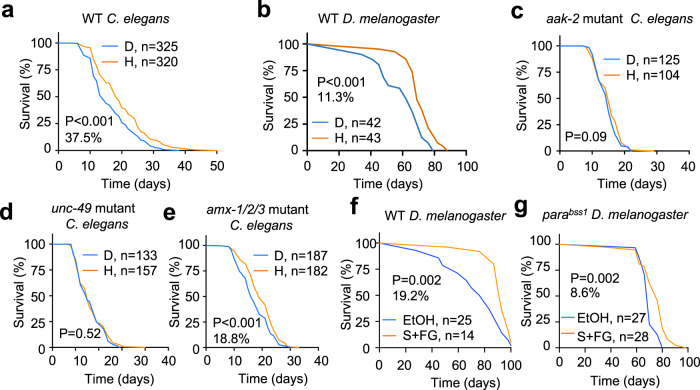
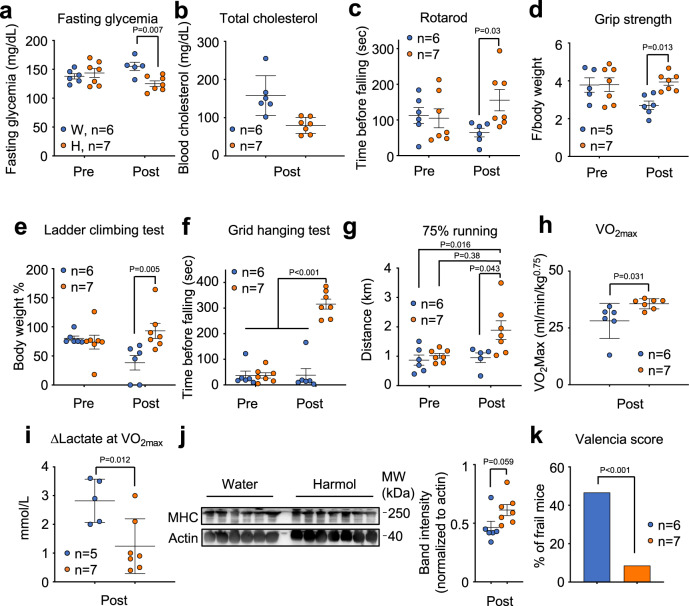
Reversible and sub-lethal stresses to the mitochondria elicit a program of compensatory responses that ultimately improve mitochondrial function, a conserved anti-aging mechanism termed mitohormesis. Here, we show that harmol, a member of the beta-carbolines family with anti-depressant properties, improves mitochondrial function and metabolic parameters, and extends healthspan. Treatment with harmol induces a transient mitochondrial depolarization, a strong mitophagy response, and the AMPK compensatory pathway both in cultured C2C12 myotubes and in male mouse liver, brown adipose tissue and muscle, even though harmol crosses poorly the blood-brain barrier. Mechanistically, simultaneous modulation of the targets of harmol monoamine-oxidase B and GABA-A receptor reproduces harmol-induced mitochondrial improvements. Diet-induced pre-diabetic male mice improve their glucose tolerance, liver steatosis and insulin sensitivity after treatment with harmol. Harmol or a combination of monoamine oxidase B and GABA-A receptor modulators extend the lifespan of hermaphrodite Caenorhabditis elegans or female Drosophila melanogaster. Finally, two-year-old male and female mice treated with harmol exhibit delayed frailty onset with improved glycemia, exercise performance and strength. Our results reveal that peripheral targeting of monoamine oxidase B and GABA-A receptor, common antidepressant targets, extends healthspan through mitohormesis.


Conflict of interest statement

F.M. is scientific cofounder of Samsara Therapeutics, a company that develops novel pharmacological autophagy inducers. F.M. and T.E. have equity interests in and are advisors of TLL The Longevity Labs GmbH. The remaining authors declare no competing interests.

Figures

Fig. 1
Fig. 1. Screening for mitohormetics.
a Strictly standardized mean difference (SSMD) of each of the 982 compounds tested at 30 or 60 min after treatment of differentiated C2C12 myotubes (the lowest SSMD from the two timepoints in indicated). Compounds that induced a SSMD ≤ −2 are shown in orange (depolarizers). Compounds that increased mitochondrial potential or had no effect are shown in blue. b SSMD of the 96 depolarizing compounds identified in (a) were quantified 30 or 60 min after compound addition, and the lowest SSMD of both times is represented. c The same experiment as in (b), but measured 16 hours after compound addition. df Left panels represent the oxygen consumption rates (OCR) in differentiated C2C12 myotubes treated for 16 h with 1.3 μg/ml of harmol (d), harmine (e) or norharmane (f) following the sequential addition of oligomycin A (O), FCCP (F) and Rotenone/Antimycin A (R/A) at the indicated times (Mitostress Seahorse experiment). Panels on the right represent the spare respiratory capacity (SRC) parameter of the complete Mitostress experiment. g Chemical structure of the indicated compounds. Bars and line-connected circles represent the mean of the indicated number of replicates. Individual dots represent independent cell samples. Error bars represent the standard deviation. Isolated circles represent single replicates. Statistical significance was assessed calculating the SSMD parameter (ac) or using the two-tailed unpaired Student t test (df). P values are indicated when P < 0.05. Source data are provided as a Source Data file.
Fig. 2
Fig. 2. In vitro mechanistic characterization of the mitochondrial effects of harmol.
a, b Western blots of the indicated proteins in differentiated C2C12 myotubes 1 h (a) or 3 h (b) after treatment with 0.1% DMSO, 1.3 μg/ml harmol (H), 30 μM rosiglitazone (R) or 250 μM AICAR (A). Quantifications of the significantly different proteins are shown in the bar graphs to the right (n = 6 independent cell samples for each condition). c Confocal images of differentiated C2C12 cells treated with DMSO (01%), harmol (1.3 µg/ml) or FCCP (500 nM) for 45 min and stained for mitochondria with Mitotracker (Mito); for lysosomes with Lysotracker (Lyso); or for active mitochondria with TMRM. d Quantification of the colocalization of Mitotracker and Lysotracker staining, calculated as the Pearson r correlation coefficient in the same cells and treatments as in (c). e C2C12 myotubes stained with TMRM were treated with the indicated concentrations of harmol alone or combined with 20 µM chloroquine (CQ) for 30 min, and then TMRM intensity was recorded before (T0) and 60 min after (T60) treatment with harmol. f Western blots of the indicated proteins in differentiated C2C12 myotubes 16 h after treatment with 0.1% DMSO, 1.3 μg/ml harmol (H), 30 μM rosiglitazone (R) or 250 μM AICAR (A). (n = 6 independent cell samples for each condition). g Quantitative PCR experiments measuring the ratio between mitochondrial DNA and nuclear DNA (mt/nDNA) in differentiated C2C12 myotubes treated with 1.3 µg/ml harmol or 250 μM AICAR for the indicated times. h ATP content in differentiated C2C12 myotubes treated with 0.1% DMSO or with 1.3 μg/ml harmol was assessed at the indicated timepoints (a.u. arbitrary units). Bars and line-connected dots represent the average of the indicated replicates. Dots in bar graphs (a, b, d, f, g) represent independent cultured cell samples. Each lane in Western blots (a, b, f) represents independent cell samples. Error bars represent the standard deviation. Statistical significance was assessed using the one-way ANOVA (a, b, d, f) or the two-way ANOVA (e, g, h) tests with Tukey’s correction for multiple comparisons. P values are indicated when P < 0.05. Source data are provided as a Source Data file.
Fig. 3
Fig. 3. Mechanisms of harmol functions in mitochondria.
a C2C12 myotubes were treated with 0.1% DMSO, 1.3 μg/ml harmol or 1.3 μg/ml harmine, and specific MAO-B activity was measured at the indicate times. b C2C12 myotubes stained with TMRM were treated with rasagilin, and then with the indicated concentrations of harmol, and TMRM fluorescence was measured at T0 and T210. c C2C12 myotubes were treated with vehicle (0.1% DMSO, D) or with 1.3 μg/ml harmol (H) during 24 h, and spermidine levels were measured. d Frequency of spontaneous inhibitory currents (sIPSCs) events measured in mouse hippocampal slices (n = 5 from 3 different animals) before (B) and after (A) treatment with 1.3 μg/ml harmol. e C2C12 myotubes stained with TMRM were treated with the indicated concentrations of harmol and bicuculline, and TMRM fluorescence was measured at T0 and T60 after treatment. f Confocal images of differentiated C2C12 myotubes treated with DMSO (0.1%), harmol (1.3 µg/ml), bicuculline (5 µM) or the combination of harmol + bicuculline, and stained for total mitochondria with Mitotracker (green) and for lysosomes with Lysotracker (red). Size bar = 25 µm. Colocalization of Mitotracker and Lysotracker is shown in yellow. g Quantified Mitotracker and Lysotracker colocalization from (f). h, i C2C12 myotubes were treated with increasing concentrations of harmol and 1 µM FG7142 (h); or with increasing concentrations of FG7142 and 10 µM rasagilin (i), and TMRM fluorescence was measured at T0 and T60. j Spare respiratory capacity (SRC) of C2C12 myotubes treated for 16 h with 0.1% DMSO, 1 μM rasagiline (R), 2 μM FG7142 (F) or the combination of 1 µM rasagilin and 2 µM FG7142 (R + F), or with 1.3 μg/ml harmol, and then analyzed by Seahorse. Bars and line-connected dots represent the average of the indicated independent replicates. Dots in bar graphs represent independent cell samples. Error bars represent the standard deviation. Statistical significance was assessed using the two-way (a, b, e, h, i) or the one-way (g, j) ANOVA with Tukey correction for multiple comparisons; or the two-tailed unpaired Student t-test (c, d). P values are indicated when P < 0.05. Color codes of P values indicate the groups being compared. Source data are provided as a Source Data file.
Fig. 4
Fig. 4. In vivo effects of acute treatment with harmol.
a Harmol levels were measured by HPLC/MS in plasma, liver and brain samples form 12 week-old C57BL/6JHsdOla male mice treated with 100 mg/kg harmol by oral gavage and sacrificed 3, 7 and 24 hours after treatment. b Area under the curve (AUC) of the harmol levels of plasma (P), liver (L) and brain (B) shown in (a). c Western blots of the indicated proteins in brain 7 h after oral gavage administration of vehicle (water, V), 100 mg/kg harmol (H) or 10 mg/kg rosiglitazone (R). Quantification of PINK1 levels is shown in the bar graph to the right. df Behavioral assays testing anxiety-like behavior in mice after treatment with 100 mg/kg/day (H) or vehicle (water, W) in the drinking water during 3 weeks: open field test parameters (distance, speed, time in borders and time in center, d); elevated plus maze test parameters (ratio close/open and ratio close/(open+center), e); and dark-light box test parameter (ratio dark/light, f). gi Western blots of the indicated proteins in liver (g), brown adipose tissue (BAT, h) or gastrocnemius muscle (i) from the same mice shown in (ac). Quantifications of the indicated proteins are shown in the bar graphs to the right. j Quantitative PCR experiment measuring the ratio between mitochondrial and nuclear DNA (mt/nDNA) in the indicated tissues from the same mice as shown in (gi). Bars and line-connected dots represent the average of the indicated replicates. Dots in bar graphs (bj) represent samples or measures from independent animals. Each lane in Western blots (c, gi) represents samples from independent animals. Error bars represent the standard error of the mean. Statistical significance was assessed using the one-way ANOVA test with Tukey’s correction for multiple comparisons (b, c, gj) or the unpaired two-tailed Student’s t test (df). P values are indicated when P < 0.05. Source data are provided as a Source Data file.
Fig. 5
Fig. 5. In vivo effects of chronic treatment with harmol.
a Body weight of obese C57BL/6JHsdOla male mice (previously fed with HFD for 4 months since they were 12 weeks old) kept on HFD and treated with vehicle (water, W), 100 mg/kg harmol (H) or 10 mg/kg rosiglitazone in their drinking water for 3 months. b Average food intake in the same mice described in (a) during all the time of treatment with the indicated compounds (n = 3 cages/condition). At the end of the treatment indicated for (a), the same n = 8 mice were measured for their fat mass (c); lean mass (d); glycemia recorded after 16 h of fasting (e); glucose tolerance test (f; area under the curve is shown in (g)); insulinemia (h) and HOMA-IR (i) after 16 hours of fasting; energy expenditure (EE, j) and respiratory quotient (RQ, k) with their corresponding average values during day and night shown to the right; weight of the indicated tissues (l); liver macroscopic appearance (m); lipid and triglyceride content in the liver (n, o); blood adiponectin (AD) and transferrin (TF) measured by Western blot (p), with the band quantification shown in (q); and spermidine levels in the liver (r). Bars and line-connected dots represent the average of the indicated number of individuals. Dots in bar graphs (be, gk, n, o, q, r) represent samples or measures from independent animals. Error bars represent the standard error of the mean. Statistical significance was assessed using the two-way ANOVA test with Tukey correction for multiple comparisons (a, f); and the one-way ANOVA test with Tukey correction for multiple comparisons in panels be, gI, l, and nr. P values are indicated when P < 0.05. Source data are provided as a Source Data file.
Fig. 6
Fig. 6. Treatment with harmol extends lifespan in worms and flies.
ad Kaplan–Meier survival curves including data from at least two independent replicates of the indicated genotypes of hermaphrodite C. elegans worms of the N2 strain treated from birth with vehicle (DMSO, D) or with 15 μg/ml harmol (H) (a, ce); of the indicated genotypes of Canton-S x w1118 female D. melanogaster flies (b, f, g) treated with vehicle (DMSO) or 25 μg/ml harmol (b); or with vehicle (ethanol, EtOH) or a combination of 0.75 μg/ml selegiline and 10 μg/ml FG7142 (f, g) since birth. The number of individual flies or worms is indicated in each panel. Statistical significance was assessed using the Log-rank (Mantel-Cox) test. Source data are provided as a Source Data file.
Fig. 7
Fig. 7. Treatment with harmol delayed aging and reduced frailty in old mice.
(af) Longitudinal assessment of healthspan in 2 year-old male and female C57BL/6JHsdOla mice before (Pre) and after (Post) 2 months of treatment with 100 mg/kg harmol in the drinking water: (a) fasting (5 h) glucose levels (n = 5–7); (b) total blood cholesterol levels at the end of the intervention (n = 6–7); (c) rotarod test (n = 6–7); (d) maximal grip strength in grams relativized by animal body weight (BW) (n = 5–7); (e) maximal carrying load in the ladder climbing test represented as a percentage of the animal BW (n = 6–7); (f) hanging endurance in the grid hanging test (n = 6–7); (g) endurance capacity in a running treadmill test (n = 5–7); (h) maximal oxygen consumption at the end of the intervention (n = 6–7); (i) lactate increment in the VO2max test (n = 6–7). (j) Western blot against total myosin heavy chain (MHC) in protein extracts from soleus muscle of aged male mice treated with the indicated treatments and normalized to actin. (k) Percentage of frail mice (from a total of n = 5–7 at the end of the intervention. Horizontal lines in the dot-plots represent the average of the indicated number of individuals. Dots represent samples or measures from independent animals. Error bars represent the standard error of the mean. Statistical significance was assessed using the two-way ANOVA test with Sidak’s correction for multiple comparisons (a, cg); the unpaired two-tailed Student t-test (b, hj); or the Chi square test (k). P values are indicated when P < 0.05. Source data are provided as a Source Data file.

References

    1. Sun N, Youle RJ, Finkel T. The mitochondrial basis of aging. Mol. Cell. 2016;61:654–666. doi: 10.1016/j.molcel.2016.01.028. - DOI - PMC - PubMed
    1. Schulz TJ, et al. Glucose restriction extends Caenorhabditis elegans life span by inducing mitochondrial respiration and increasing oxidative stress. Cell Metab. 2007;6:280–293. doi: 10.1016/j.cmet.2007.08.011. - DOI - PubMed
    1. Gonzalez-Freire M, et al. Skeletal muscle ex vivo mitochondrial respiration parallels decline in vivo oxidative capacity, cardiorespiratory fitness, and muscle strength: The Baltimore Longitudinal Study of Aging. Aging Cell. 2018;17:e12725. doi: 10.1111/acel.12725. - DOI - PMC - PubMed
    1. Szendroedi J, Phielix E, Roden M. The role of mitochondria in insulin resistance and type 2 diabetes mellitus. Nat. Rev. Endocrinol. 2012;8:92–103. doi: 10.1038/nrendo.2011.138. - DOI - PubMed
    1. Bansal Y, Kuhad A. Mitochondrial dysfunction in depression. Curr. Neuropharmacol. 2016;14:610–618. doi: 10.2174/1570159X14666160229114755. - DOI - PMC - PubMed

Publication types

MeSH terms