. 2023 May 15;14(1):2771.
doi: 10.1038/s41467-023-38475-9.

Glutamatergic cerebellar neurons differentially contribute to the acquisition of motor and social behaviors

Affiliations

Glutamatergic cerebellar neurons differentially contribute to the acquisition of motor and social behaviors

Meike E van der Heijden et al. Nat Commun. .

Abstract

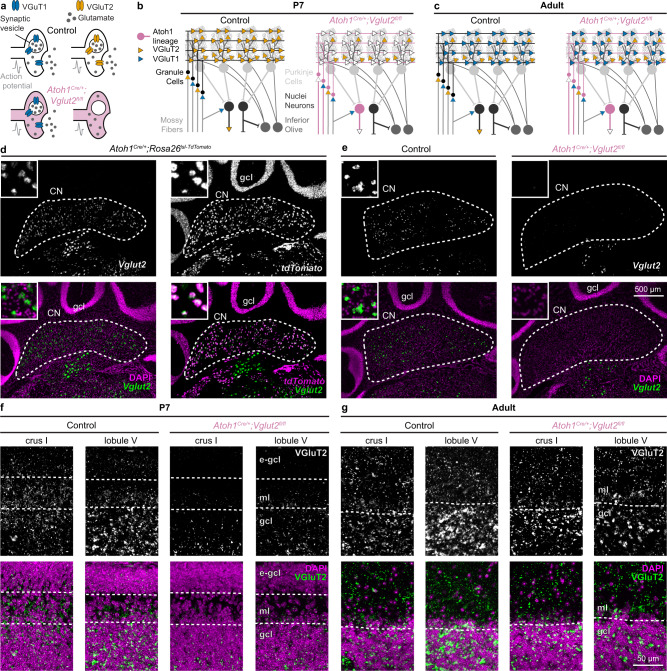
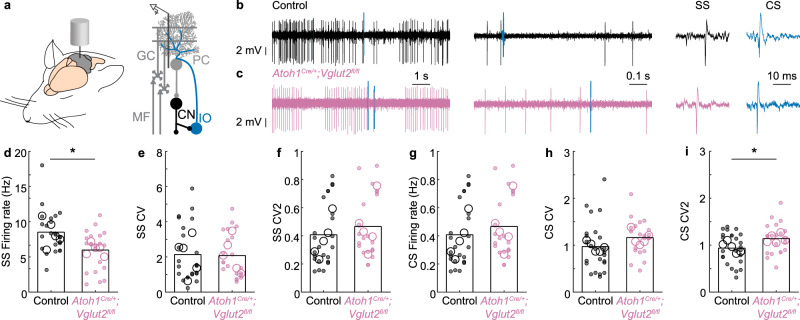
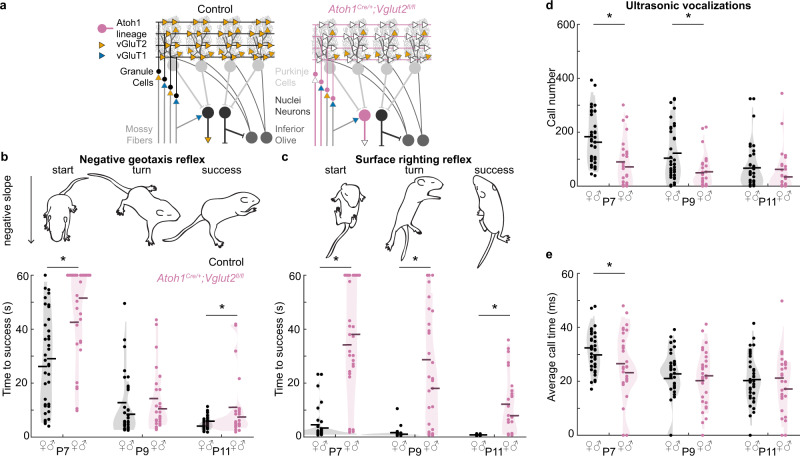
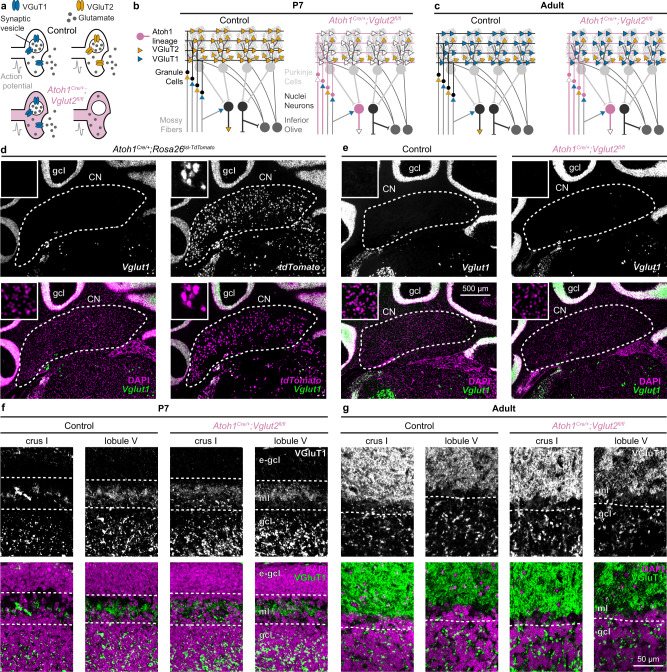
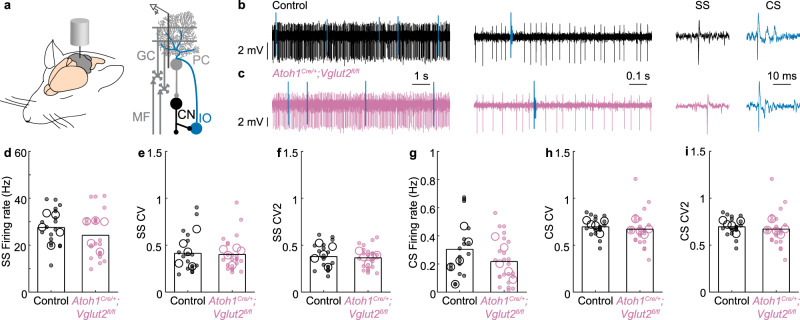
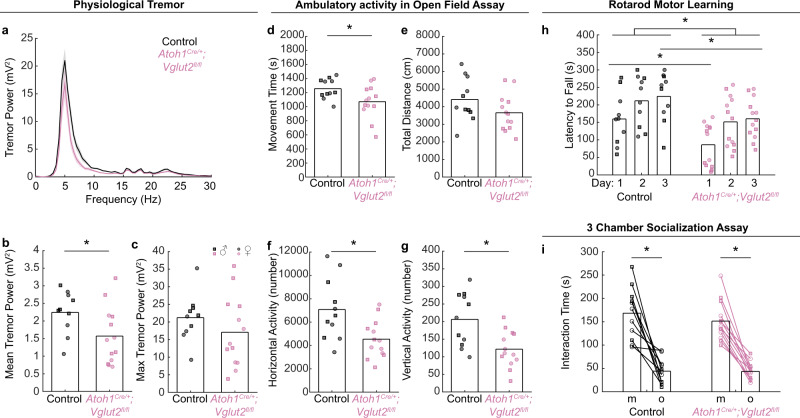
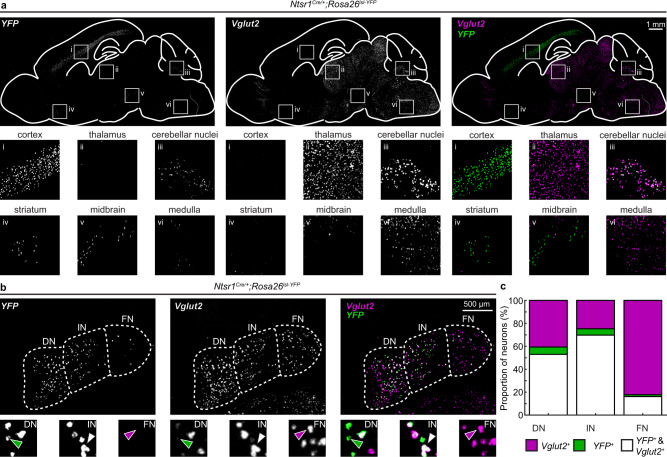
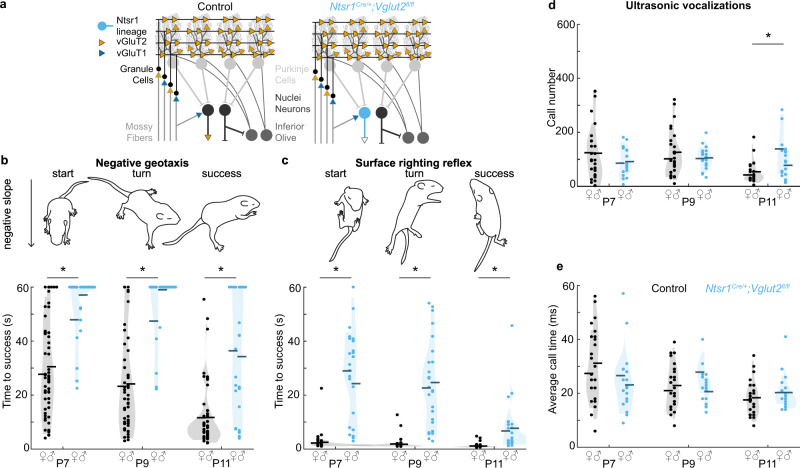
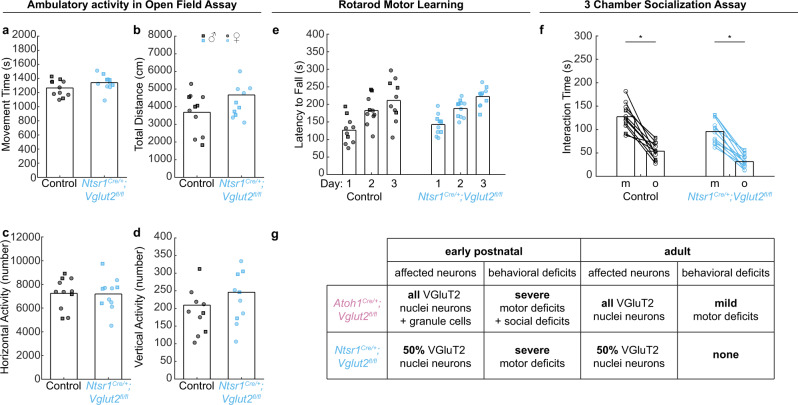
Insults to the developing cerebellum can cause motor, language, and social deficits. Here, we investigate whether developmental insults to different cerebellar neurons constrain the ability to acquire cerebellar-dependent behaviors. We perturb cerebellar cortical or nuclei neuron function by eliminating glutamatergic neurotransmission during development, and then we measure motor and social behaviors in early postnatal and adult mice. Altering cortical and nuclei neurons impacts postnatal motor control and social vocalizations. Normalizing neurotransmission in cortical neurons but not nuclei neurons restores social behaviors while the motor deficits remain impaired in adults. In contrast, manipulating only a subset of nuclei neurons leaves social behaviors intact but leads to early motor deficits that are restored by adulthood. Our data uncover that glutamatergic neurotransmission from cerebellar cortical and nuclei neurons differentially control the acquisition of motor and social behaviors, and that the brain can compensate for some but not all perturbations to the developing cerebellum.


Conflict of interest statement

The authors declare no competing interests.

Figures

Fig. 1
Fig. 1. Conditional Vglut2 deletion from Atoh1 lineage neurons.
a Schematic showing how conditional deletion of VGluT2 only affects fast neurotransmission in VGluT2-expressing neurons. b Schematic of cerebellar connectivity and vesicular transporter expression for the glutamate subtypes (VGluT1 and VGluT2) in the cerebellar circuit in P7 control mice and Atoh1Cre/+;Vglut2fl/fl conditional knockout mice. c Same as b, but in adult mice. For ac VGluT1 (blue); VGluT2 (orange); Control mice (black); Atoh1Cre/+;Vglut2fl/fl mice (reddish purple). d Expression of Vglut2 (green) with DAPI (purple, left) or tdTomato (purple, right) in the cerebellar nuclei (CN) and granule cell layer (gcl) of adult Atoh1Cre/+;Rosa26lsl-tdTomato mice. e Expression of Vglut2 (green) and DAPI (purple) in the CN and gcl of adult control mice and Atoh1Cre/+;Vglut2fl/fl mice. d, e insets are 125 by 125 µm high magnification images. f VGluT2+ synapses (green) and DAPI (purple) in the molecular layer (ml) and gcl of P7 control and Atoh1Cre/+;Vglut2fl/fl mice, e-gcl = external granule cell layer containing actively proliferating granule cell precursor cells. g VGluT2+ synapses (green) and DAPI (purple) in the ml and gcl of adult control mice and Atoh1Cre/+;Vglut2fl/fl mice. de are shown at the same scale. f, g are shown at the same scale. Images are representative of N = 3 mice.
Fig. 2
Fig. 2. Purkinje cell firing activity is abnormal in P10 Atoh1Cre/+;Vglut2fl/fl conditional knockout mice.
a Schematic of an in vivo single-unit extracellular Purkinje cell recording in an anaesthetized mouse. b Representative trace of a Purkinje cell recording in a control mouse (black and blue lines represent complex spikes). c Representative trace of a Purkinje cell recording in an Atoh1Cre/+;Vglut2fl/fl mouse (reddish purple, blue lines represent complex spikes). In b, c Inferior olive (IO) evoked complex spike (CS) in blue. The y-axis is constant across the panel. The x-axis (timescales) are the same for (b, c). d The frequency of Simple Spikes (SS) is different between control and Atoh1Cre/+;Vglut2fl/fl mice (p = 0.005; d = 0.81). e No differences were found in SS CV (spike pattern, p = 0.977; d = 0.04), f SS CV2 (spike regularity, p = 0.407; d = 0.26), g CS Frequency (p = 0.548, d = 0.22), or h CS CV (spike pattern, p = 0.171, d = 0.40). i Complex spikes occurred more regularly in control than in Atoh1Cre/+;Vglut2fl/fl mice CS CV2 (spike regularity, p = 0.039, d = 0.60). For di, large open circles represent the mouse average; small, closed circles represent the cell average; data points from control mice in black, data points from Atoh1Cre/+;Vglut2fl/fl mice in reddish purple. A linear mixed model analysis with genotype as a fixed variable and mouse number as a random variable was used to test for statistical significance in (di). Control: NMice = 5, nCells = 24 cells; Atoh1Cre/+;Vglut2fl/fl: Nmice = 5, nCells = 21. Source data and detailed statistical results are available and provided as a Source Data file. Panel (a) was adapted from White & Sillitoe, 2017, “Genetic silencing of olivocerebellar synapses causes dystonia-like behavior in mice,” Nature Communications under CC BY 4.0.
Fig. 3
Fig. 3. Motor behavior and social behavior are abnormal in early postnatal Atoh1Cre/+;Vglut2fl/fl mice.
a Schematic of circuit modifications in Atoh1Cre/+;Vglut2fl/fl conditional knockout mice. VGluT1 (blue); VGluT2 (orange); Control mice (black); Atoh1Cre/+;Vglut2fl/fl mice (reddish purple). b The time to turn upward on a negative slope was measured. Atoh1Cre/+;Vglut2fl/fl conditional knockout mice required a longer time to turn compared to control littermates at P7 (p < 0.001; d = 0.97) and P11 (p = 0.015; d = 0.59) but not at P9 (p = 0.431; d = 0.19). c The time to right themselves onto their four paws was measured. Atoh1Cre/+;Vglut2fl/fl mice required a longer time to turn compared to control littermates at P7 (p < 0.001; d = 1.49), P9 (p < 0.001; d = 1.26), and P11 (p < 0.001; d = 1.09). d The number of vocalizations after separation from the nest was measured. Atoh1Cre/+;Vglut2fl/fl conditional knockout pups made fewer vocalizations than their control littermates at P7 (p < 0.001; d = 0.90) and P9 (p = 0.004; d = 0.69) but not at P11(p = 0.373; d = 0.20). e The duration of vocalizations after separation from the nest was measured. Atoh1Cre/+;Vglut2fl/fl pups made shorter vocalizations compared to control littermates at P7 (p = 0.024; d = 0.55), but not at P9 (p = 0.700; d = 0.10) or P11 (p = 0.677; d = 0.10). Control: N = 38 (18f/20m); Atoh1Cre/+;Vglut2fl/fl: N = 30 (17f/13m). Dots represent the means for each mouse, horizontal lines represent the group means, and shaded areas represent the distributions of the data. Data points from control mice in black, and data points from Atoh1Cre/+;Vglut2fl/fl mice in reddish purple. A linear mixed model analysis with genotype as a fixed variable and mouse number as a random variable was used to test for statistical significance in (be). A post hoc analysis was performed to test for the statistical differences at each time point. Source data and detailed statistical results are available and provided as a Source Data file. Panels (b, d) were adapted from Van der Heijden et al., 2022, “Quantification of Behavioral Deficits in Developing Mice With Dystonic Behaviors,” Dystonia under CC BY 4.0.
Fig. 4
Fig. 4. Intersectional lineage labeling of Atoh1, Vglut2 neurons.
tdTomato+ neuron labeling in Atoh1FlpO/+;Vglut2IRES-Cre/+;Rosa26fsf-lsl-tdTomato mice. Cell bodies are shown in dark orange, projections are shown in light orange. Abbreviations: CoN cochlear nucleus, dscp decussation of dorsal superior cerebellar peduncle, DLL dorsal lateral lemniscus, DN dentate nucleus, eCN external cuneate nucleus, FN fastigial nucleus, GCL granule cell layer, H Hippocampus, IC inferior colliculus, icp inferior cerebellar peduncle, IN interposed nucleus, IO inferior olive, iRt intermediate reticular nucleus, ITR intertrigeminal region, KF Kölliker Fuse, LDT lateral dorsal tegmental nucleus, lRt lateral reticular nucleus, mcp medial cerebellar peduncle, mRt midbrain reticular nucleus, nCC non-Clark’s column, PB parabrachial nucleus, PBG parabigeminal nucleus, PN pontine nuclei, pRt pontine reticular nucleus, PSV principal sensory nucleus of the trigeminal, RN red nucleus, RTN retrotrapezoid nucleus, sct spinocerebellar tract, SPFp subparafascicular nucleus, parvicellular part, vlPAG ventral lateral periaqueductal gray, VPM ventral posteromedial nucleus of the thalamus, VPL ventral posterolateral nucleus of the thalamus, vst ventral spinothalamic tract, VTA ventral tegmental area, ZI zona incerta. Brain images in (ak) are shown at the same magnification. The spinal cord image in (l) is shown at a different magnification. The light orange brain regions mean that only tdTomato+ projections were observed, and the vermillion brain regions mean the cell bodies (and the projections) were observed. Images are representative of N = 3 mice.
Fig. 5
Fig. 5. Vglut1 expression in control and Atoh1Cre/+;Vglut2fl/fl mice.
a Schematic showing how conditional deletion of VgluT2 does not affect fast neurotransmission in VgluT1-expressing neurons. b Schematic of cerebellar connectivity and vesicular transporter expression for the glutamate subtypes (VgluT1 and VgluT2) in the cerebellar circuit in P7 control mice and Atoh1Cre/+;Vglut2fl/fl conditional knockout mice. c Same as b. but in adult mice. For ac VGluT1 (blue); VGluT2 (orange); Control mice (black); Atoh1Cre/+;Vglut2fl/fl mice (reddish purple). d Expression of Vglut1 (green) with DAPI (purple, left) or tdTomato (purple, right) in the cerebellar nuclei (CN) and granule cell layer (gcl) of adult Atoh1Cre/+;Rosa26lsl-tdTomato mice. e Expression of Vglut1 (green) and DAPI (purple) in the CN and gcl of adult control mice and Atoh1Cre/+;Vglut2fl/fl mice. d, e Insets are 125 by 125 µm high magnification images. f VgluT1+ synapses (green) and DAPI (purple) in the molecular layer (ml) and gcl of P7 control and Atoh1Cre/+;Vglut2fl/fl mice, e-gcl = external granule cell layer containing actively proliferating granule cell precursor cells. g VgluT1+ synapses (green) and DAPI (purple) in the ml and gcl of adult control mice and Atoh1Cre/+;Vglut2fl/fl mice. d, e are shown at the same scale. f, g are shown at the same scale. Images are representative of N = 3 mice.
Fig. 6
Fig. 6. Purkinje cell firing activity in adult mice.
a Schematic of the in vivo single-unit extracellular Purkinje cell recording setup in anesthetized mice. b Representative trace of a Purkinje cell recording in a control mouse (black and blue lines represent complex spikes). c Representative trace of a Purkinje cell recording in an Atoh1Cre/+;Vglut2fl/fl mouse (reddish purple, blue lines represent complex spikes). In b, c, Inferior olive (IO) evoked a complex spike (CS) in blue. The y-axis is constant across the panel. The x-axes (timescales) are the same for (b, c). d No differences were found in the SS Firing rate (p = 0.490; d = 0.40), e SS CV (spike pattern, p = 0.766; d = 0.07), f SS CV2 (spike regularity, p = 0.659; d = 0.11), g CS Firing rate (p = 0.489, d = 0.49), h CS CV (spike pattern, p = 0.598, d = 0.19), or i CS CV2 (spike regularity, p = 0.246, d = 0.48). For di, large open circles represent the mouse average, and small, closed circles represent the cell average. Data points from control mice in black, and data points from Atoh1Cre/+;Vglut2fl/fl mice in reddish purple. A linear mixed model analysis with genotype as a fixed variable and mouse number as a random variable was used to test for statistical significance in (di). Control: N = 5 mice, n = 18 cells; Atoh1Cre/+;Vglut2fl/fl: N = 5, n = 23. Source data and detailed statistical results are available and provided as a Source Data file. Panel (a) was adapted from White & Sillitoe, 2017, “Genetic silencing of olivocerebellar synapses causes dystonia-like behavior in mice,” Nature Communications under CC BY 4.0.
Fig. 7
Fig. 7. Motor behavior and social behavior in adult Atoh1Cre/+;Vglut2fl/fl conditional knockout mice.
ac A tremor in freely moving mice. Control: N = 10 (5 female/5 male); Atoh1Cre/+;Vglut2fl/fl: N = 13 (6 f/7 m). a Power spectrum of tremor in control and Atoh1Cre/+;Vglut2fl/fl conditional knockout mice. b Mean tremor power between 0 and 30 Hz was lower in Atoh1Cre/+;Vglut2fl/fl mice compared to control mice (p = 0.039; d = 0.90). c Maximum tremor power was not different between Atoh1Cre/+;Vglut2fl/fl conditional knockouts and control mice (p = 0.276; d = 0.63). dg Ambulatory activity in the open field assay. Control: N = 11 (6 f/5 m); Atoh1Cre/+;Vglut2fl/fl: N = 13 (6 f/7 m). Atoh1Cre/+;Vglut2fl/fl mice had lower (in d) total movement time (p = 0.03; d = 0.86), f horizontal activity count (p = 0.008; d = 1.03), and g vertical activity count (p = 0.004; d = 1.11) compared to control mice, but no difference in (e) total distance traveled (p = 0.116; d = 0.65). h Rotarod performance. Control: N = 10 (6 f/4 m); Atoh1Cre/+;Vglut2fl/fl: N = 13 (6 f/7 m). Atoh1Cre/+;Vglut2fl/fl mice fell off the rotarod faster than control mice (p = 0.017), but the group difference was only significant on the first day (p = 0.016; d = 0.83) and third training day (p = 0.025; d = 0.73), but not the second training day (p = 0.062; d = 0.58). i Three-chamber socialization assay. Control: N = 11 (6 f/5 m); Atoh1Cre/+;Vglut2fl/fl: N = 13 (6 f/7 m). There was no difference between Atoh1Cre/+;Vglut2fl/fl mice and control mice in the total time spent with a mouse (p = 0.404; d = 0.08) or an object (p = 0.948; d = 0.13), and both groups spent more time with the mouse than the object (control: p < 0.001; Atoh1Cre/+;Vglut2fl/fl: p < 0.001 in a two-sided paired t-test). A two-sided unpaired t-test was used to test for statistical significance unless otherwise noted. Black circles and squares represent data points from control mice; reddish purple circles and squares represent data points from Atoh1Cre/+;Vglut2fl/fl mice. Squares represent data points from male mice, circles represent data points from female mice. Source data and detailed statistical results are available and provided as a Source Data file.
Fig. 8
Fig. 8. Ntsr1Cre marks a subset of glutamatergic cerebellar nuclei neurons.
a Expression of Ntrs1Cre mapped through Cre-dependent YFP expression and Vglut2 in sagittal brain slices. Insets show high magnification of YFP and Vglut2 expression in (i) the cerebral cortex, (ii) the thalamus, (iii) cerebellar nuclei, (iv) the striatum, (v) the midbrain, and (vi) the medulla. We only observe co-expression of YFP (green, right panels) and Vglut2 (purple, right panels) in the same neurons in the cerebellar nuclei. b Expression of Ntrs1Cre mapped through Cre-dependent YFP expression (green) in glutamatergic (Vglut2 expressing, purple) cerebellar nuclei neurons (coronal sections). The green arrowhead indicates a YFP, but not Vglut2, expressing neuron; the white arrowhead indicates a YFP and Vglut2 expressing neuron; and the purple arrowhead indicates a Vglut2, but not YFP, expressing neuron. c Quantification of Vglut2+ (purple), YFP+ (green), and Vglut2+ & YFP+ double-positive neurons (white) in the DN, IN, and FN. N = 3 mice, n = 6 nuclei (3 brain sections) per mouse. Source data are provided as a Source Data file. DN dentate nucleus, IN interposed nucleus, FN fastigial nucleus. Images are representative of N = 3 mice.
Fig. 9
Fig. 9. Motor behavior and social behavior in early postnatal Ntsr1Cre;Vglut2fl/fl mice.
a Schematic of circuit modifications in Ntsr1Cre/+;Vglut2fl/fl conditional knockout mice. VGluT1 (blue); VGluT2 (orange); Control mice (black); Ntsr1Cre/+;Vglut2fl/fl mice (sky blue). b Time to turn upward on a negative slope was measured. Ntsr1Cre/+;Vglut2fl/fl mice required a longer time to turn compared to control littermates at P7 (p < 0.001; d = 1.34), P9 (p < 0.001; d = 1.43), and P11 (p < 0.001; d = 1.91). c Time to right onto four paws was measured. Ntsr1Cre/+;Vglut2fl/fl mice required a longer time to turn compared to control littermates at P7 (p < 0.001; d = 2.13), P9 (p < 0.001; d = 3.63), and P11 (p < 0.001; d = 3.53). d Number of vocalizations after separation from the nest was measured. Ntsr1Cre/+;Vglut2fl/fl conditional knockout pups made a similar number of vocalizations as control littermates at P7 (p < 0.205; d = 0.38), and P9 (p = 0.553; d = 0.18), but made more calls at P11 (p = 0.003; d = 0.87). e Duration of vocalizations after separation from the nest was measured. Ntsr1Cre/+;Vglut2fl/fl conditional knockouts made calls of the same duration as compared to control littermates at P7 (p = 0.161; d = 0.42), P9 (p = 0.576; d = 0.17), and P11 (p = 0.240; d = 0.35). For b and c, Control: N = 54 (22 f/32 m); Ntsr1Cre/+;Vglut2fl/fl: N = 25 (10 f/15 m). For d, e, Control: N = 30 (11 f/19 m); Ntsr1Cre/+;Vglut2fl/fl: N = 18 (7 f/11 m). Dots represent means for each mouse, horizontal lines represent group means, and shaded areas represent the distribution of the data. Data points from control mice in black, and data points from Ntsr1Cre/+;Vglut2fl/fl mice in sky blue. A linear mixed model analysis with genotype as a fixed variable and mouse number as a random variable was used to test for statistical significance in (ce). A post hoc analysis was performed to test for the statistical differences at each time point. Source data and detailed statistical results are available and provided as a Source Data file. Panels (b, d) were adapted from Van der Heijden et al., 2022, “Quantification of Behavioral Deficits in Developing Mice With Dystonic Behaviors,” Dystonia under CC BY 4.0.
Fig. 10
Fig. 10. Motor behavior and social behavior in adult Ntsr1Cre/+;Vglut2fl/fl conditional knockout mice.
ad Ambulatory activity in the open field assay. Control: N = 11 (7 f/4 m); Ntsr1Cre/+;Vglut2fl/fl: N = 11 (7 f/4 m). Ntsr1Cre/+;Vglut2fl/fl mice were not different from control mice in a total movement time (p = 0.135; d = 0.64), b total distance traveled (p = 0.106; d = 0.69), c horizontal activity count (p = 0.931; d = 0.04), or d vertical activity count (p = 0.410; d = 0.41) compared to control mice. e Rotarod performance. Control: N = 11 (7 f/3 m); Ntsr1Cre/+;Vglut2fl/fl: N = 11 (7 f/4 m). There was no difference in latency to fall between Ntsr1Cre/+;Vglut2fl/fl mice and control mice (p = 0.786). f. 3-chamber socialization assay. Control: N = 11 (7 f/4 m); Ntsr1Cre/+;Vglut2fl/fl: N = 11 (7 f/4 m). Ntsr1Cre/+;Vglut2fl/fl mice spend less time interacting with both the mouse (p = 0.014; d = 1.01) and the object (p = 0.004; d = 1.15) than control mice, but both groups spent more time with the mouse than the object (control: p < 0.001; Ntsr1Cre/+;Vglut2fl/fl: p < 0.001 in the paired t-test). A two-sided unpaired t-test was used to test for statistical significance unless otherwise noted. g Summary of results. Black circles and squares represent data points from control mice; sky blue circles and squares represent data points from Ntsr1Cre/+;Vglut2fl/fl mice. Squares represent data points from male mice, circles represent data points from female mice. Source data and detailed statistical results are available and provided as a Source Data file.

References

    1. Limperopoulos C, et al. Does cerebellar injury in premature infants contribute to the high prevalence of long-term cognitive, learning, and behavioral disability in survivors? Pediatrics. 2007;120:584–593. doi: 10.1542/peds.2007-1041. - DOI - PubMed
    1. Stoodley CJ, Limperopoulos C. Structure-function relationships in the developing cerebellum: Evidence from early-life cerebellar injury and neurodevelopmental disorders. Semin. Fetal Neonatal Med. 2016;21:356–364. doi: 10.1016/j.siny.2016.04.010. - DOI - PMC - PubMed
    1. Stoodley CJ. Distinct regions of the cerebellum show gray matter decreases in autism, ADHD, and developmental dyslexia. Front. Syst. Neurosci. 2014;8:92. doi: 10.3389/fnsys.2014.00092. - DOI - PMC - PubMed
    1. Volpe JJ. Cerebellum of the premature infant: rapidly developing, vulnerable, clinically important. J. Child Neurol. 2009;24:1085–1104. doi: 10.1177/0883073809338067. - DOI - PMC - PubMed
    1. Volpe JJ. Commentary—Cerebellar underdevelopment in the very preterm infant: Important and underestimated source of cognitive deficits. J. Neonatal. Perinatal. Med. 2021;14:451–456. doi: 10.3233/NPM-210774. - DOI - PMC - PubMed

Publication types

LinkOut - more resources