. 2023 Jun;25(6):904-916.
doi: 10.1038/s41556-023-01150-8. Epub 2023 May 15.

Single-nucleus multi-omics of human stem cell-derived islets identifies deficiencies in lineage specification

Affiliations

Single-nucleus multi-omics of human stem cell-derived islets identifies deficiencies in lineage specification

Punn Augsornworawat et al. Nat Cell Biol. 2023 Jun.

Erratum in

Abstract

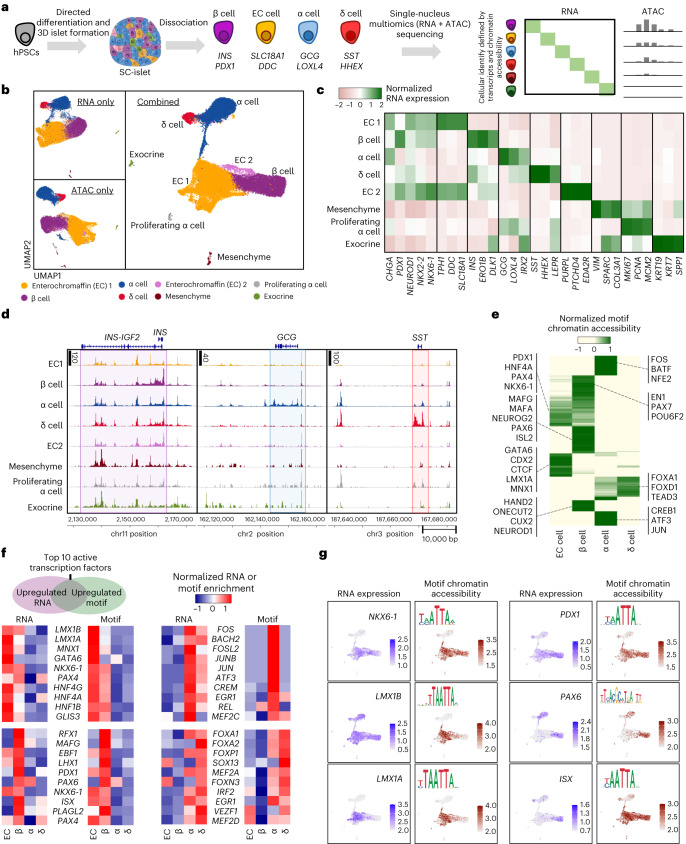
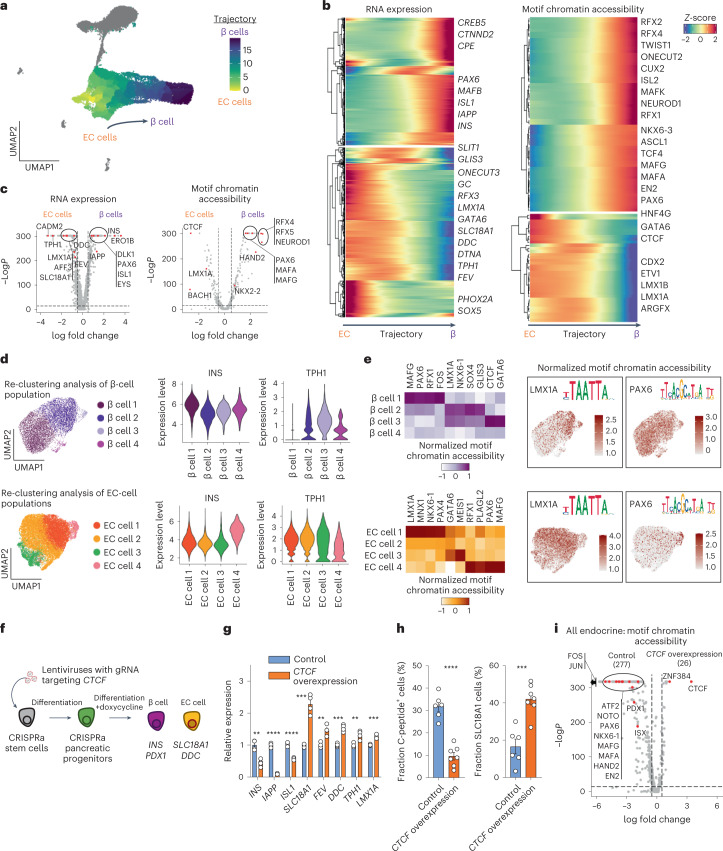
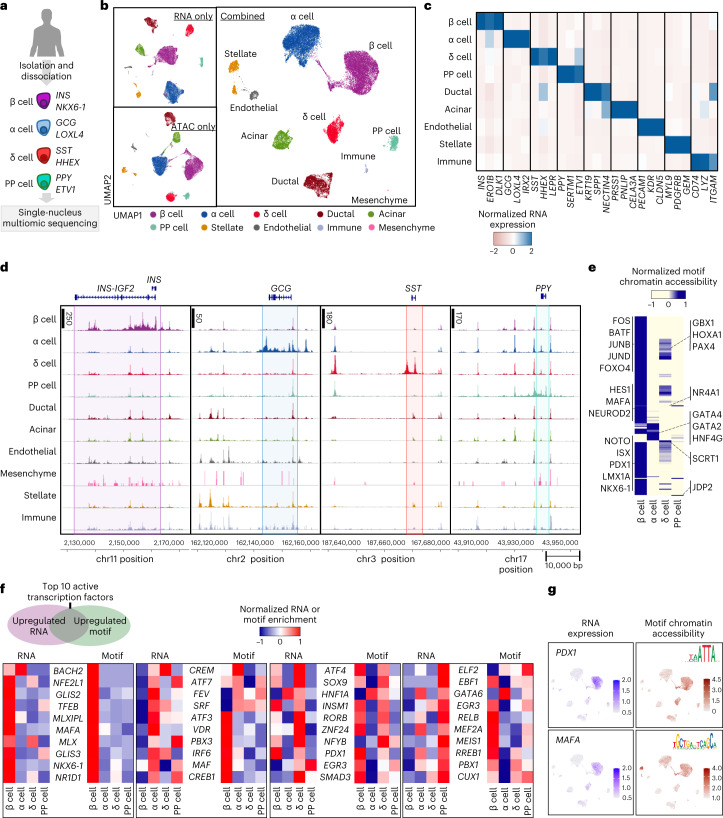
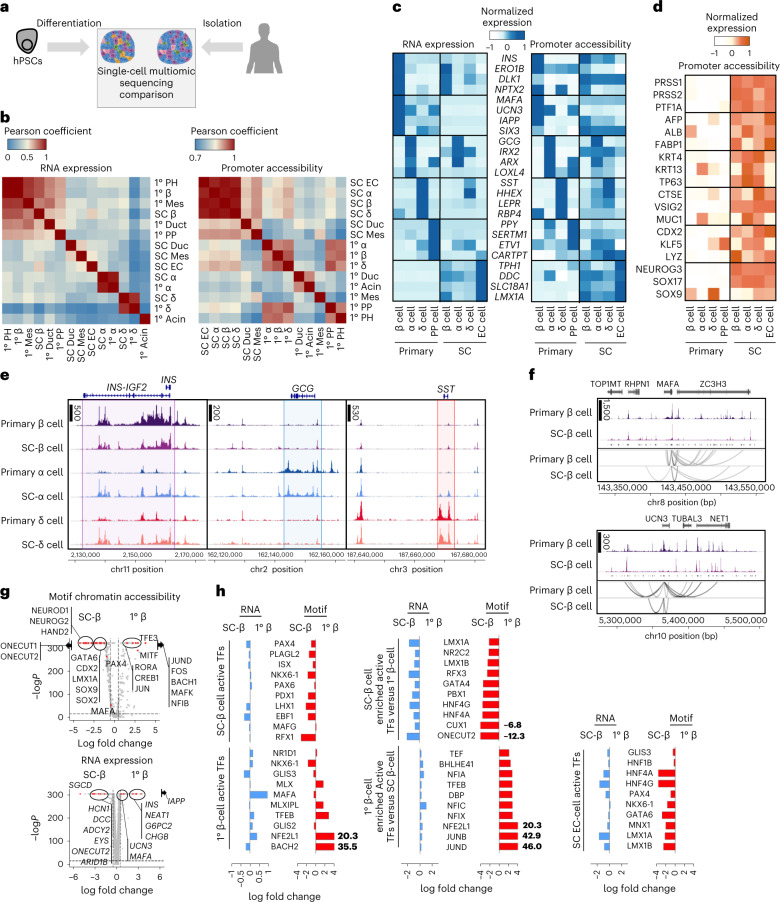
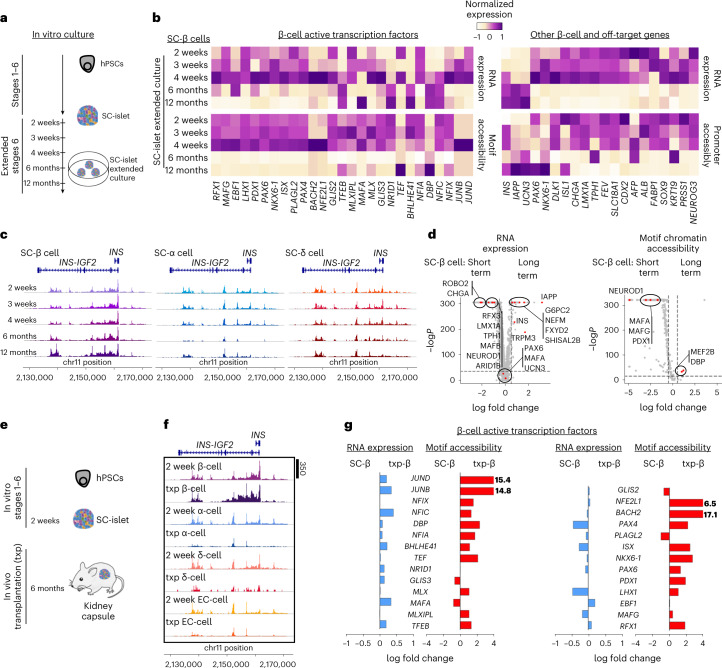
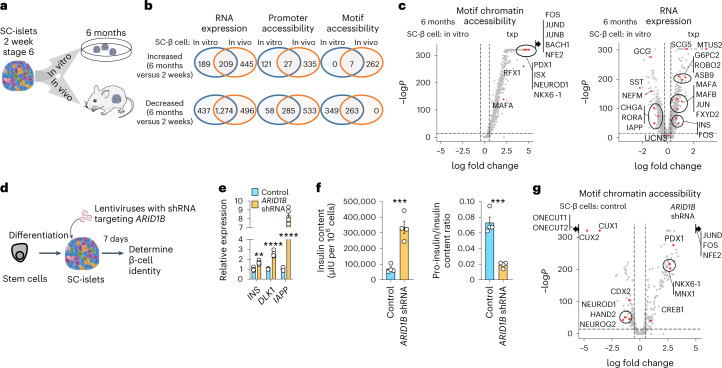
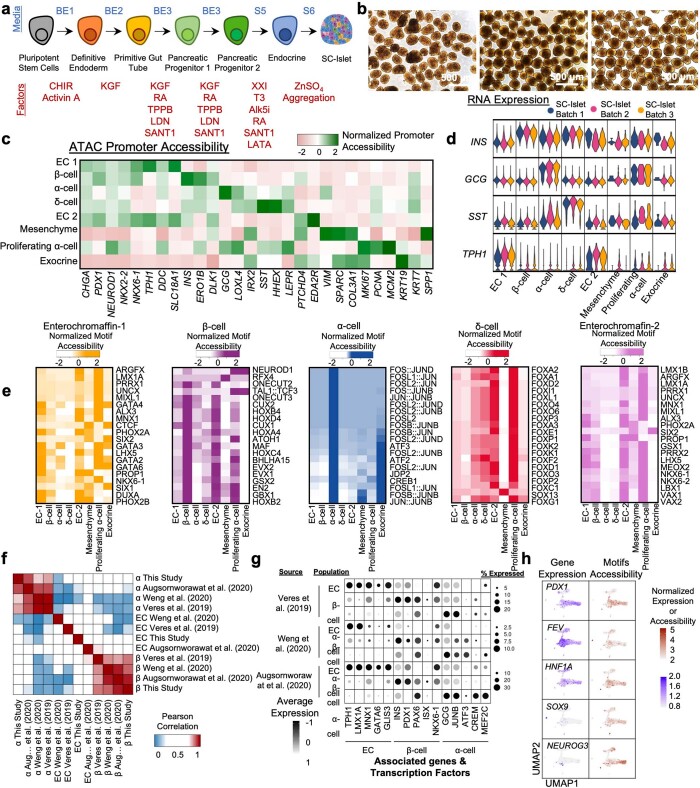
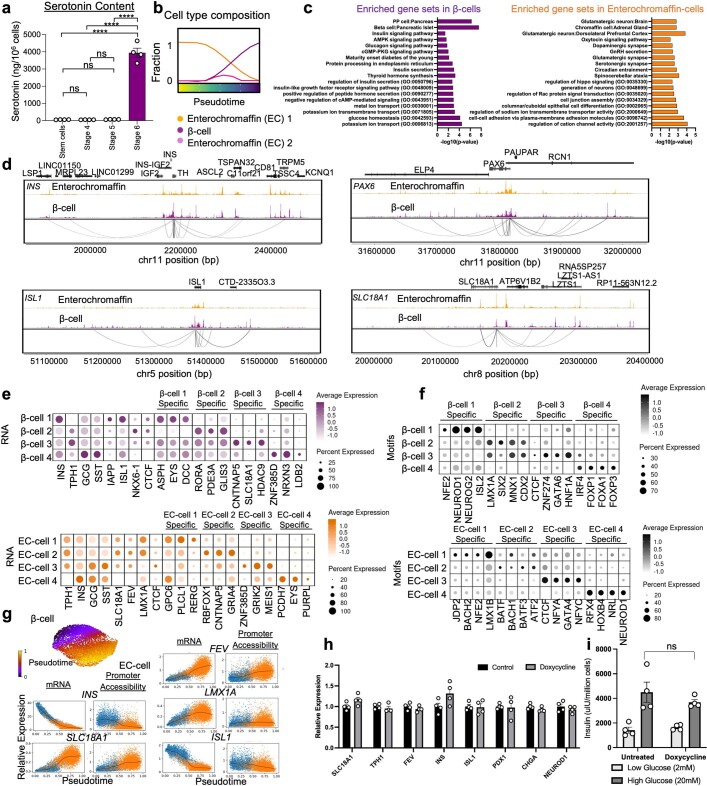
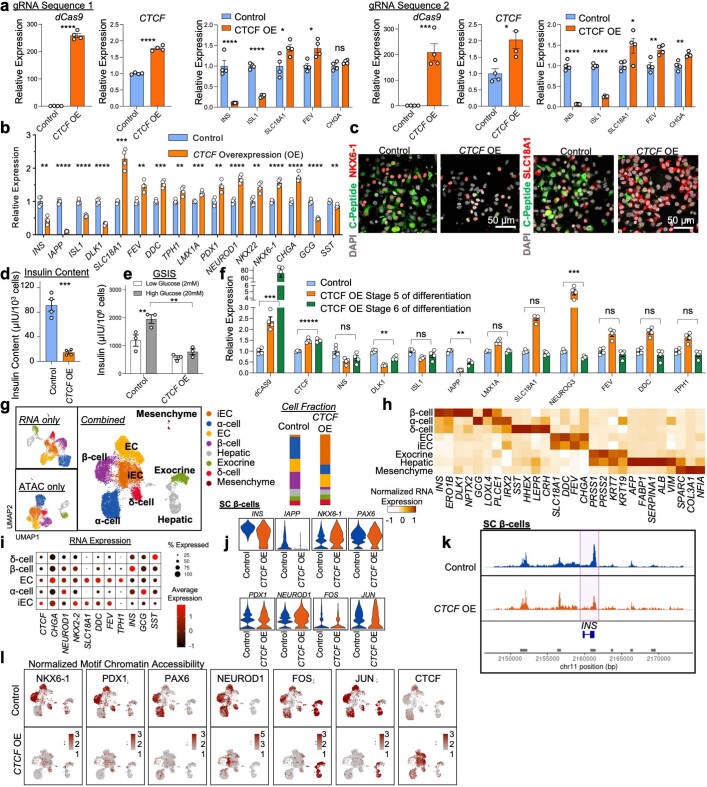
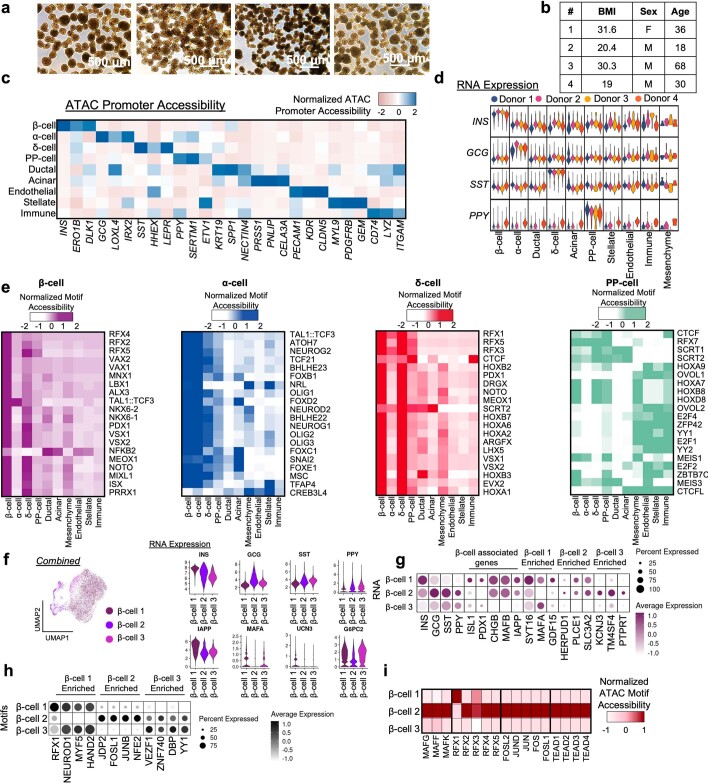
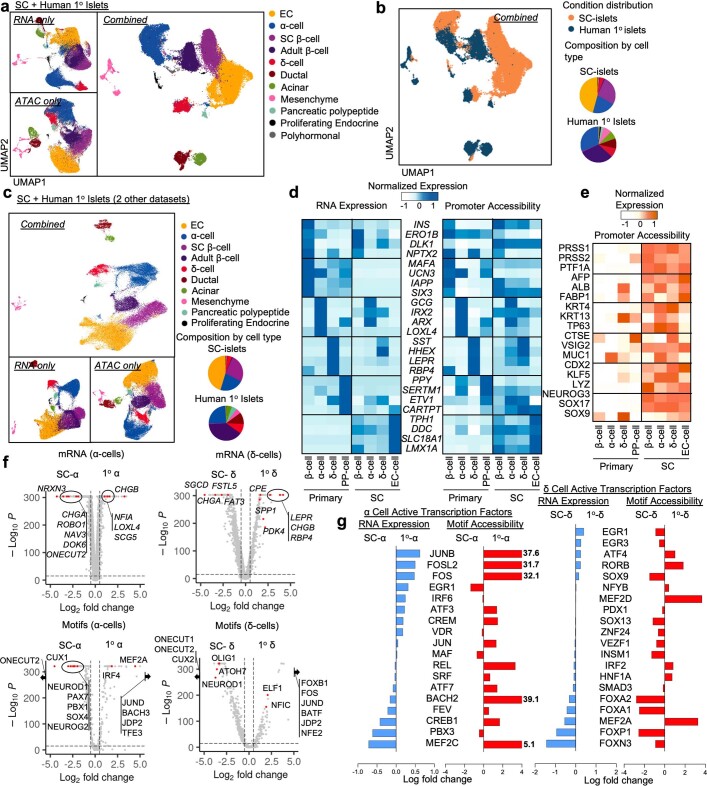
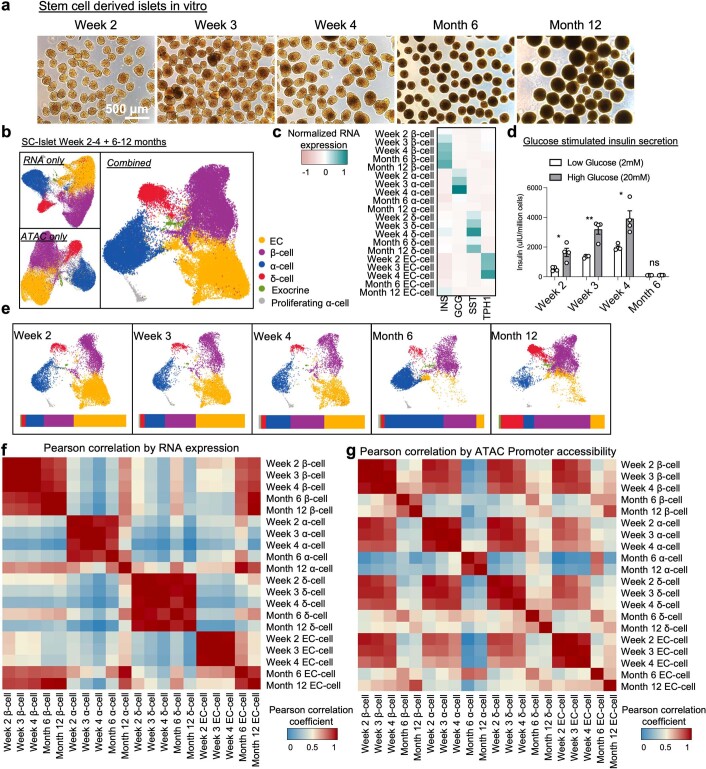
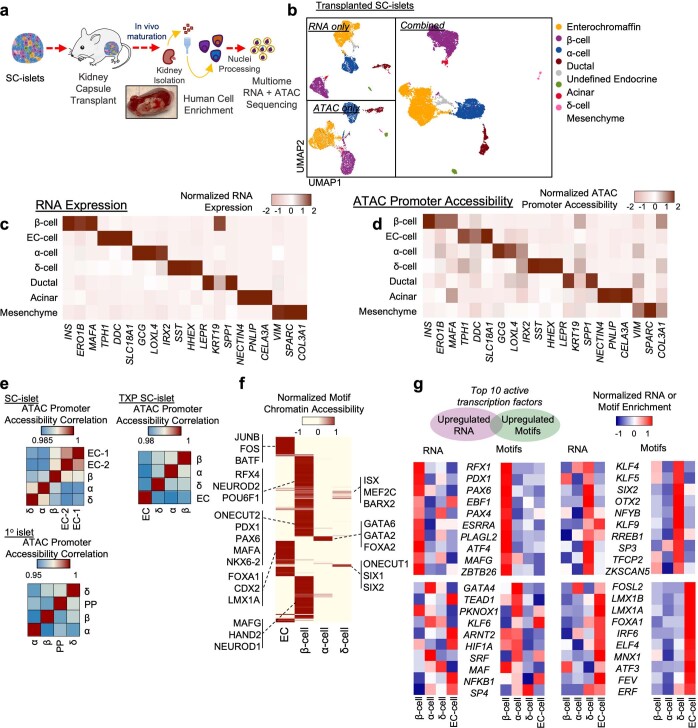
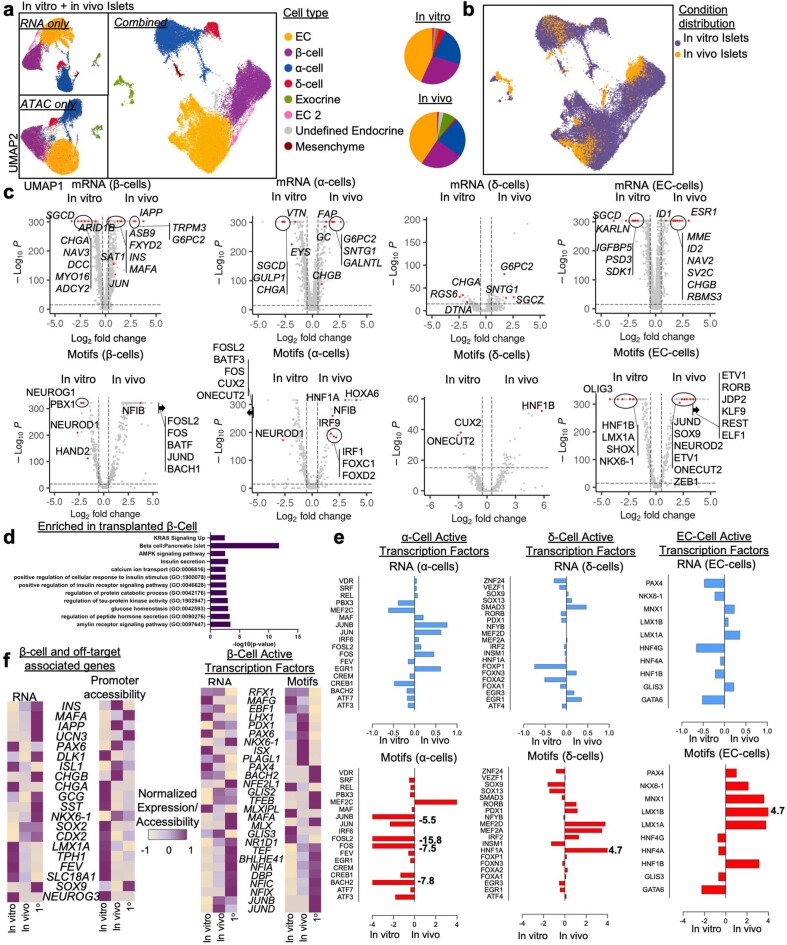
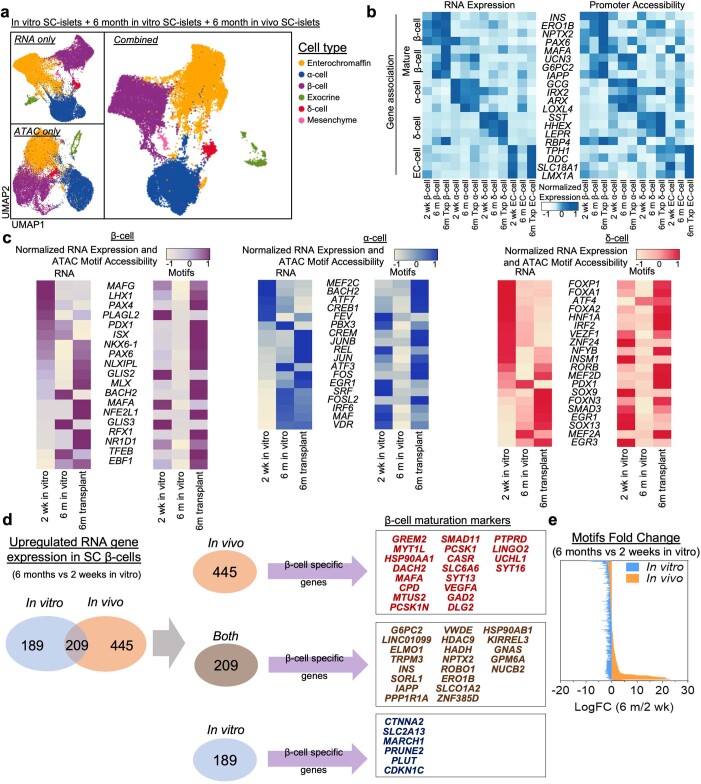
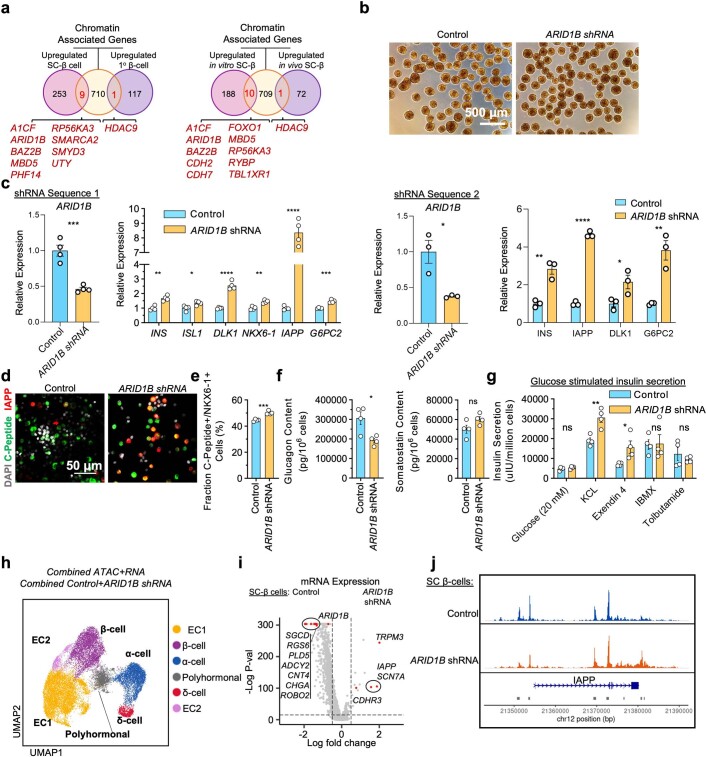
Insulin-producing β cells created from human pluripotent stem cells have potential as a therapy for insulin-dependent diabetes, but human pluripotent stem cell-derived islets (SC-islets) still differ from their in vivo counterparts. To better understand the state of cell types within SC-islets and identify lineage specification deficiencies, we used single-nucleus multi-omic sequencing to analyse chromatin accessibility and transcriptional profiles of SC-islets and primary human islets. Here we provide an analysis that enabled the derivation of gene lists and activity for identifying each SC-islet cell type compared with primary islets. Within SC-islets, we found that the difference between β cells and awry enterochromaffin-like cells is a gradient of cell states rather than a stark difference in identity. Furthermore, transplantation of SC-islets in vivo improved cellular identities overtime, while long-term in vitro culture did not. Collectively, our results highlight the importance of chromatin and transcriptional landscapes during islet cell specification and maturation.


Conflict of interest statement

P.A., N.J.H., L.V.-C. and J. R. Millman are inventors on related patents and patent applications. J. R. Millman is/has served as a consultant/employee for Sana Biotechnology. L.V.-C. is currently employed by Sana Biotechnology. J. R. Millman and L.V.-C. have stock or stock options in Sana Biotechnology. The remaining authors declare no competing interests.

Figures

Fig. 1
Fig. 1. Multi-omic profiling of SC-islets shows unique chromatin accessibility signatures in endocrine cell types.
a, Schematic of SC-islet differentiation and multi-omic sequencing. b, UMAPs showing identified cell types in SC-islets 2 weeks into stage 6 using both and either chromatin accessibility (ATAC) or gene (mRNA) information (29,526 cells from 3 independent differentiations; integration of all samples). c, Heat map showing gene expression of markers associated with each cell type. d, ATAC plots showing chromatin accessibility of SC-islet cell types around the INS, GCG and SST genomic regions. e, Heat map showing the top 200 variable DNA-binding motif accessibility within endocrine cell populations and highlighting markers for each cell type. f, Heat maps highlighting gene expression and ATAC motif accessibility of top ten active transcription factors co-enriched with both features in SC-β, SC-α, SC-δ and SC-EC cells. g, UMAP showing gene expression and motif accessibility of selected transcription factors associated with SC-β cells or SC-EC cells. SC, stem cell derived; EC, enterochromaffin. Source data
Fig. 2
Fig. 2. SC-EC and SC-β cells have unique and common transcriptional and chromatin accessibility signatures.
a, UMAP showing the trajectory of cells from the SC-β, SC-EC1 and SC-EC2 populations (subset of 21,317 cells from 3 independent differentiations; integration of all samples). b, Trajectory heat map showing dynamic changes of gene expression and motif accessibility enriched in β and EC groups. c, Volcano plots showing differential gene expression analysis (left) and differential motif accessibility analysis (right), highlighting relevant genes associated with SC-β and SC-EC cell populations. Statistical significance assessed by two-sided Wilcoxon rank sum test for RNA expression and two-sided logistic regression for motif chromatin accessibility. d, UMAP showing subpopulations by reclustering SC-β or SC-EC cell populations. Violin plots show gene marker expressions of INS and TPH1, highlighting off-target genes. e, Heat map showing DNA-binding motif accessibility associated with SC-β and SC-EC cells in subpopulations. Selected transcription factors plotted to show distribution of cells with target or off-target motif accessibility. f, Schematic of CRISPRa experiment for overexpression of CTCF in differentiating pancreatic progenitor cells. g, qPCR analysis of differentiated SC-islets with CTCF overexpression during endocrine induction, plotting mean ± s.e.m. (n = 4 biologically independent samples), showing expression differences in doxycycline treated compared with untreated control (INS, P = 0.0010; IAPP, P = 1.5 × 10−7; ISL1, P = 3.0 × 10−5) and EC cells (SLC18A1, P = 1.6 × 10−4; FEV, P = 0.0019; DDC, P = 1.2 × 10−4; TPH1, P = 0.0047; LMX1A, P = 4.6 × 10−4). Control represents cells without doxycycline treatment. Statistical significance was assessed by unpaired two-sided t-test. h, ICC quantification of cells expressing C-peptide protein (P = 5.3 × 10−6) and SLC18A1 protein (P = 3.1 × 10−4) with or without CTCF overexpression, plotting mean ± s.e.m. (control; n = 6 biologically independent samples, doxycycline; n = 7 biologically independent samples). Control represents cells without doxycycline treatment. Statistical significance was assessed by unpaired two-sided t-test. i, Volcano plots showing differential motif chromatin accessibility analysis of SC-endocrine population comparing control and CTCF overexpression (12,467 cells from 2 independent biological samples, 1 of each condition from the same differentiation batch; integration of all samples). Statistical significance was assessed by logistic regression. Control represents cells without doxycycline treatment. SC, stem cell derived; EC, enterochromaffin cells; CRISPRa, CRISPR activation. Source data
Fig. 3
Fig. 3. Multi-omic profiling of human adult primary islets shows unique chromatin accessibility signatures in endocrine cell types.
a, Schematic of human adult primary islets for mutiomic sequencing. b, UMAPs showing identified cell types in primary human islets using both and either chromatin accessibility (ATAC) or gene (mRNA) information (30,202 cells from 4 independent biological donors; integration of all samples). c, Heat map showing gene expression of markers associated with each cell type. d, ATAC plots showing chromatin accessibility primary islet cell types around the INS, GCG, SST and PPY genomic regions. e, Heat map showing the top 200 variable DNA-binding motif accessibility within endocrine cell populations and highlighting motif markers for each cell type. f, Heat maps highlighting gene expression and ATAC motif accessibility of top ten active transcription factors co-enriched with both features in primary β, α, δ and PP cells. g, UMAP showing gene expression and motif accessibility of selected transcription factors associated with primary β cells. PP, pancreatic polypeptide. Source data
Fig. 4
Fig. 4. Comparative analysis of SC-islets and primary human islets shows differences in chromatin accessibility signatures associated with islet identity.
a, Schematic showing comparisons of SC-islet and primary human islets (47,566 cells from 5 independent biological samples; all 3 SC-islets, 2 representative primary islets). b, Pearson correlation analysis comparing cell types in SC-islets and primary islets using gene expression and ATAC promoter accessibility. C, Heat map highlighting and comparing identity (β, adult β, α, δ, PP and EC) associated gene expression and ATAC promoter accessibility of endocrine cells in SC-islets and primary islets. d, Heat map highlighting and comparing off-target identity (exocrine, hepatic, oesophagus, stomach, intestinal and pancreatic progenitor) associated gene expression and ATAC promoter accessibility in SC-islet cells and primary islet cells. e, ATAC plots comparing chromatin accessibility around the INS, GCG and SST genomic regions in β, α and δ cells from SC-islets and primary islets. f, ATAC peaks from SC-β cells and 1° β cells showing chromatin accessibility around β-cell identity marker, MAFA (top) and UCN3 (bottom). Peaks were linked and analysed to depict differences in the number of cis-regulatory elements. g, Volcano plots showing differential motif accessibility analysis (top) and differential gene expression analysis (bottom) comparing SC-β cells and primary β cells. Statistical significance was assessed by two-sided Wilcoxon rank sum test for RNA expression and two-sided logistic regression for motif chromatin accessibility. h, Bar graphs showing fold change differences between SC-β cells and primary β cells, showing gene expression and motif accessibility of identified transcription factors (TFs) associated with SC-β cells, primary β cells and SC-EC cells. SC, stem cell derived; EC, enterochromaffin cells; PH, polyhormonal cells; Mes, mesenchyme; Duc, ductal; PP, pancreatic polypeptide cells; Acin, acinar cells. Source data
Fig. 5
Fig. 5. Interrogating SC-islet identity with time in vitro and after transplantation.
a, Schematic of SC-islet in vitro culture with extended time course. b, Heat map showing gene expression, motif chromatin accessibility, or ATAC promoter accessibility of gene markers and transcription factors of SC-β cells cultured in vitro with extended time (2, 3 and 4 weeks and 6 and 12 months; 40,332 cells from 5 independent biological samples, 1 from each timepoint). c, Graphs comparing time course of chromatin accessibility around the INS genomic region in SC-β, α and δ cells. Peak signals around the INS gene in SC-β cell increases over time, but decreases in SC-α and δ cells. d, Volcano plots showing differential gene expression analysis (left) and differential motif accessibility analysis (right) comparing SC-β cells cultured short term (weeks 2, 3 and 4) and SC-β cells cultured long term (months 6 and 12). Statistical significance was assessed by two-sided Wilcoxon rank sum test for RNA expression and two-sided logistic regression for motif chromatin accessibility. e, Schematic of differentiated SC-islets maintained long-term by in vivo transplantation. f, ATAC chromatin accessibility around the INS genomic region showing increase of peak signals in SC-β cells after transplantation and decrease in SC-α and δ cells (36,688 cells from 6 independent biological samples; 3 in vitro SC-islets, 3 in vivo SC-islets; integration of all samples). g, Bar graphs showing fold change differences of β-cell-associated active transcription factors in SC-β cells and transplanted SC-β cells. SC, stem cell derived; Txp, transplant; EC, enterochromaffin cells. Source data
Fig. 6
Fig. 6. Comparative analysis of 6 months in vitro and in vivo SC-β cells and improving in vitro maturation by ARID1B gene knockdown.
a, Schematic showing comparison of changes associated with 6 month in vitro culture and 6 month in vivo transplants. b, Number of genes, by gene expression or ATAC promoter accessibility, or motif chromatin accessibility, downregulated or upregulated in 6 months in vitro and in vivo SC-β cells. Number of features were determined by differential gene, promoter accessibility or motif accessibility analysis comparing 2 week SC-β cells with 6 month SC-β cells in vitro or 6 month SC-β cells in vivo (24,491 cells from 5 independent biological samples; week 2 representative SC-islets, month 6 SC-islets, and 3 samples of month 6 in vivo SC-islets). c, Volcano plots showing differential motif accessibility analysis (left) and differential gene expression analysis (right) comparing 6 months SC-β cells from in vitro and in vivo SC-islets. Statistical significance was assessed by two-sided Wilcoxon rank sum test for RNA expression and two-sided logistic regression for motif chromatin accessibility. d, Schematic of SC-islets transfected with shRNA lentivirus for ARID1B gene knockdown. e, qPCR plots of SC-islets with ARID1B shRNA showing mean ± s.e.m. (n = 4 biologically independent samples) of expression of β-cell-associated genes, INS (P = 0.0014), DLK1 (P = 4.3 × 10−5) and IAPP (P = 3.0 × 10−6). Statistical significance was assessed by unpaired two-sided t-test. f, Protein quantification plot showing mean ± s.e.m. (n = 4 biologically independent samples) of human insulin content (P = 7.6 × 10−4) by ELISA (left), and pro-insulin/insulin ratio (P = 3.6 × 10−4) by ELISA (right). Statistical significance was assessed by unpaired two-sided t-test. g, Volcano plot from single-nucleus multi-omics comparing motif chromatin accessibility of SC-β cells from control and ARID1B shRNA condition (21,969 cells from 2 independent biological samples, 1 of each condition from the same differentiation batch; integration of all samples). Statistical significance was assessed by two-sided logistic regression. SC, stem cell derived; Txp, transplant; EC, enterochromaffin cells. Source data
Extended Data Fig. 1
Extended Data Fig. 1. Single-cell Multiomic ATAC and gene expression characterization of SC-islets.
a, Schematic diagram outlining the differentiation protocol for generating SC-islets. b, Brightfield images of differentiated SC-islets from the three batches used for multiomic sequencing. Individual image representative of 1 sample. c, Heatmap showing ATAC promoter accessibility of markers associated with each cell type (29526 cells from 3 independent differentiations; integration of all samples). d, Violin plots for INS, GCG, SST, and TPH1 gene expression in SC-islet cell types from different datasets of different differentiation batches. e, Heatmaps showing the top 20 enriched motifs in SC-EC1, SC-β, SC-α, SC-δ, and SC-EC2 cells. f, Pearson correlation analysis using the top 2000 variable genes comparing correlation of SC-β, SC-α, and SC-EC in SC-islets from this study and other literatures using other differentiation protocols. SC-β, and SC-α have similar gene expression profiles across multiple datasets. g, Dot plots showing the upregulation, by gene expression, of identified active transcription factors in SC-β, SC-α, and SC-EC cells of datasets from other studies. h, Feature plot showing gene expression of progenitor transcription factors and chromatin accessibility of their binding motifs. EC, enterochromaffin cells. Source data
Extended Data Fig. 2
Extended Data Fig. 2. Comparing SC-β and SC-EC cells.
a, Protein quantification plot showing mean ± s.e.m. (by ELISA, n = 4 biologically independent samples) of serotonin content in stem cells and stages 4–6 of differentiation (Stem cells vs Stage 4, P = 1.00, Stem cells vs Stage 5, P = 1.00, Stem Cells vs Stage 6, P = 6.17 × 10−10, Stage 4 vs Stage 5, P = 1.00, Stage 4 vs Stage 6, P = 6.06 × 10−10, Stage 5 vs Stage 6, P = 6.42 × 10−10). Statistical significances were assessed by one-way ANOVA with Tukey’s multiple comparison testing, reporting adjusted P-value. b, Composition of cell types represented on the trajectory analysis. c, Gene set enrichment of analysis showing enrichment of gene sets in segments of trajectory representing SC-β and SC-EC cells. Non-adjusted p-values were computed using two-sided Fisher exact test. d, ATAC peaks show chromatin accessibility pattern differences and highlight cis-regulatory elements around the INS, ISL1, PAX6, and SLC18A1 gene regions. e, Dot plots showing marker genes and unique genes associated with subpopulations identified from the reclustering of SC-β and SC-EC cell populations. f, Dot plots showing unique motif chromatin accessibility in subpopulations of SC-β and SC-EC cells. g. Trajectory analysis of the EC cell and β cell population using ‘MultiVelo’ package showing gene expression and promoter accessibility along. The trajectory analysis validates expression features of EC cell and β cell genes identified in the previous analysis with ‘Monocle’ package (Subset of 21317 cells from 3 independent differentiations; integration of all samples). h, qPCR analysis, plotting mean ± s.e.m. (n = 4 biologically independent samples), of non-transduced control cells comparing doxycycline effects on the expression of EC cell and β cell associated genes. All comparisons show no statistical significance. (SLC18A1, P = 0.095; TPH1, P = 0.45; FEV, P = 0.31; INS, P = 0.090; ISL1, P = 0.86; PDX1, P = 0.86; CHGA, P = 0.13; NEUROD1, P = 0.37). Statistical significance was assessed by unpaired two-sided t-test. i, Glucose stimulated insulin secretion assay, plotting mean ± s.e.m. (by ELISA, n = 4 biologically independent samples), of differentiated non-transduced control SC-islets. Treatment of doxycycline on non-transduced control shows no significant changes is insulin secretion (P = 0.38). Statistical significances were assessed using unpaired two-sided t-test. EC, enterochromaffin cells. Source data
Extended Data Fig. 3
Extended Data Fig. 3. CTCF induction during differentiation using doxycycline inducible CRISPRa stem cells. Control represents cells without doxycycline treatment.
a, qPCR, plotting mean ± s.e.m. (n = 4 biologically independent samples), showing upregulation of dCas9 (gRNA sequence 1, P = 4.2 × 10−8; gRNA sequence 2, P = 7.8 × 10−4), CTCF overexpression (gRNA sequence 1, P = 1.4 × 10−6; gRNA sequence 2, P = 0.014), and changes in expression (gRNA sequence 1, INS (P = 5.6 × 10−4) ISL1 (P = 1.1 × 10−6), SLC18A1 (P = 0.034), FEV (P = 0.012), CHGA (ns, P = 0.12); gRNA sequence 2, INS (P = 4.4 × 10−6), ISL1 (P = 7.8 × 10−8), SLC18A1 (P = 0.042), FEV (P = 0.0069), CHGA (P = 0.0050), upon doxycycline. Statistical significance assessed by unpaired two-sided t-test. b, qPCR analysis, plotting mean ± s.e.m. (n = 4 biologically independent samples), of CTCF overexpressed (INS, P = 0.0010; IAPP, P = 1.5 × 10−7; ISL1, P = 3.0 × 10−5; DLK1, P = 3.7 × 10−6), EC cells (SLC18A1, P = 1.6 × 10−4; FEV, P = 0.0019; DDC, P = 1.2 × 10−4; TPH1, P = 0.0047; LMX1A, P = 4.6 × 10−4; PDX1, P = 0.0031; NEUROD1, P = 6.2 × 10−5; NKX2-2, P = 0.0047; NKX6-1, P = 7.5 × 10−5; CHGA, P = 6.8 × 10−5; GCG, P = 5.9 × 10−6; SST, P = 0.0046). Statistical significance assessed by unpaired two-sided t-test. c, Immunocytochemistry of SC-islets with CTCF overexpression showing C-peptide (green), NKX6-1 (red), and SLC18A1 (red). Individual image representative of 6 biologically independent samples. d, Protein quantification plot showing mean ± s.e.m. (by ELISA, n = 4 biologically independent samples) after CTCF overexpression (P = 2.2 × 10−4). Statistical significances assessed by unpaired two-sided t-test. e, Insulin secretion, plotting mean ± s.e.m. (by ELISA, n = 3 biologically independent samples), of control (P = 0.0095) and CTCF overexpression (P = 0.0032). Statistical significance assessed using paired two-sided t-test and unpaired two-sided t-test respectively. f, qPCR analysis, plotting mean ± s.e.m. (n = 4 biologically independent samples), comparing CTCF overexpression during Stage 5 of protocol or at Stage 6 of protocol (dCAS9, P = 6.13 × 10−4; CTCF, P = 2.0 × 10−5; INS, P = 0.10; DLK1, P = 0.0023; ISL1, P = 0.18; IAPP, P = 3.3 × 10−4; LMX1A, P = 0.97; SLC18A1, P = 0.12; NEUROG3, P = 9.3 × 10−4; FEV, P = 0.30; DDC, P = 0.27; TPH1, P = 0.21) Statistical significance assessed by unpaired two-sided t-test. g, UMAPs (12467 cells from 2 independent biological samples; integration of all samples) showing cell types in SC-islets induced with CTCF overexpression. h, Heatmap showing normalized gene expression associated with CTCF experiment. i, Dot plots highlighting expression of CTCF and endocrine-associated genes. j, Violin plot of β-cell associated gene expressions of CTCF overexpression in the SC-β cell population. k, Chromatin accessibility around INS genomic region of SC-β cells. l, Feature plots showing decreased accessibility of β-cell motifs and increased accessibility to CTCF motifs in endocrine populations with CTCF overexpression. EC, enterochromaffin cells; ns, not significant. Source data
Extended Data Fig. 4
Extended Data Fig. 4. Single-cell Multiomic ATAC and gene expression characterization of primary huma islets.
a, Brightfield images of primary islets used for multiomic sequencing. Individual image representative of 1 sample. b, Brief primary islet donor information. c, Heatmap showing ATAC promoter accessibility of markers associated with each cell type (30202 cells from 4 independent biological samples; integration of all samples). d, Violin plots for INS, GCG, SST, and PPY gene expression in primary islet cell types from different donors. e, Heatmaps showing the top 20 enriched motifs in primary β, α, δ, and PP cells. f, Re-clustering analysis of primary β cells highlighting heterogeneity by variations in mature and polyhormonal gene expressions. g, Dotplots showing marker genes and unique genes associated with subpopulations identified from the re-clustering of primary β cells. h, Dotplots showing unique motif chromatin accessibility in in subpopulations primary β cells. i, Chromatin accessibility of transcription factor binding sites of MAF, RFX, FOS/JUN, and TEAD motif family in primary β cell subpopulations. PP, Pancreatic progenitors. Source data
Extended Data Fig. 5
Extended Data Fig. 5. Multiomic sequencing comparison of SC-islets and primary human islets.
a, Integrative UMAP showing cells from SC-islets and primary islets (47566 cells from 5 independent biological samples; 3 SC-islets, 2 representative primary islets- donor #1 and #2). b, Integrative UMAP plotted by SC-islet or primary islet condition. Pie charts show composition information of cell types identified. c, Validation analysis showing integrative UMAP of cells from SC-islets and other primary islet datasets (41688 cells from 5 independent biological samples; 3 SC-islets, 2 representative primary islets- donor #3 and #4). Pie charts show composition information of cell types identified. d, Validation analysis showing heatmap highlighting and comparing identity (β, adult β, α, δ, PP and EC) associated gene expression and ATAC promoter accessibility of endocrine cells in SC-islets and primary islets (Human islet donors #3 and #4). e, Validation analysis showing heatmap highlighting and comparing off-target identity (Exocrine, hepatic, esophagus, stomach, intestinal, pancreatic progenitor) associated gene expression and ATAC promoter accessibility in SC-islet cells and primary islet cells (Human islet donors #3 and #4). f, Differential gene expression (top) and motif chromatin accessibility analysis (right) for α-cells (left) and δ-cells (right). Statistical significance was assessed by Wilcoxon rank sum test for RNA expression and logistic regression for motif chromatin accessibility. g, Bar graphs showing fold change comparing SC and primary α and δ cell populations, showing gene expression and motif chromatin accessibility of identified transcription factors associated with the respective cell types. EC, enterochromaffin cells. Source data
Extended Data Fig. 6
Extended Data Fig. 6. Time course characterization and analysis of long-term in vitro SC-islets.
a, Bright field images of SC-islets from week 2, week 3, week 4, month 6, and month 12 of in vitro culture. Individual image representative of 1 sample. b, Integrative UMAP of in vitro SC-islet cells including all time points. c, Heatmap showing increase, or decrease, of marker gene expression in SC-islet cells throughout time (40332 cells from 5 independent biological samples, 1 from each timepoint). d, Glucose stimulated insulin secretion assay, plotting mean ± s.e.m. (by ELISA, n = 4 biologically independent samples), of SC-islets cultured in vitro at week 2 (P = 0.020), week 3 (P = 0.0080), week 4 (P = 0.046), and month 6 (P = 0.27) time point. Statistical significances were assessed using paired two-sided t-test. e, UMAP and bar plots showing composition information of cell types from integrated time course datasets. f and g, Pearson correlation to compare all timepoints, of cell types, (f) using top 2000 most variably expressed genes (mRNA), and (g) using top 2000 most variably accessible promoters from ATAC. EC, enterochromaffin; ns, not significant. Source data
Extended Data Fig. 7
Extended Data Fig. 7. Single-cell Multiomic ATAC and gene expression characterization of transplanted SC-islets.
a, Schematics of SC-islet transplantation and retrieval of graft after 6 months in vivo. b, UMAP and identification of transplanted SC-islet cells using gene expression and chromatin information (7162 cells from 3 independent biological samples; integration of all samples). c and d, Heatmap showing gene expression (c) and ATAC promoter accessibility (d) of markers associated with each cell type. e, Pearson correlation analysis using top 2000 most variable ATAC promoter accessibility of key endocrine populations from SC-islets, transplanted SC-islets, and primary human islets. This analysis highlights the distinctiveness of chromatin identity acquired in cell types from SC-islets after transplantation. f, Heatmap showing the top 200 variable motifs within endocrine cell populations and highlighting motif markers for each in vivo cell type. g, Heatmaps highlighting gene expression and ATAC motif accessibility of top 10 active transcription factors co-enriched with both features in transplanted SC-β, SC-α, SC-δ, and SC-EC cells. Source data
Extended Data Fig. 8
Extended Data Fig. 8. Multiomic sequencing comparison of in vitro SC-islets and transplanted in vivo SC-islets.
a, Integrative UMAP clustering showing cells from in vitro SC-islets and in vivo SC-islets using gene expression and chromatin information (36688 cells from 6 independent biological samples; 3 in vitro SC-islets, 3 in vivo SC-islets; integration of all samples). The pie chart shows composition of cell types in each condition. b, UMAP showing distribution of SC-islet cells from in vitro or after transplanted in vivo condition. This plot highlights the separation of clusters from transplanted in vivo SC-β and SC-EC cells. c, Differential gene expression analysis (top) and motif chromatin accessibility analysis (bottom) of SC-β, SC-α, SC-δ and SC-EC cell populations from in vitro SC-islets and in vivo SC-islets. Statistical significance was assessed by two-sided Wilcoxon rank sum test for RNA expression and two-sided logistic regression for motif chromatin accessibility. d, Gene set enrichment analysis showing enrichment of gene sets comparing in vitro SC-β cells and vivo SC-β cells. Non-adjusted p-values were computed using two-sided Fisher exact test. e, Bar graphs showing fold change differences of cell type associated active transcription factors in SC-α, SC-δ and SC-EC cells from in vitro and in vivo conditions. f, Heatmap comparing gene expression, promoter accessibility, or motif chromatin accessibility in β-cells from in vitro SC-islets, in vivo islets, and primary islets (26697 cells from 5 independent biological samples; 1 representative in vitro SC-islets, 1 representative primary islets, 3 in vivo SC-islets). EC, enterochromaffin. Source data
Extended Data Fig. 9
Extended Data Fig. 9. Multiomic sequencing comparison of week 2 in vitro SC-islets with 6 months in vitro SC-islets and 6 months in vivo SC-islets.
a, Integrative UMAP clustering showing cells from 2 weeks in vitro SC-islets, 6 months in vitro SC-islets, and 6 months in vivo SC-islets using gene expression and chromatin information (24491 cells from 5 independent biological samples; 1 representative week 2 SC-islets, month 6 SC-islets, 3 month 6 in vivo SC-islets). b, Heatmap showing gene expression and promoter accessibility of gene markers for SC-β, SC-α, SC-δ, and SC-EC cells. c, Gene expression and motifs accessibility of active transcription factors associated with SC-β, SC-α, and SC-δ identity. d, Gene list showing markers for β cell identity 6 months in vitro, in vivo or both. Initial number of genes represent upregulated genes in the 6 month conditions (vitro and vivo) when compared to 2 week SC-islets. List of genes was cross-referenced with β cell upregulated genes from primary human islets. e, Plot highlighting greater increase of motifs accessibility from 6 months in vivo SC-β cells when compared in 6 months in vitro. Source data
Extended Data Fig. 10
Extended Data Fig. 10. ARID1B knockdown increases expression of identity genes and chromatin features in SC-β cells.
a, Cross reference map of upregulated SC-β cell and primary β-cell genes (left) or transplanted SC-β cell genes (right) with chromatin associated genes to highlight regulators associated with each cell states. Individual image representative of 1 sample. b, Brightfield images of SC-islets transfected with lentivirus carrying ARID1B shRNA. c, qPCR analysis, plotting mean ± s.e.m. (n = 4 biologically independent samples for shRNA sequence 1; n = 3 biologically independent samples for shRNA sequence 2), showing reduced expression of ARID1B using lentiviruses resulting in increased β cell identity gene expressions. (shRNA sequence 1: ARID1B, P = 5.3 × 10−4; INS, P = 0.0014; ISL1, P = 0.022; DLK1, P = 4.3 × 10−5; NKX6-1, P = 0.0015; IAPP, P = 3.0 × 10−6; G6PC2, P = 2.1 × 10−4) Two shRNA sequences were tested for validation of results. (shRNA sequence 2: ARID1B, P = 0.018; INS, P = 0.0035; IAPP, P = 5.9 × 10−6; DLK1, P = 0.045, G6PC2, P = 0.0054) Statistical significance was assessed by unpaired two-sided t-test. d, Confocal fluorescent images showing increased expression of amylin in SC-islets with ARID1B knockdown. Individual image representative of 5 biologically independent samples. e, Flow cytometry analysis, plotting mean ± s.e.m. (n = 4 biologically independent samples), of SC-islets with ARID1B shRNA showing increased fraction of cells with C-peptide expression (P = 2.2 × 10−5) Statistical significance was assessed by unpaired two-sided t-test. f, ELISA quantification, plotting mean ± s.e.m. (n = 4 biologically independent samples) of glucagon (P = 0.017), and somatostatin (ns, P = 0.087) content. Statistical significance was assessed by unpaired two-sided t-test. g, Glucose stimulated insulin secretion assay, plotting mean ± s.e.m. (by ELISA, n = 4 biologically independent samples), comparing insulin secretion at high glucose (20 mM) stimulation from control (GFP shRNA) and ARID1B shRNA SC-islets in presence of various secretagogues. (Glucose (20 mM), P = 0.27; KCL, P = 0.049; Exendin 4, P = 0.035; IBMX, P = 0.94; Tolbutamide, P = 0.43) Statistical significances were assessed using paired two-sided t-test. h, Single-cell multiomic sequencing UMAPs of ARID1B knockdown SC-Islets, showing identified cell types, and cell knockdown condition using both gene expression and ATAC information (21969 cells from 2 independent biological samples; integration of all samples). i, Differential gene expression analysis of SC-β cells comparing control and ARID1B shRNA. Statistical significance was assessed by Wilcoxon rank sum test. j, Chromatin accessibility around the IAPP genomic region of SC-β cells, showing increased peak signals with ARID1B shRNA. EC, enterochromaffin; ns, not significant. Source data

Comment in

References

    1. Lanzoni G, Ricordi C. Transplantation of stem cell-derived pancreatic islet cells. Nat. Rev. Endocrinol. 2021;17:7–8. doi: 10.1038/s41574-020-00430-9. - DOI - PubMed
    1. Millman JR, Pagliuca FW. Autologous pluripotent stem cell-derived β-like cells for diabetes cellular therapy. Diabetes. 2017;66:1111–1120. doi: 10.2337/db16-1406. - DOI - PubMed
    1. Aguayo-Mazzucato C, Bonner-Weir S. Stem cell therapy for type 1 diabetes mellitus. Nat. Rev. Endocrinol. 2010;6:139–148. doi: 10.1038/nrendo.2009.274. - DOI - PubMed
    1. Velazco-Cruz L, et al. Acquisition of dynamic function in human stem cell-derived β cells. Stem Cell Rep. 2019;12:351–365. doi: 10.1016/j.stemcr.2018.12.012. - DOI - PMC - PubMed
    1. Pagliuca FW, et al. Generation of functional human pancreatic β cells in vitro. Cell. 2014;159:428–439. doi: 10.1016/j.cell.2014.09.040. - DOI - PMC - PubMed

Publication types