Case Reports
. 2023 May;29(5):1243-1252.
doi: 10.1038/s41591-023-02318-3. Epub 2023 May 15.

Resilience to autosomal dominant Alzheimer's disease in a Reelin-COLBOS heterozygous man

Affiliations
Case Reports

Resilience to autosomal dominant Alzheimer's disease in a Reelin-COLBOS heterozygous man

Francisco Lopera et al. Nat Med. 2023 May.

Abstract

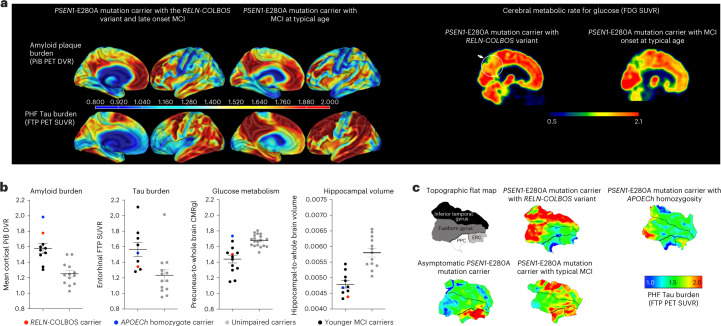
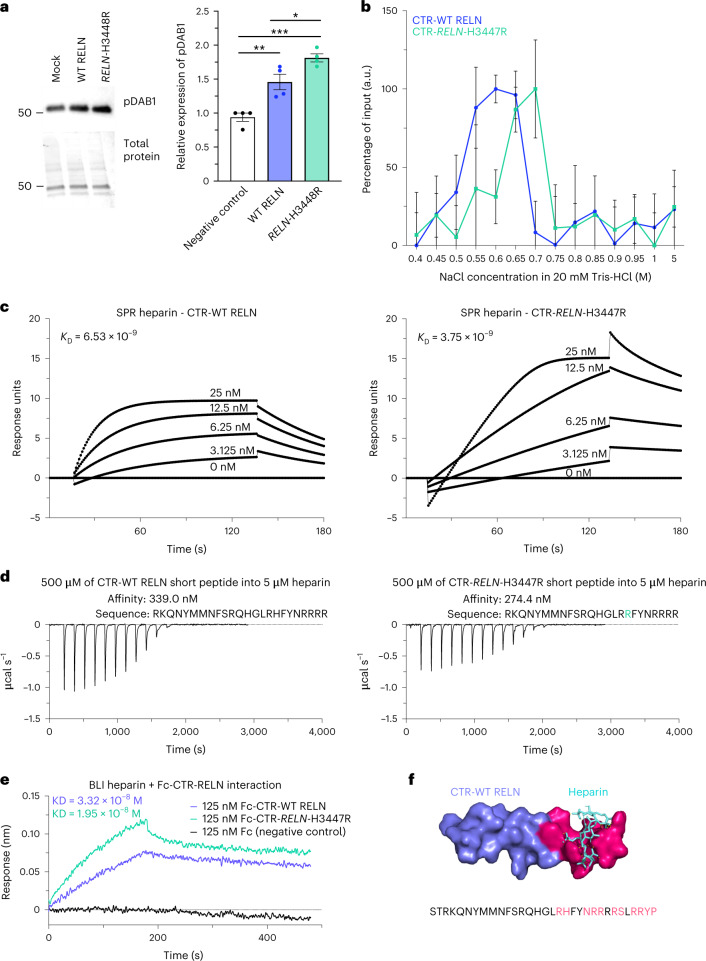
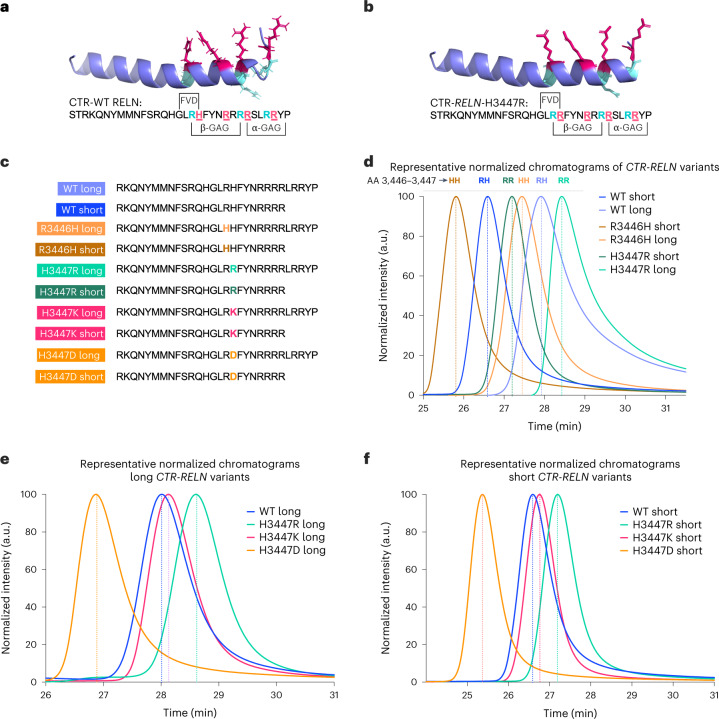
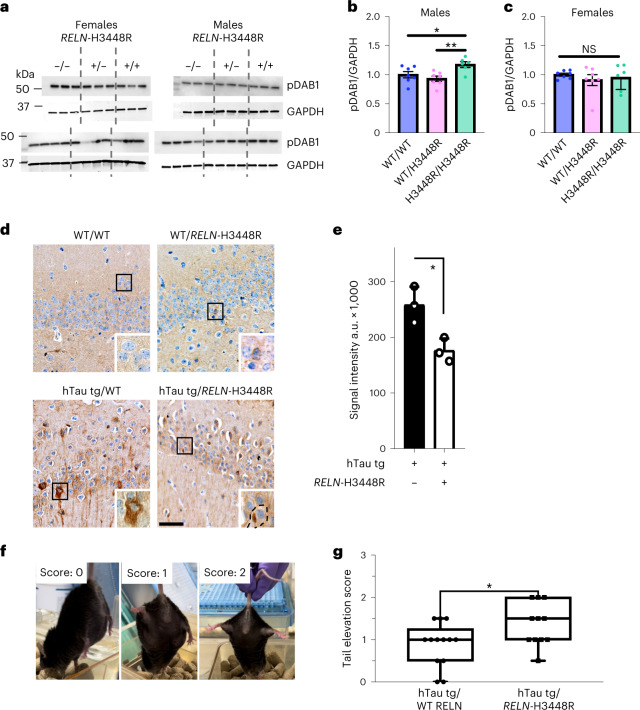
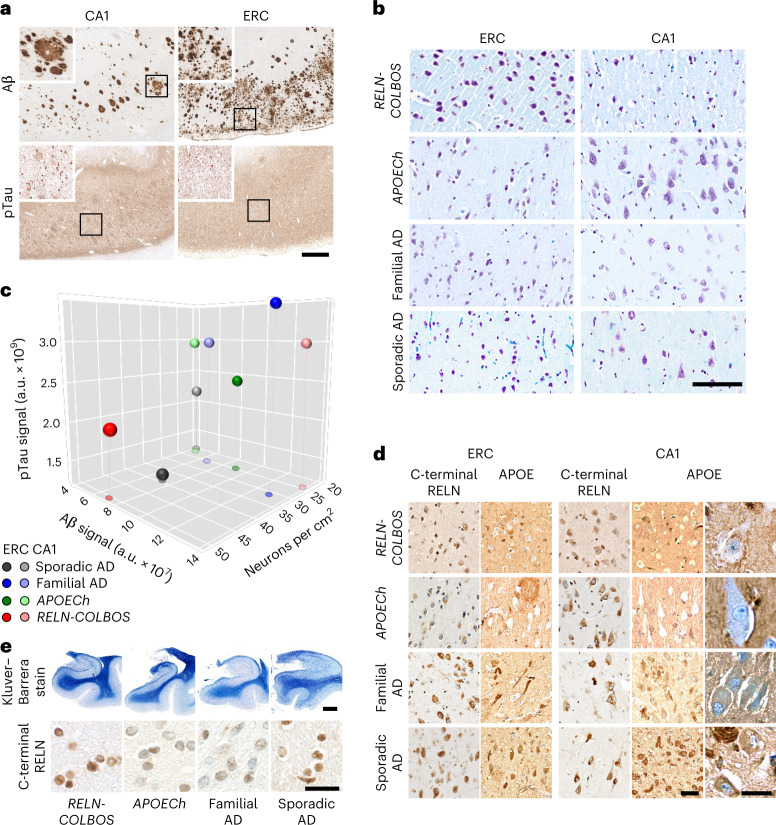
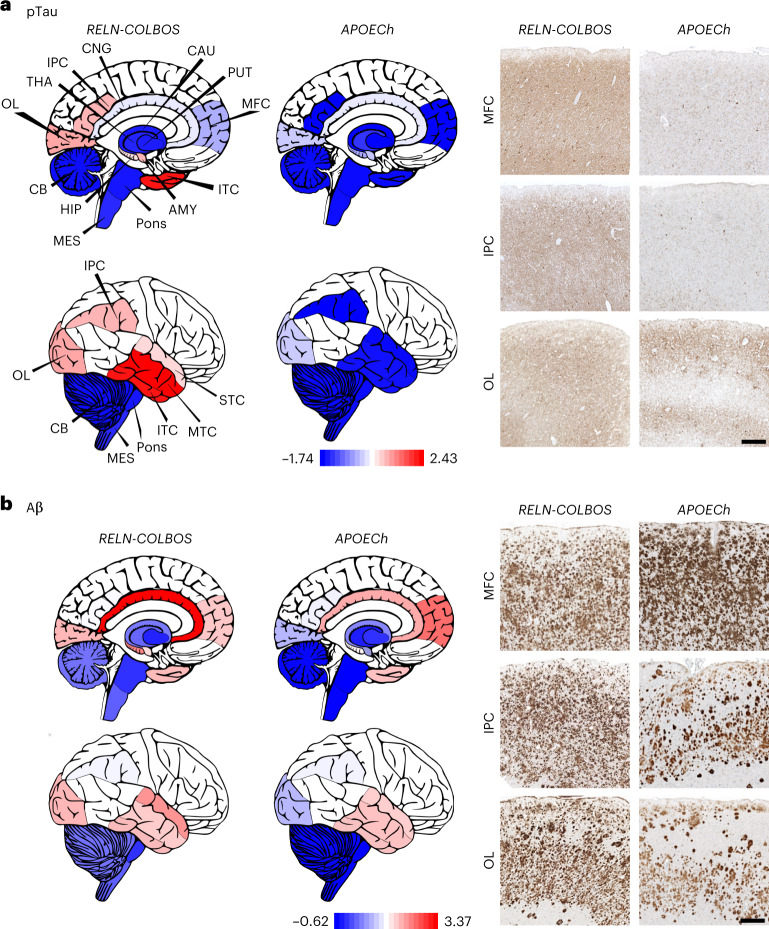
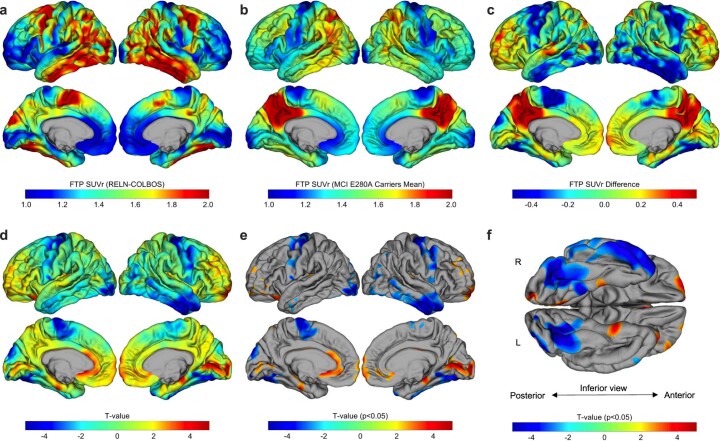
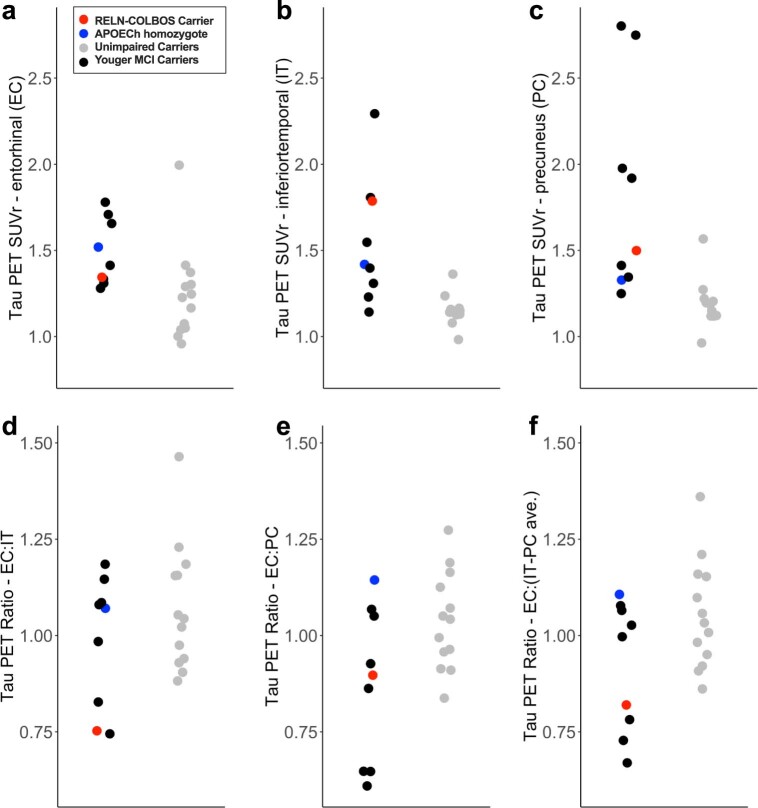
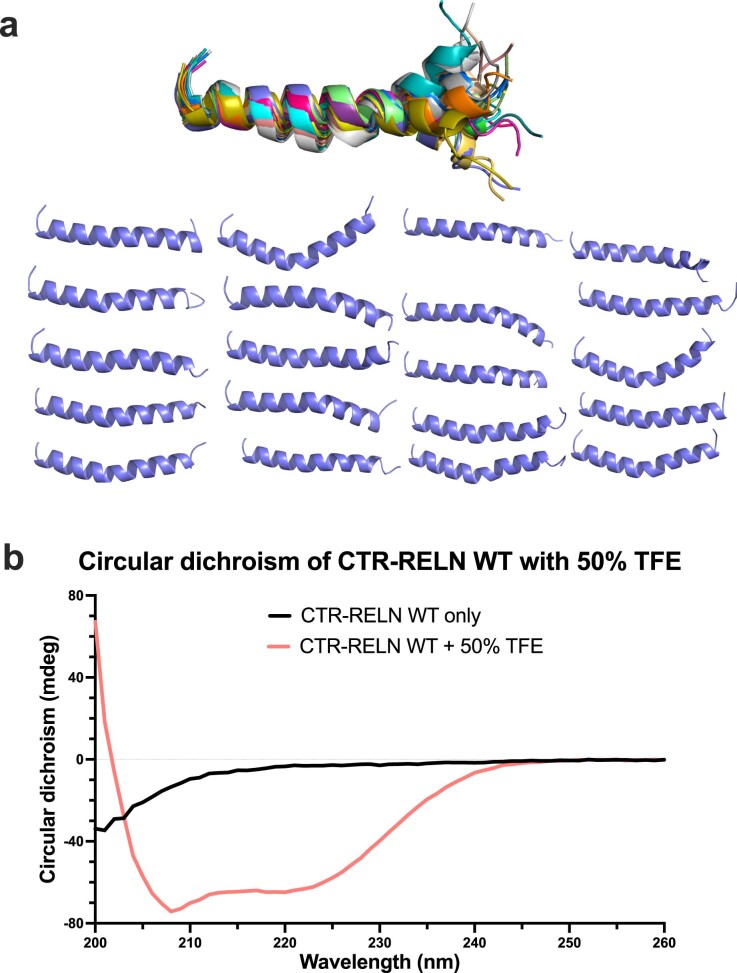
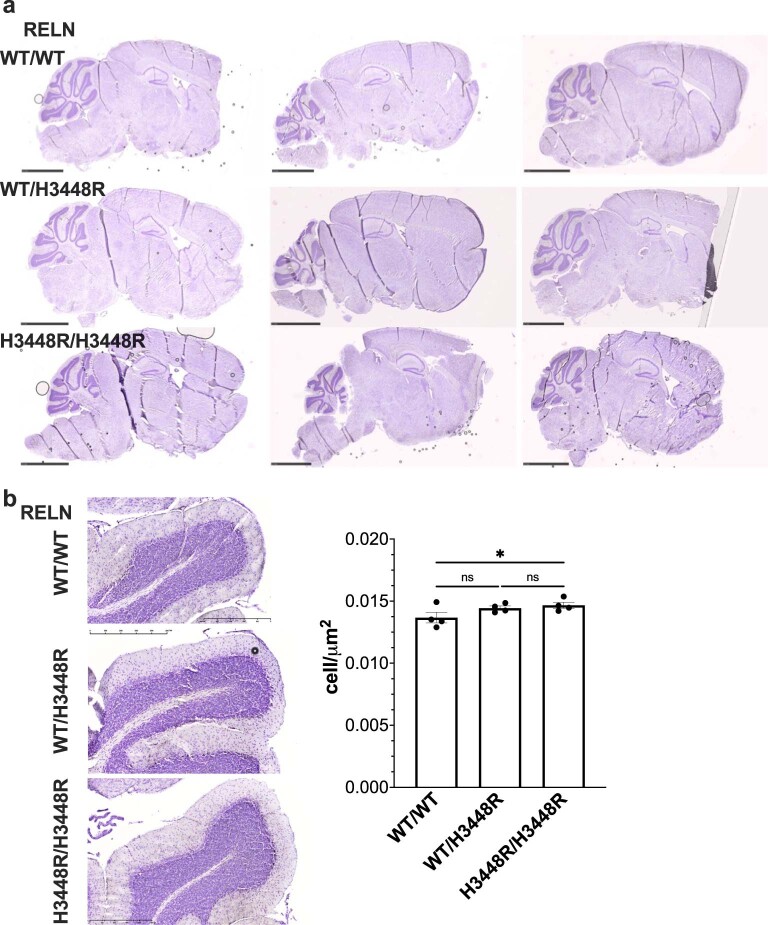
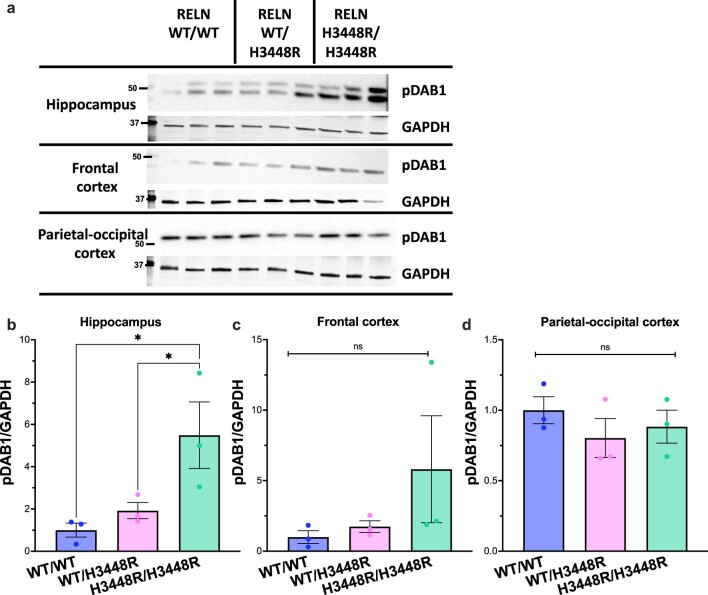
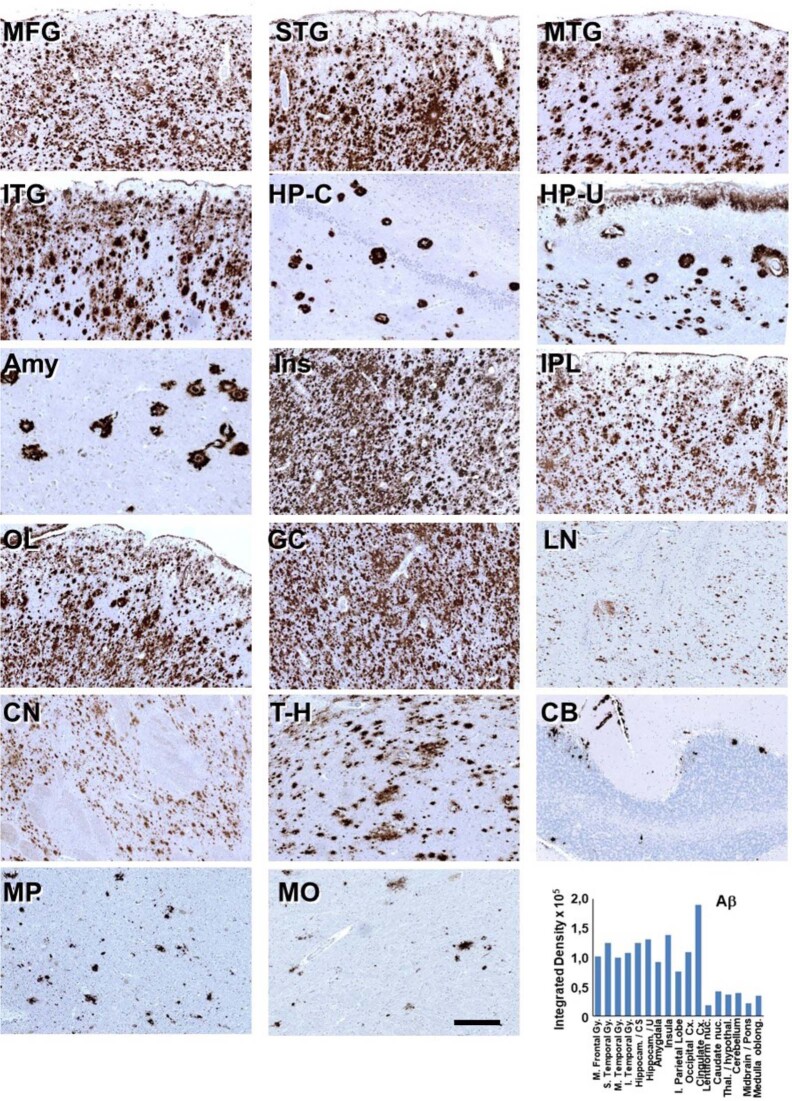
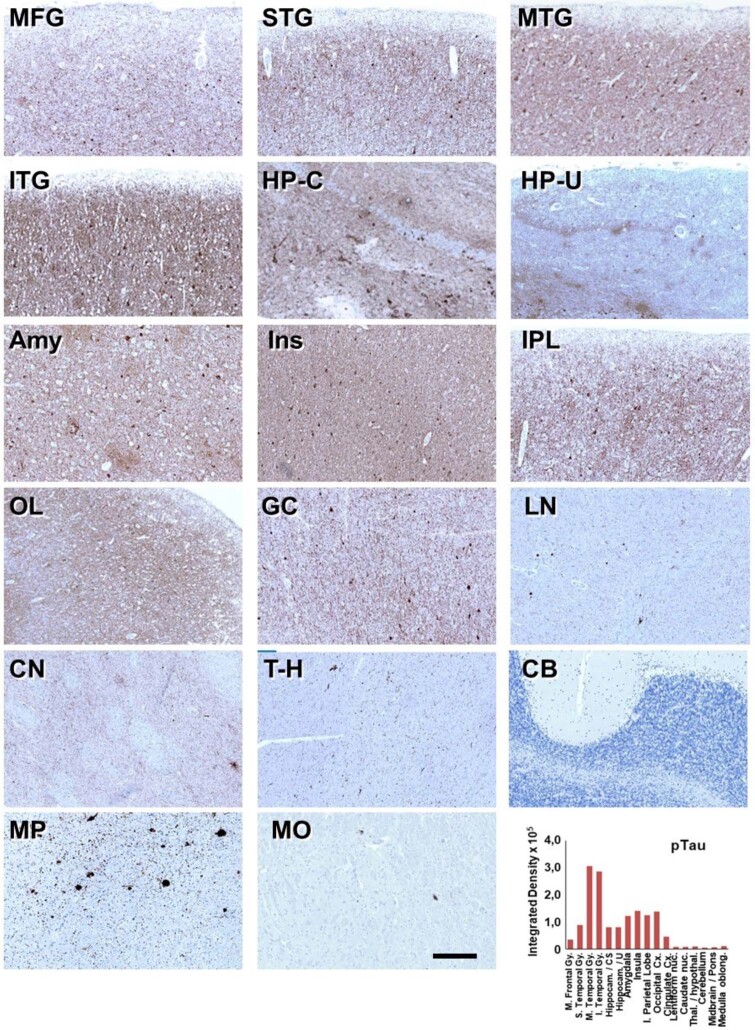
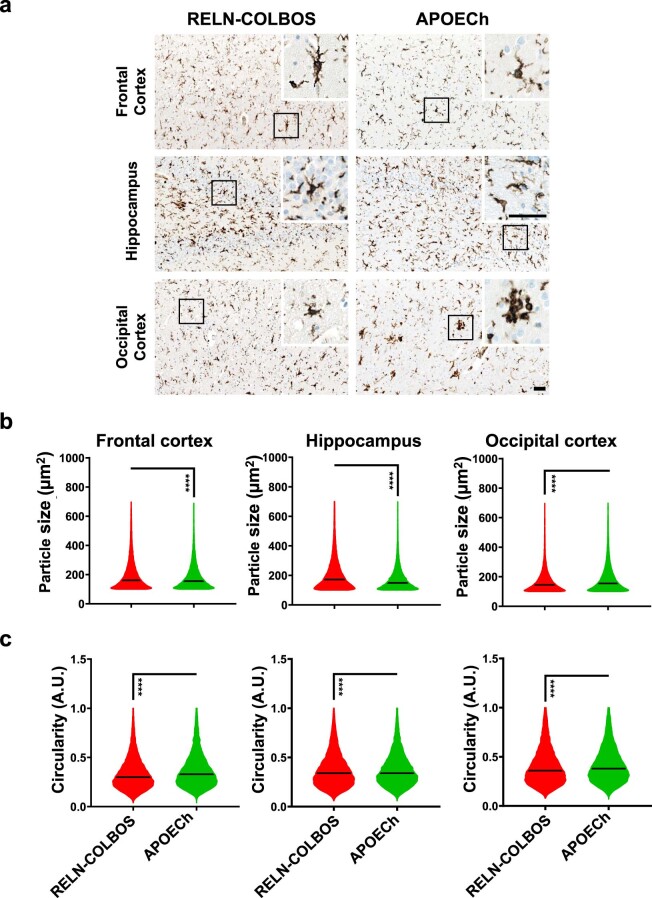
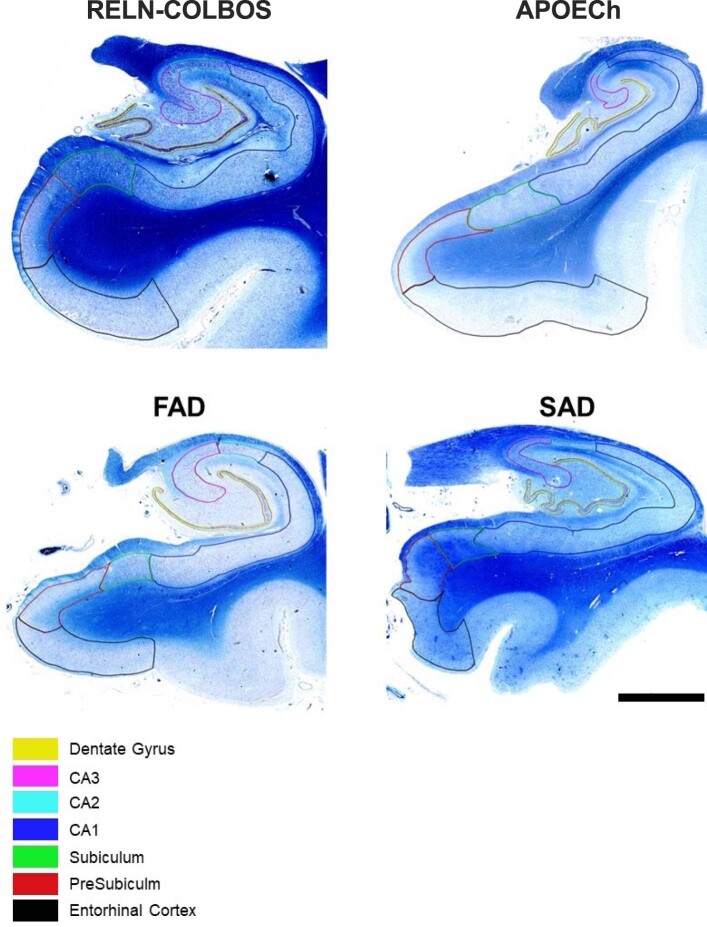
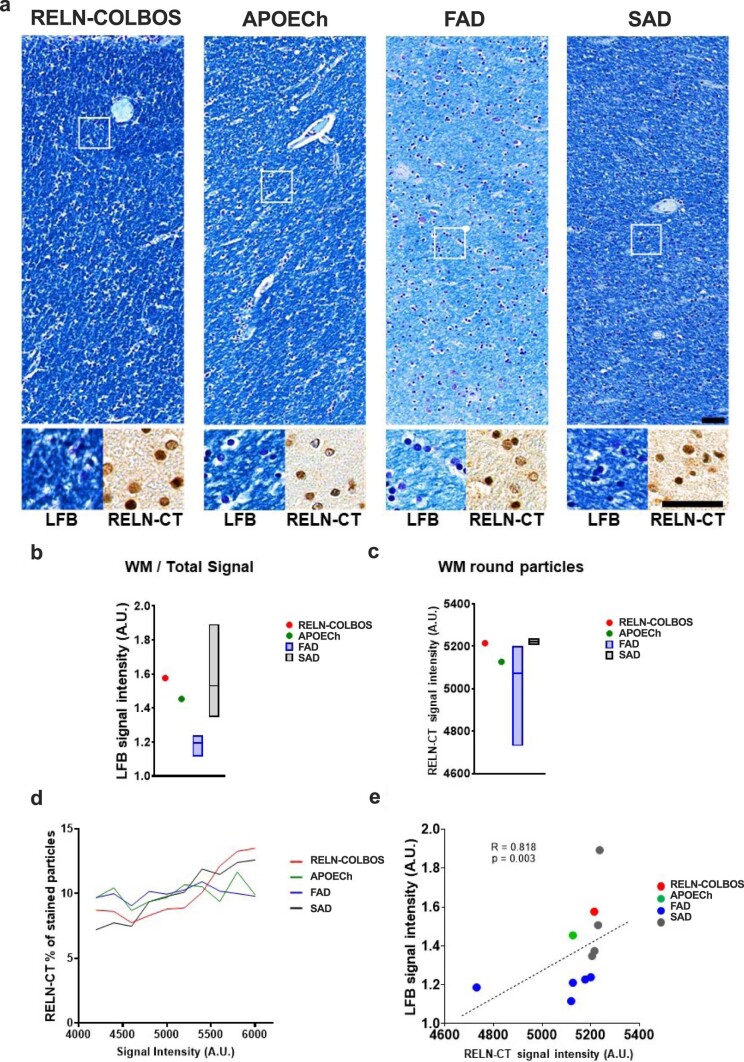
We characterized the world's second case with ascertained extreme resilience to autosomal dominant Alzheimer's disease (ADAD). Side-by-side comparisons of this male case and the previously reported female case with ADAD homozygote for the APOE3 Christchurch (APOECh) variant allowed us to discern common features. The male remained cognitively intact until 67 years of age despite carrying a PSEN1-E280A mutation. Like the APOECh carrier, he had extremely elevated amyloid plaque burden and limited entorhinal Tau tangle burden. He did not carry the APOECh variant but was heterozygous for a rare variant in RELN (H3447R, termed COLBOS after the Colombia-Boston biomarker research study), a ligand that like apolipoprotein E binds to the VLDLr and APOEr2 receptors. RELN-COLBOS is a gain-of-function variant showing stronger ability to activate its canonical protein target Dab1 and reduce human Tau phosphorylation in a knockin mouse. A genetic variant in a case protected from ADAD suggests a role for RELN signaling in resilience to dementia.


Conflict of interest statement

None of the authors were precluded from accessing data in the study; they accept responsibility to submit the manuscript for publication. J.F.A.-V. and L.A.K. are cofounders of Epoch Biotech, a company developing resilient case-inspired therapeutics. Y.T.Q., J.F.A.-V. and F.L. serve as consultants for Biogen. K.S.K. consults with Expansion Therapeutics, ADRx Pharma and Herophilus, and serves on the board of directors of the Tau Consortium. E.M.R. is a compensated scientific advisor to Alzheon, Aural Analytics, Denali, Retromer Therapeutics and Vaxxinity, and a cofounder and advisor to ALZpath, which was not involved in this study. The other authors declare no competing interests.

Figures

Fig. 1
Fig. 1. PET imaging of the RELN-COLBOS (H3447R) carrier.
a, Representative PiB PET amyloid and FTP Tau PET imaging of the male case with RELN-COLBOS (left) compared to a PSEN1-E280A mutation carrier with MCI at a typical age (right). For both measurements, specific binding of the tracer is represented using a color-coded scale with blue being the lowest (DVR or SUVR = 0.8) and red being the highest (DVR or SUVR = 2.00) degree of binding. Right, representative FDG PET precuneus cerebral metabolic rate for glucose (CMRgI) of the male case with RELN-COLBOS (left) compared to a PSEN1-E280A carrier with MCI at a typical age (right). Binding affinity of the dye is represented using a color-coded scale with blue being the lowest (SUVR = 0.5) and red being the highest (SUVR = 2.1) degree of binding. PHF, paired helical filament. b, Dot plot analysis of the imaging measurements shown in a for amyloid and Tau burden, glucose metabolism and hippocampal volume. Brain imaging measurements of the male case with RELN-COLBOS (red dot) compared to the previously published APOECh homozygote female (blue dot), unimpaired PSEN1-E280A carriers (gray dots, n = 18 for the glucose metabolism panel, n = 13 for all other panels) and younger carriers of the MCI PSEN1-E280A mutation (black dots, n = 7 for the Tau burden plot, n = 8 for the amyloid burden and hippocampal volume plots, n = 11 for glucose metabolism). Some previously published data points are included in the figures because they are the only available data for comparison. Data are expressed as individual values with the mean ± s.e.m. c, Anatomical details of Tau burden in the temporal cortex. Flat map representations of the right hemisphere temporal lobe cortex for regions of interest (ROIs) (top left, ERC), with Tau PET (FTP) overlay for four cases. The asymptomatic PSEN1-E280A carrier was 38 years old; the PSEN1-E280A carrier with typical MCI was 44 years old. The male carrier of RELN-COLBOS was notable for having relatively lower Tau burden in the medial temporal regions (ERC and PPC), compared to typical PSEN1-E280A mutation carriers.
Fig. 2
Fig. 2. The RELN-H3448R variant enhances Dab1 signaling and the affinity of CTR-RELN to heparin.
a, Representative western blotting of pDab1 levels (top) and total protein staining (bottom) levels in primary mouse cortical neurons treated with full-length WT RELN or RELN-H3448R, mouse ortholog of RELN-H3447R (mock, P < 0.0029 and WT RELN, P = 0.0246). Data are presented as the mean ± s.e.m. and were analyzed using a Kruskal–Wallis test with Dunn post hoc analysis for multiple comparisons of n = 4 independent biological experiments. b, Spectroscopic analysis of heparin chromatography fractions of WT CTR-RELN (blue plot) and the CTR-RELN-H3447R mutant (green plot) eluted at increasing gradients of NaCl (0.05 M NaCl step gradient). Data are expressed as the percentage of input over 0.4–5 M NaCl gradient fractions. Data show that 0.55 M NaCl can displace WT CTR-RELN binding from a heparin column. The affinity for heparin of CTR-RELN increases in the presence of the H3447R mutation, as suggested by the shift of the peak with maximum height of the eluted fraction from 0.55 to 0.7 M NaCl. n = 3 independent chromatography experiments. The error bars represent the s.e.m. c, Representative sensorgrams of the binding analysis between chip sensors coated with heparin and 0–25 nM increasing concentrations of CTR-RELN variants. Data are expressed as response units per second. The equilibrium disassociation constant (KD) for each SPR analysis are shown inside the graph and support the difference in affinity binding between heparin and the CTR-RELN variants: H3447R (right plot, KD = 3.75 × 10−9 M-1 s-1) > H3347 (left plot, KD = 6.53 × 10−9 M-1 s-1). The sensorgrams of CTR-RELN with the H3447K and H3447D control variants are reported in Supplementary Fig. 6 for comparison. d, Isothermal calorimetry measurements of short-variant WT CTR-RELN (left) and CTR-RELN-H3447R (right) titrated with 5 μM heparin. Affinity calculations are reported above each plot. e, Binding analysis via BLI between Fc-fusion WT CTR-RELN and H3447R and a heparin-coated biosensor. Association (ka) and dissociation constants (kd) were used to calculate the KD that is displayed in the plot. f, Docking of WT CTR-RELN (purple) with a representative heparin molecule (cyan). Amino acids in CTR-RELN that have polar contacts with heparin are highlighted in magenta. Source data
Fig. 3
Fig. 3. Binding profiles of CTR-RELN variants with heparin.
a,b, Representative in silico models depicting the orientation of basic amino acids in the heparin-binding motif (highlighted with colors) using the WT CTR-RELN NMR structure (a). For the H3447R CTR-RELN variant (b) the model was determined by a homology-based model of WT CTR-RELN that was calculated by Swiss-Model. Position 3,447 orients in the same direction as most other arginines (magenta). Arginines in positions 3,446, 3,453 and 3,457 (cyan) may also interact with heparin as part of the heparin-binding motif but are oriented differently from most basic amino acids. c, RELN peptide variant sequences used for the HPLC analysis. d, Representative chromatographic profiles normalized to the maximum of each eluted peak of short or long CTR-RELN peptides with zero (R3446H, orange), one (WT, blue) or two (H3447R, green) arginines in positions 3,446–3,447, which are predicted to contribute to increased interaction with heparin and are indicated by later peak retention time in the isocratic 1 M KCl elution. e,f, Long (e) or short (f) CTR-RELN peptides with zero (R3446H, orange), one (WT, blue) or two (H3447R, green) arginines in positions 3,446–3,447 showing increased interaction with heparin for the long variants, as indicated by later peak retention time in the isocratic 1 M KCl elution. Conversely, short RELN variants have earlier peak retention times compared to long RELN variants (e). n = 2 independent chromatographic repeats within <0.5 min of representative peaks. Data are expressed as normalized to the maximum emission wavelength for each peak.
Fig. 4
Fig. 4. RELN-H3448R homozygosity promotes pDab1 signaling, reduces Tau hyperphosphorylation and preserves motor functions in mice.
a, Representative western blots of pDab1 (top) and GAPDH levels (bottom) detected in the CB of both female (left) and male (right) mice either WT (WT/WT RELN), heterozygous (WT RELN/H3448R) or homozygous (RELN-H3448R/H3448R) for the mRELN-H3448R mutation. Levels of pDab1 were detected in 6–12-month-old mice. b,c, Quantifications of pDab1 levels normalized to GAPDH and expressed as the fold change of WT RELN showing a genotype effect in pDab1 levels in male mice (b) but not female mice (c). *P = 0.0284 for WT/WT, n = 7 mice versus H3448R/H3448R, n = 6 mice, t = 1.001, d.f. = 17; **P = 0.0037 for WT/H3448R, n = 7 mice versus H3448R/H3448R, n = 6 mice, t = 3.356, d.f. = 17, one-way analysis of variance (ANOVA). Data are expressed as the average ± s.e.m. Analyses of pDab1 levels in male mice at 3 months of age and in other brain regions are shown in Extended Data Fig. 5. Validation of the anti-pDab1 antibody used in a and e is reported in Supplementary Figs. 5 and 6. d, Representative immunohistochemistry (IHC) images from the HIC of WT/WT, WT/RELN-H3448R, hTau tg/WT and hTau tg/RELN-H3448R mice stained with hyperphosphorylated Tau (pTau) T205 antibody. hTau tg/WT mice showed neurofibrillary tangles and neuropil threads in the first region of the hippocampal circuit (CA1) and dentate gyrus, while hTau tg/RELN-H3448R showed Tau pathology to a lesser degree (soma of an affected neuron depicted with a dotted line). Bar scale, 100 μm. e, Bar graph for pTau T205 signal intensity values in hTau tg/WT (n = 3 mice) and hTau tg/RELN-H3448R mice (n = 3 mice). The latter showed significantly lower signal intensity. *P = 0.022, two-sided Student’s t-test. The error bars represent the s.d. from the mean. f, Representative phenotype observed during the tail elevation test and relative score (0 = severely impaired, 1 = 50% impaired, 2 = normal). g, Tail elevation recorded on WT RELN/Tau-P301L (n = 13 male mice) and RELN-H3448R/Tau-P301L crossed male mice (n = 11 male mice) showed a significantly improved tail elevation score in the presence of the RELN-H3448R variant compared to Tau-P301L mice expressing WT RELN (*P = 0.0305, two-tailed unpaired t-test, t = 2.313, d.f. = 22). Box plots are expressed as minimum to maximum values around the average. Source data
Fig. 5
Fig. 5. Neuropathological characterization of the case with PSEN1-E280A;RELN-H3447R.
a, Aβ and pTau pathologies in the CA1 and ERC. Both pathologies present wide distribution and intensity. Aβ pathology shows diffuse plaques with varied distribution and size (panels and insets). pTau pathology shows varied density of neurofibrillary tangles and diffuse Tau pathology. Scale bar, 500 μm. b, Neurons stained with Klüver–Barrera stain in the CA1 and ERC of the case with PSEN1-E280A/RELN-COLBOS, the case with PSEN1-E280A/APOECh, a case with average-onset PSEN1-E280A familial AD and a case with sporadic AD. Scale bar, 125 μm. c, Three-dimensional scatter plot for Aβ, pTau and neuronal density for ERC and CA1 from cases with RELN-COLBOS, APOECh, familial AD (n = 5) and sporadic AD (n = 4). The ERC in the case with RELN-COLBOS shows the highest neuronal density, with low Aβ and pTau pathologies. d, C-terminal RELN and APOE staining of the cases with RELN-COLBOS, APOECh, familial AD and sporadic AD in the ERC and CA1. The case with RELN-COLBOS shows a stronger background signal in both structures with lower intraneuronal signal for C-terminal RELN in the ERC. Similarly, the case with APOECh shows lower intraneuronal signal in ERC with the C-terminal RELN antibody and very low intraneuronal signal in both structures with the APOE antibody (magnified right). Finally, APOE staining shows noticeable plaque- and tangle-like signals in cases with familial and sporadic AD in both structures, the ERC and CA1. Scale bars, 100 μm and 25 μm in the magnified panel. e, Klüver–Barrera staining of whole hippocampal and parahippocampal sections (top), together with representative magnified images of parahippocampal subcortical white matter stained with C-terminal RELN antibody in the cases with RELN-COLBOS, APOECh, familial and sporadic AD (bottom). The case with RELN-COLBOS showed increased white matter Luxol Fast Blue signal intensity, while the cases with RELN-COLBOS and sporadic AD showed increased intracellular C-terminal RELN signal in white matter. Scale bars, 2.5 mm for the top panel and 25 μm for the bottom panel.
Fig. 6
Fig. 6. Brain distribution of AD hallmarks in the cases with RELN-COLBOS and APOECh.
a,b, Graphic representation and representative images of the distribution and intensity of pTau (a) and Aβ (b) pathology signals with normalized minimum and maximum values shown in red and blue, respectively in the cases with RELN-COLBOS and APOECh. The case with APOECh showed distinct decreased pTau pathological profiles in all cortices compared to the case with RELN-COLBOS. Despite some distribution differences, the Aβ pathology profile was similarly severe in both cases. AMY, amygdala; CAU, caudate; CNG, cingulate cortex; IPC, inferior parietal cortex; ITC, inferior temporal cortex; MES, mesencephalon; MFC, medial frontal cortex; MTC, middle temporal cortex; OL, occipital lobe; PUT, putamen; STC, superior temporal cortex; THA, thalamus. Scale bars, 250 μm.
Extended Data Fig. 1
Extended Data Fig. 1. Whole-cortex (vertex-wise) comparison of RELN-COLBOS carrier to typical MCI PSEN1 E280A carriers’ tau PET.
This analysis confirmed that compared to other PSEN1 E280A carriers who developed MCI at younger ages, the RELN-COLBOS carrier had relatively spared tau PET signal in the medial temporal lobe (entorhinal cortex / parahippocampal gyrus), but not in other areas including temporal neocortex. a, Cortical surface projection of vertex-wise tau PET (Flortaucipir, FTP) standardized uptake value ratio (SUVr) in the RELN-COLBOS carrier. b, Mean tau PET image of typical MCI PSEN1 E280A carriers (n = 7). c, difference analysis between images (b) and (a): negative values indicate areas where RELN-COLBOS carrier had higher tau PET signal compared to other carriers, and vice-versa. d, T-value for one-sample 2-sided t-tests comparing other PSEN1 E280A carriers to the RELN-COLBOS patient. Directionality of effect size is the same as (c). Panel e shows T-values as in (d) masked by p value < 0.05 (uncorrected). f, Inferior / close-up view of surfaces shown in (e).
Extended Data Fig. 2
Extended Data Fig. 2. Regional comparison of tau PET burden in RELN-COLBOS carrier versus other PSEN1 E280A carriers.
This analysis confirmed that compared to other PSEN1 E280A carriers who developed MCI at younger ages, the RELN-COLBOS carrier had relatively spared tau pathology in the medial temporal lobe (entorhinal cortex / parahippocampal gyrus), but not in other areas including temporal neocortex (inferior temporal). a-c, Regional tau PET signal (Flortaucipir, FTP) standardized uptake value ratio (SUVr) in three regions of interest: entorhinal (EC, a), inferior temporal (IT, b), and precuneus (PC, C). d-f, Ratios of tau PET uptake in medial temporal (EC) and neocortical (IT, PC) regions. d, EC:IT ratio, e, EC:PC ratio, f, ratio of EC to average of IT and PC (neocortical average). The tau pattern of the RELN-COLBOS patient was notable for the relative involvement of medial temporal versus temporal neocortex, particularly given the older age of the RELN-COLBOS patient compared to other carriers.
Extended Data Fig. 3
Extended Data Fig. 3. RELN CTR structural determination.
a, In silico models for the 20 lowest energy structures of CTR-RELN produced by 2D NMR. b, Representative CD spectra of CTR-RELN without heating showing that the CTR-RELN has primarily an alpha helical structure while the peptide without 50% 2, 2, 2-Trifluoroethanol has a spectrum closest to a random coil. Data is presented as the average of four spectra. Secondary structure analysis is reported in Supplementary Table 7.
Extended Data Fig. 4
Extended Data Fig. 4. Increased neuronal density in the cerebellum’s granular layer in the presence of the H3448R RELN mice. presence of the H3448R RELN mice.
a, Representative Cresyl violet staining of n = 3 midsagittal sections from male RELN mice (WT/WT, WT/H3448R, H3448R/H3448R; 5–6-month-old mice). Data is showing that the H3448R variant does not affect qualitatively the gross anatomy, nor neuronal distribution in the whole brain. Scale bar, 2.5 mm. b, Cresyl violet staining of the granular region of the cerebellum, indicating an increased neuronal density in the homozygotes (H3448R/H3448R) as compared to wild type (WT/WT) and heterozygote (WT/H3448R) mice. Scale bar, 500 μm. c, Neuron density analysis of the granular layer of the RELN-H3448R cerebellum in comparisons to wild type. Data indicates a significantly increased neuron counting (*p = 0.0470, n1 = n2 = 4, t = 2.300, DF = 9) in homozygotes (H3448R/H3448R) as compared with wild type (WT/WT). One-way ANOVA, followed by Fisher’s LSD test post-hoc analysis for multiple comparison of n = 4 specimens for each genotype. Data is presented as mean ± S.D. At least 2 sections and 5 fields per section were analyzed for each specimen.
Extended Data Fig. 5
Extended Data Fig. 5. pDab1 levels in different brain regions of the novel H3448R-RELN transgenic mouse model.
a, Representative blots of pDab1 and GAPDH levels in hippocampus, frontal cortex and parietal-occipital cortex of total homogenate obtained from RELN WT/WT, RELN WT/H3448R and RELN H3448R/H3448R brains (n = 3). b-c, Quantification of normalized to GAPDH levels of pDab1 positive bands detected in the hippocampus (b), frontal cortex (c), and parietal-occipital cortex (d) from RELN WT/WT, RELN WT/H3448R and RELN H3448R/H3448R male mice at 16 weeks of age, n = 3 mice. Data is showing that there are significantly increased pDab1 levels in the presence of the homozygous H3448R mutation compared to heterozygous and WT hippocampus (b, *p = 0.03866, WT/WT vs. WT/H3448R, n1 = n2 = 3, t = 3.32, DF = 6; *p = 0.01596, WT/WT vs. H3448R/H3448R, n1 = n2 = 3, t = 2.63773, DF = 6). For all quantification, we used one-way ANOVA, followed by Fisher’s Least Significant difference (LSD) test for multiple comparisons. All data is presented as average ± s. e. m. Source data
Extended Data Fig. 6
Extended Data Fig. 6. IHC staining for Amyloid β.
MFG = Medial frontal gyrus, STG = Superior temporal gyrus, MTG = Medial temporal gyrus, ITG = Inferior temporal gyrus, HP-C = Hippocampus/collateral sulcus, HPUncus = Hippocampus/uncus, Amy = Amygdala, Ins = Insula, IPL = Inferior parietal lobe, OL = Occipital lobe, GC = Gyrus cinguli, LN = Lentiform nucleus, CN = Caudate nucleus, T-H = Thalamus/Hypothalamus, CB = Cerebellum, MP = Midbrain/pons, MO = Medulla oblongata. Scale bar = 100 𝜇m.
Extended Data Fig. 7
Extended Data Fig. 7. IHC staining for ptau.
MFG = Medial frontal gyrus, STG = Superior temporal gyrus, MTG = Medial temporal gyrus, ITG = Inferior temporal gyrus, HP-C = Hippocampus / collateral sulcus, HP-Uncus = Hippocampus/uncus, Amy = Amygdala, Ins = Insula, IPL = Inferior parietal lobe, OL = Occipital lobe, GC = Gyrus cinguli, L = Lentiform nucleus, CN = Caudate nucleus, T-H = Thalamus/Hypothalamus, CB = Cerebellum, MP = Midbrain/pons, MO = Medulla oblongata. Scale bar = 100 𝜇m.
Extended Data Fig. 8
Extended Data Fig. 8. Morphological assessment of microglia in RELN-COLBOS and APOECh protected cases.
a, Representative pictures of ionized calcium binding adaptor molecule1 (IBA1) stained microglia in frontal cortex, hippocampus, and occipital cortex from both, PSEN1 E280A RELN-COLBOS case and the PSEN1 E280A APOECh homozygous case. Bar, 50 μm. b, c, Violin plots for size and circularity assessment in RELN-COLBOS and APOECh cases. The RELN-COLBOS showed significantly larger microglia in frontal cortex (FC, number of particles, np = 45679) and hippocampus (Hip, np = 21407), and smaller microglia in the occipital cortex (OC, np = 22365). Microglial circularity was higher in the APOECh case in all areas (np values for APOECh: FC = 18537, Hip = 14265, OC = 23845). P ≤ 0.001 ****. Two-sided Student’s test was used for analysis.
Extended Data Fig. 9
Extended Data Fig. 9. Klüver Barrera staining of the RELN-COLBOS case, the APOECh case, a representative PSEN1 E280A FAD case and a representative SAD case.
Klüver-Barrera staining using luxol fast blue staining for myelin and cresyl violet staining for neuronal perikaryal in selected brain regions. Code-colored lines, regions of interest for neuronal density measurements in Cornu Ammonis (CA) structures CA1, CA2, and CA3, together with the Dentate Gyrus, Subiculum, Presubiculum and Entorhinal cortex. Scale bar, 3 mm.
Extended Data Fig. 10
Extended Data Fig. 10. Analysis of the white matter signal in the RELN-COLBOS in comparisons to other AD cases.
a, Representative images for luxol fast blue (LFB) staining (large panel and small left panels) and RELN-CT (small right panel) of the sub hippocampal white matter of the RELN-COLBOS case, the APOECh case, a representative PSEN1 E280A FAD case and a representative SAD case. Scale bars, 50 𝜇m. b, Bar graph for normalized measurement of white matter relative to total LFB signal of the RELN-COLBOS case, the APOECh case, PSEN1 E280A FAD cases (n = 5) and SAD cases (n = 4). Both the RELN-COLBOS case and the APOECh case show relative higher white matter signal than the other FAD cases. c, Bar graph for the quantification of RELN-CT signal in round particles in the sub-hippocampal white matter of the RELN-COLBOS case, the APOECh case, PSEN1 E280A FAD cases (n = 5) and SAD cases (n = 4). The RELN-COLBOS case shows higher RELN-CT signal intensity than all FAD cases, including the APOECh one. d, Line graph for RELN-CT positive round particles signal intensity distribution in the RELN-COLBOS case, the APOECh case, PSEN1 E280A FAD cases (n = 5) and SAD cases (n = 4). The RELN-COLBOS case showed a larger percentage of particles with higher RELN-CT signal intensity when compared with the other AD cases. e, Scatter plot of Spearman’s Rho correlation analysis for LFB signal intensity and RELN-CT round particles signal intensity in all analyzed AD cases. A statistically significant positive correlation was identified (p = 0.003, R = 0.818).

Comment in

References

    1. Acosta-Baena N, et al. Pre-dementia clinical stages in presenilin 1 E280A familial early-onset Alzheimer’s disease: a retrospective cohort study. Lancet Neurol. 2011;10:213–220. doi: 10.1016/S1474-4422(10)70323-9. - DOI - PubMed
    1. Arboleda-Velasquez JF, et al. Resistance to autosomal dominant Alzheimer’s disease in an APOE3 Christchurch homozygote: a case report. Nat. Med. 2019;25:1680–1683. doi: 10.1038/s41591-019-0611-3. - DOI - PMC - PubMed
    1. Quiroz YT, et al. Association between amyloid and tau accumulation in young adults with autosomal dominant Alzheimer disease. JAMA Neurol. 2018;75:548–556. doi: 10.1001/jamaneurol.2017.4907. - DOI - PMC - PubMed
    1. Hiesberger T, et al. Direct binding of Reelin to VLDL receptor and ApoE receptor 2 induces tyrosine phosphorylation of disabled-1 and modulates tau phosphorylation. Neuron. 1999;24:481–489. doi: 10.1016/S0896-6273(00)80861-2. - DOI - PubMed
    1. Dunham I, et al. An integrated encyclopedia of DNA elements in the human genome. Nature. 2012;489:57–74. doi: 10.1038/nature11247. - DOI - PMC - PubMed

Publication types