. 2023 May 15;6(1):526.
doi: 10.1038/s42003-023-04884-1.

α-Synuclein fibril and synaptic vesicle interactions lead to vesicle destruction and increased lipid-associated fibril uptake into iPSC-derived neurons

Affiliations

α-Synuclein fibril and synaptic vesicle interactions lead to vesicle destruction and increased lipid-associated fibril uptake into iPSC-derived neurons

Amberley D Stephens et al. Commun Biol. .

Abstract

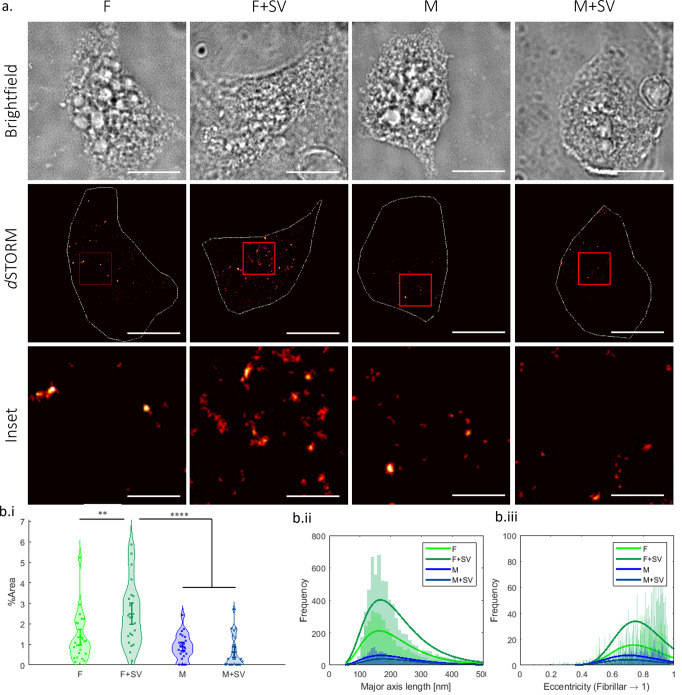
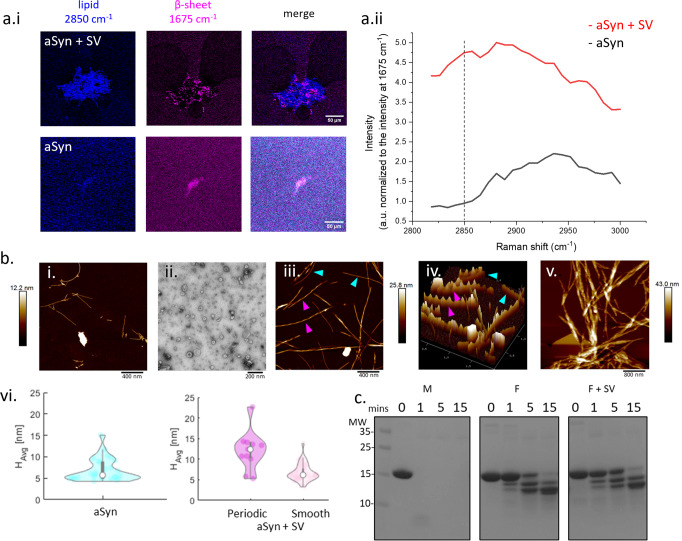
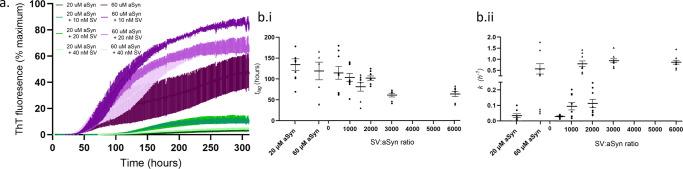
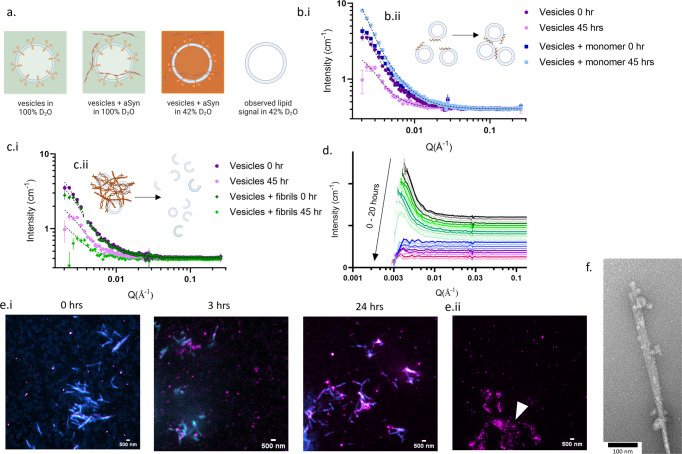
Monomeric alpha-synuclein (aSyn) is a well characterised protein that importantly binds to lipids. aSyn monomers assemble into amyloid fibrils which are localised to lipids and organelles in insoluble structures found in Parkinson's disease patient's brains. Previous work to address pathological aSyn-lipid interactions has focused on using synthetic lipid membranes, which lack the complexity of physiological lipid membranes. Here, we use physiological membranes in the form of synaptic vesicles (SV) isolated from rodent brain to demonstrate that lipid-associated aSyn fibrils are more easily taken up into iPSC-derived cortical i3Neurons. Lipid-associated aSyn fibril characterisation reveals that SV lipids are an integrated part of the fibrils and while their fibril morphology differs from aSyn fibrils alone, the core fibril structure remains the same, suggesting the lipids lead to the increase in fibril uptake. Furthermore, SV enhance the aggregation rate of aSyn, yet increasing the SV:aSyn ratio causes a reduction in aggregation propensity. We finally show that aSyn fibrils disintegrate SV, whereas aSyn monomers cause clustering of SV using small angle neutron scattering and high-resolution imaging. Disease burden on neurons may be impacted by an increased uptake of lipid-associated aSyn which could enhance stress and pathology, which in turn may have fatal consequences for neurons.


Conflict of interest statement

The authors declare no competing interests.

Figures

Fig. 1
Fig. 1. SV lipid-associated aSyn fibrils are more readily taken up into i3Neurons compared to aSyn only fibrils.
a 500 nM of 10% ATTO647N-labelled aSynC141 and 90% unlabelled WT aSyn as monomer (M) or fibrils (F) +/− SV were incubated with i3Neurons for 1 h before cells were washed, fixed and imaged. Shown are representative brightfield and fluorescence images of i3Neurons containing the different aSyn samples. The brightfield image was used as a reference point to define the edges of the cell soma for quantification of the soma area, highlighted by the white line in the dSTORM images. Scale bar for brightfield and dSTORM images = 10 μm. The insert highlighted by the red box in the dSTORM images shows representative taken up aSyn structures in the soma, scale bar = 2 μm. b.i The taken up aSyn was quantified by the area of fluorescence divided by the area of the soma and is displayed as % area. There was a greater % area of fluorescence in cells that were incubated with sonicated fibrils grown in the presence of SVs (F + SV) compared to fibrils alone (F). There was no significant difference between monomer alone (M) and monomer with SV (M + SV), but less was taken up than for fibrillar aSyn samples. Experiments were repeated three times. A total of 23 cells were analysed per sample, each cell is represented as a point on the graph. A one-way ANOVA with Holm-Šídák tests was performed, F vs F + SV **p < 0.005, F + SV vs M and F + SV vs M + SV ****p < 0.0001. b.ii The quantity and major axis length show that aSyn fibrils grown in the presence of SV have an average major axis length of 179.9 nm and were more readily taken up by i3Neurons compared to fibrils formed alone which had an average length of 182.3 nm (F + SV = 7334, F = 3695). In contrast, more monomeric aSyn alone (M = 1962) was taken up compared to monomeric aSyn and SV (M + SV = 1040) which had average lengths of 187.1 nm and 195.4 nm, respectively. b.iii The eccentricity analysis shows that the fibril samples are more fibrillar in shape compared to monomeric aSyn, F = 0.823, F + SV = 0.831, M = 0.798, M + SV = 0.791. Dye only, SV only and dye with SV were used as controls (Supplementary Fig. 3).
Fig. 2
Fig. 2. SV lipid-associated aSyn fibrils have a more periodic morphology than aSyn only fibrils, but do not form different fibril polymorphs.
a.i Lipid SRS signal at 2850 cm−1 (blue) and the amide 1 region signal of a β-sheet structure at 1675 cm−1 (pink), were acquired on top of the samples of aSyn fibrils grown with (aSyn + SV) and without SV (aSyn). Merging the signals at 2850 cm−1 and 1675 cm−1 reveals the lipid signal originating from the aSyn fibril cluster. a.ii Raman shift spectra of the aSyn and aSyn + SV samples show an increase in intensity of the lipid signal region for aSyn + SV compared to aSyn alone when normalised to the signal intensity at 1675 cm−1. b.i Representative AFM image of aSyn fibrils grown without SV displays fibrils with a smooth morphology. b.ii A representative TEM image of SV added to aSyn monomer prior to incubation. b.iii 2D AFM image of aSyn incubated with SV showing fibrils with smooth (blue arrows) and periodic (pink arrows) morphologies. b.iv 3D AFM image of iii. more clearly shows the difference in periodicity of the smooth and periodic fibrils. b.v AFM imaging shows that aSyn fibrils and SV, both incubated for a week, lead to fibrils with increased lateral bundling. b.vi Analysis of the AFM images reveals that only smooth fibrils, with a height profile of ~6.9 ± 2.6 nm (n = 13 images), grow in the absence of SV (blue). 20% of fibrils grown in the presence of SVs (pink) were periodic and had a peak height of ~12.1 ± 4.6 nm, while smooth fibrils (light pink), comprising 80% of the sample, were on average 6.7 ± 7.1 nm in height (n = 25 images). c aSyn monomer (M), fibrils (F) and fibrils grown in the presence of SV (F + SV) were incubated with proteinase K for 0, 1, 5, and 15 min and the digestion products were separated on an SDS-PAGE gel, which was subsequently stained with Coomassie blue. The digestion profiles reveal no differences between different aSyn structures formed. Molecular weight (MW) markers are shown in kDa.
Fig. 3
Fig. 3. aSyn aggregation increases in the presence of SV, but decreases as SV:aSyn ratio increases.
a Aggregation rates of aSyn were observed by an increase in ThT fluorescence intensity, displayed as % of the maximum ThT intensity. An increase in concentration from 20 μM aSyn (green) to 60 μM aSyn (purple) leads to an increase in aSyn aggregation rate, while adding SV leads to an increase in the aSyn aggregation rate for all SV concentrations (10 nM, 20 nM, 40 nM) compared to no SV. However, addition of 40 nM of SV reduced the aSyn aggregation rate compared to addition of 20 nM and 10 nM SV. 60 μM ThT was added to each protein solution in a half area 96-well plate with orbital agitation at 200 rpm for 5 min before each read every hour for 310 h. Data represent 9 wells from 3 experimental repeats. b.i The aSyn nucleation rate, observed by the time to form fibrils, lag time (tlag), was calculated and plotted against the ratio of SV to aSyn in nM concentrations. b.ii The aSyn elongation rate is determined by the slope (k) of the exponential phase plotted against the ratio of SV to aSyn in nM concentrations. Circles represent 20 μM aSyn, triangles represent 60 μM aSyn and error bars represent SEM.
Fig. 4
Fig. 4. SV cluster in the presence of aSyn monomer, but degrade in the presence of aSyn fibrils.
a Schematic to represent SV proteins (orange) and lipids (blue) when in 100% D2O (green) and in the presence of preformed aSyn fibrils (orange), compared to in 42% D2O and 58% H2O (orange) allowing contrast matching of the protein, i.e. making all proteins ‘invisible’ to only observe the lipid bilayer of the SV. b.i SANS data of 1.5 mg/mL SV + 62 μM aSyn monomer (blue) compared to SV only (purple) at 0 h and 45 h, show an increase in signal intensity for SV + monomer from 0 h (darker colour) to 45 h (lighter colour). b.ii Schematic to indicate aSyn (brown) bound to SV (blue) leading to clustering of the SVs. c.i SANS data of 1.5 mg/mL SV only (purple) and with 50 μM preformed aSyn fibrils (green) show a decrease in signal intensity for SV + fibrils after 45 h. c.ii Schematic to indicate SV (blue) associating to preformed aSyn fibrils (brown) lead to the disintegration of the lipid bilayer of SV. In b.i and c.i, dashed lines show Guinier-Porod fitting and error bars represent s.d. (data for individual fits shown in Supplementary Fig. 5). d The signal intensity of neutron scattering from the lipid bilayer in the presence of aSyn fibrils over 20 h shows the loss of signal after 11 h (grey-green), no clear signal can be observed from 12–20 h (blue-pink), each line represents data collected each hour, data have been offset for clarity. Data for each condition were acquired once. e.i SV (0.5 mg/mL) were incubated with 5 μM preformed aSyn fibrils of 90% WT aSyn and 10% aSynC141:AF594 (cyan) and incubated at 37 °C for 0, 3, and 24 h. SV were stained with a lipid intercalating dye, mCLING:ATTO647N (1:100) (magenta). e.ii The mCLING fluorescence was less punctate and more spread over fibrils (indicated by white arrows) compared to the punctate mCLING signal in SV not associated to fibrils) (see Supplementary Fig. 6 for more images). f TEM image shows small blebs adhering to the fibril, indicating rupture and disintegration of the SV when associated with fibrils. Figure a, b.ii, c.ii made with Biorender.com.

References

    1. Mahul-Mellier A-L, et al. The process of Lewy body formation, rather than simply α-synuclein fibrillization, is one of the major drivers of neurodegeneration. Proc. Natl Acad. Sci. USA. 2020;117:4971–4982. doi: 10.1073/pnas.1913904117. - DOI - PMC - PubMed
    1. Lautenschläger J, et al. C-terminal calcium binding of α-synuclein modulates synaptic vesicle interaction. Nat. Commun. 2018;9:712. doi: 10.1038/s41467-018-03111-4. - DOI - PMC - PubMed
    1. Davidson WS, Jonas A, Clayton DF, George JM. Stabilization of alpha-synuclein secondary structure upon binding to synthetic membranes. J. Biol. Chem. 1998;273:9443–9449. doi: 10.1074/jbc.273.16.9443. - DOI - PubMed
    1. Middleton ER, Rhoades E. Effects of curvature and composition on α-synuclein binding to lipid vesicles. Biophys. J. 2010;99:2279–2288. doi: 10.1016/j.bpj.2010.07.056. - DOI - PMC - PubMed
    1. Diao J, et al. Native α-synuclein induces clustering of synaptic-vesicle mimics via binding to phospholipids and synaptobrevin-2/VAMP2. Elife. 2013;2:e00592. doi: 10.7554/eLife.00592. - DOI - PMC - PubMed

Publication types