. 2023 May;5(5):821-841.
doi: 10.1038/s42255-023-00803-0. Epub 2023 May 15.

SIRT2 regulates extracellular vesicle-mediated liver-bone communication

Affiliations

SIRT2 regulates extracellular vesicle-mediated liver-bone communication

Longshuai Lin et al. Nat Metab. 2023 May.

Abstract

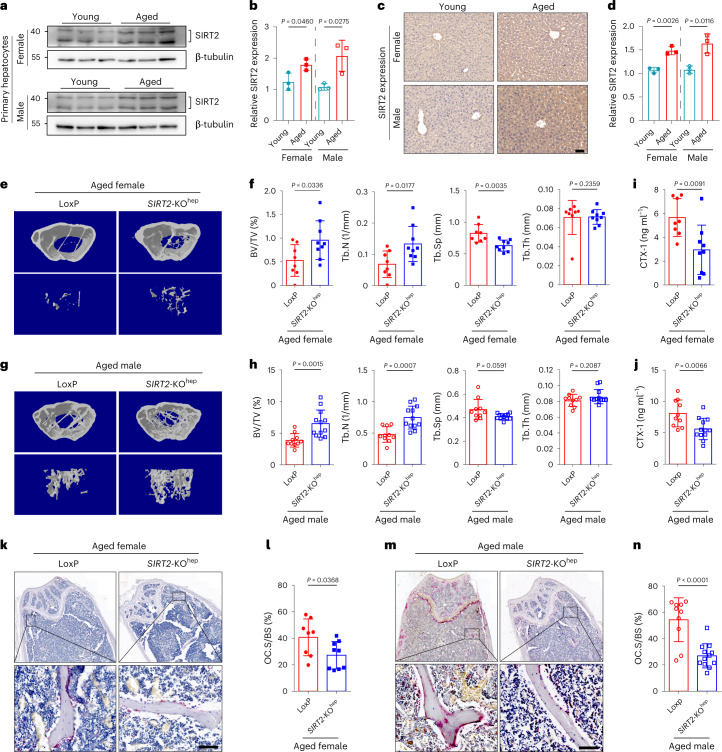
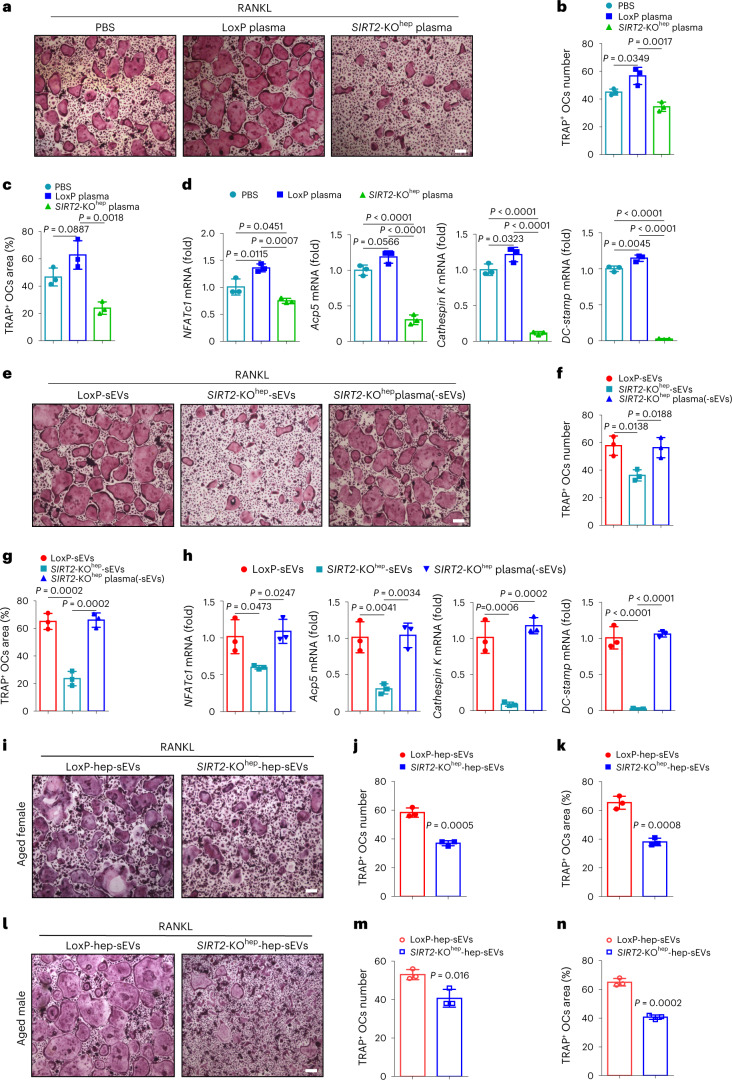
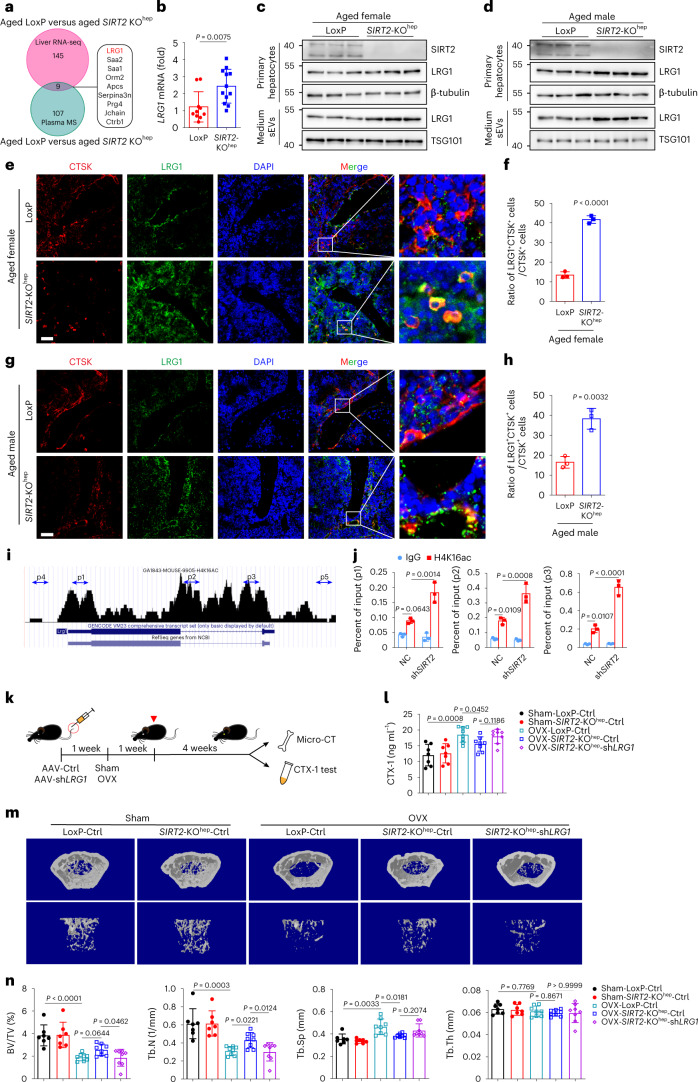
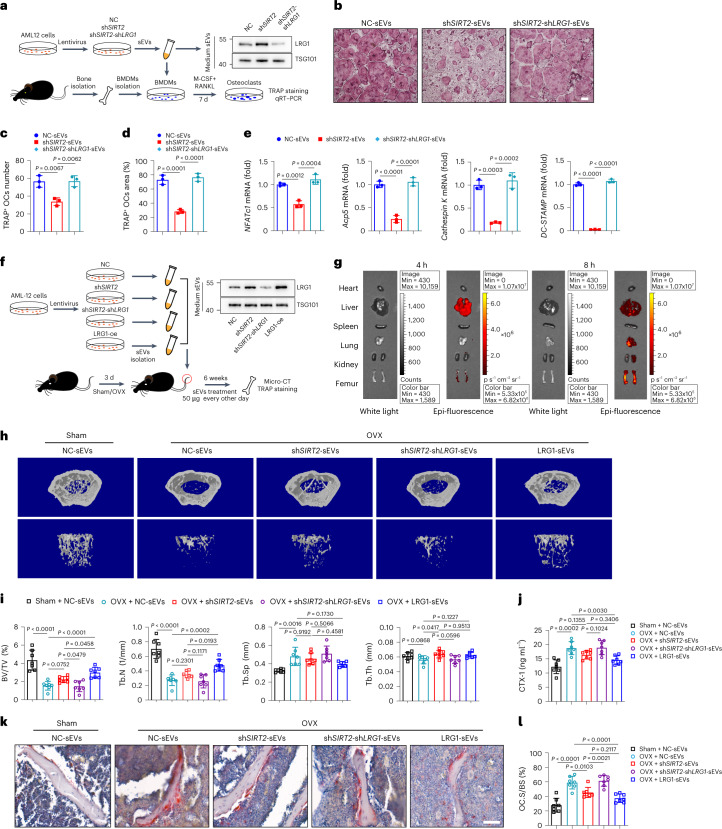
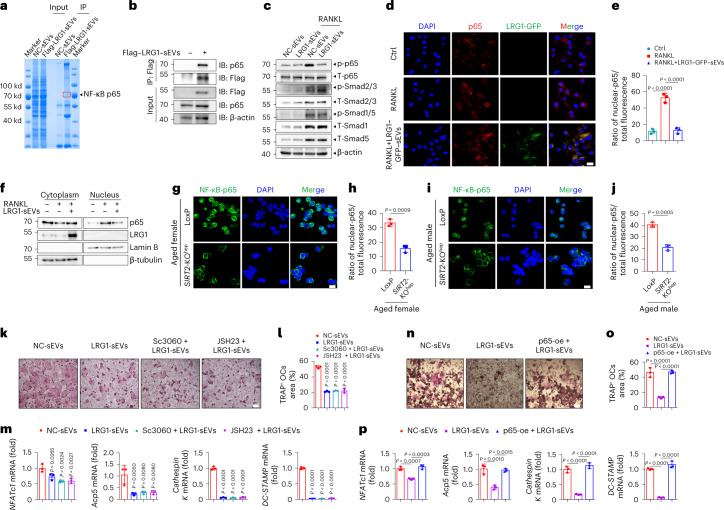
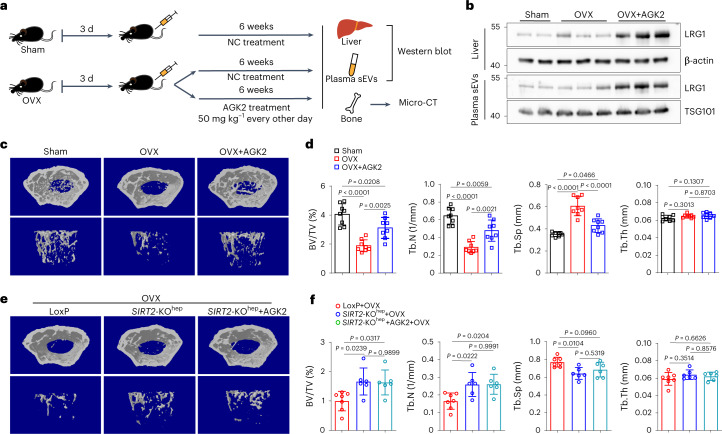
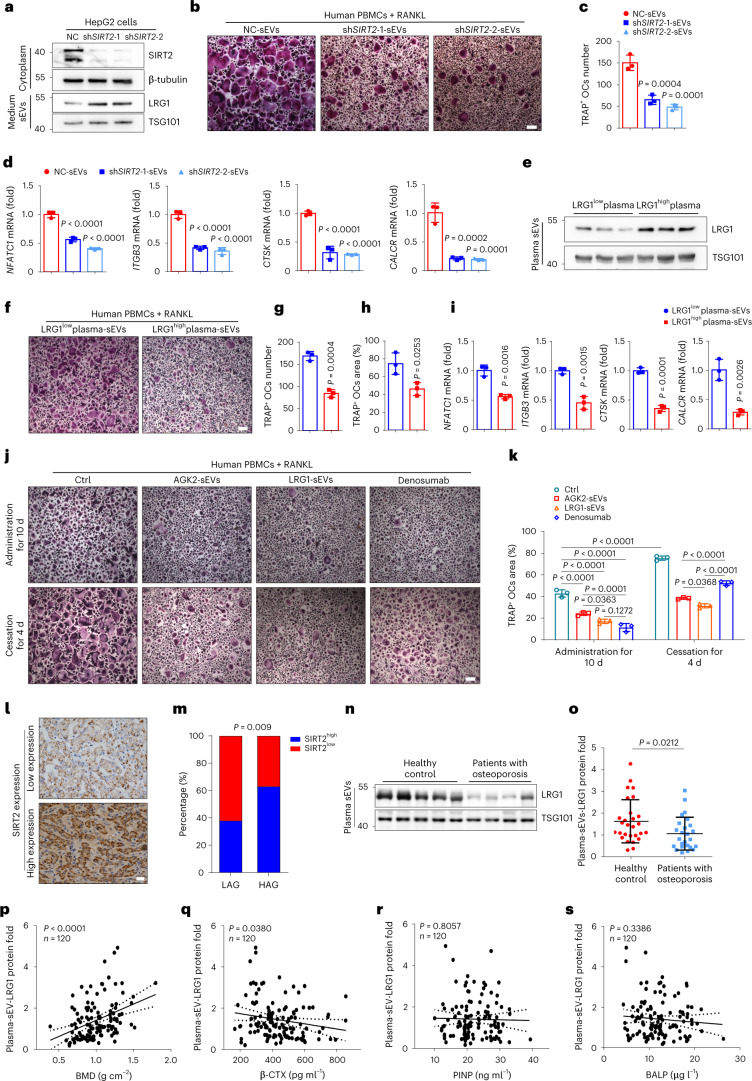
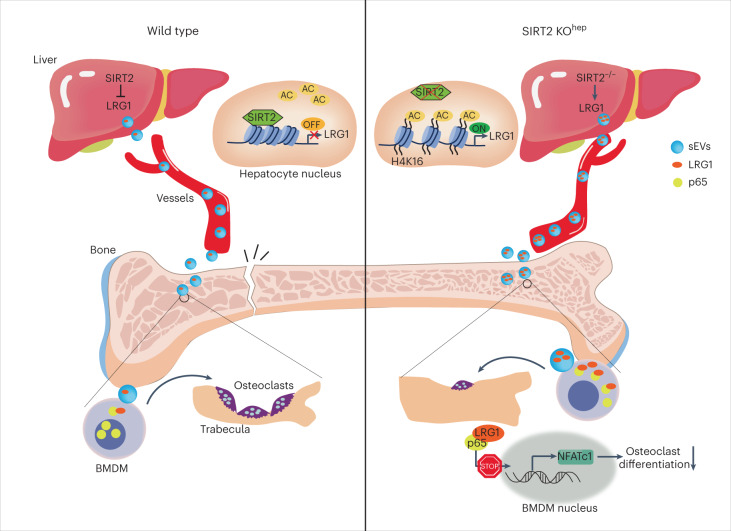
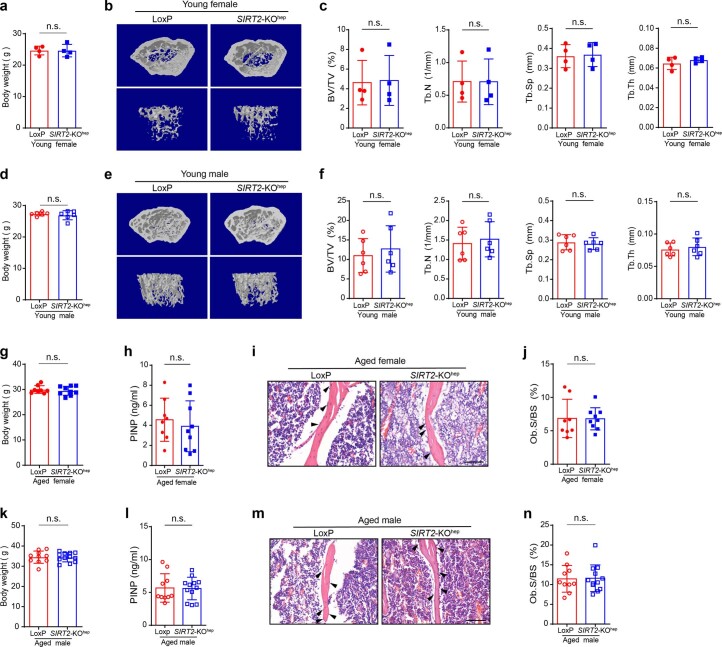
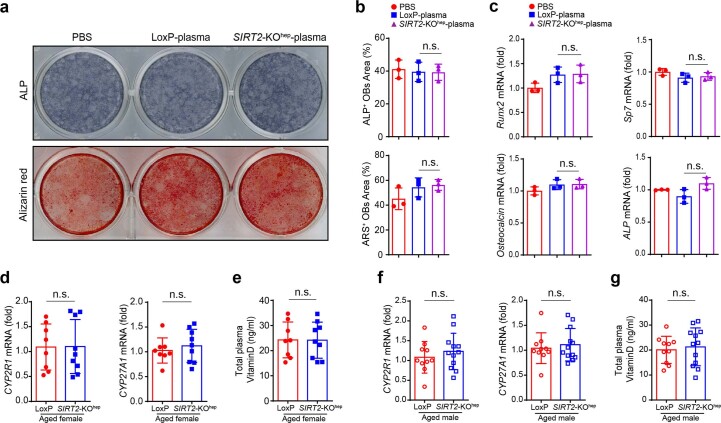
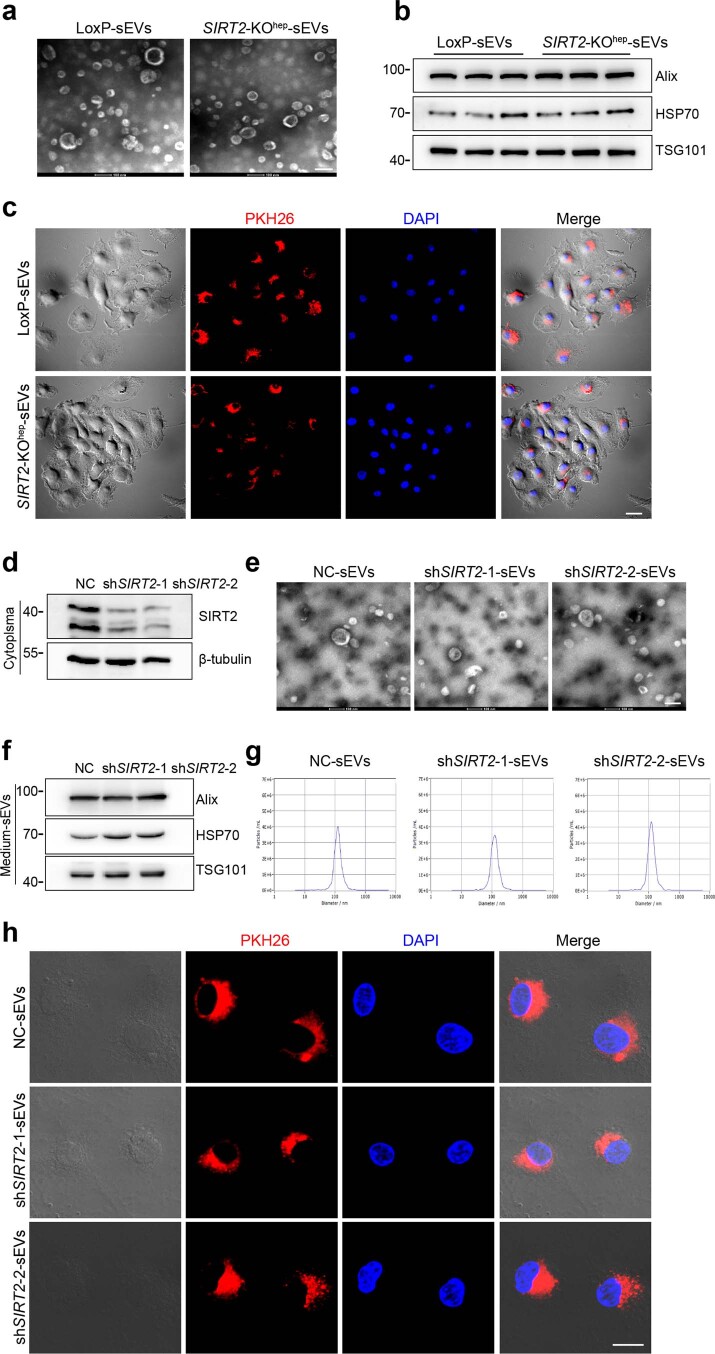
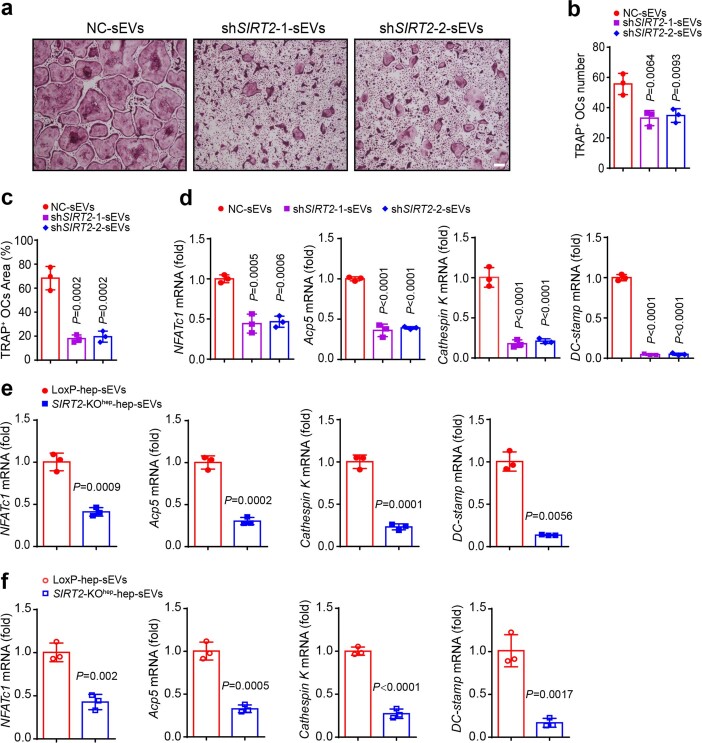
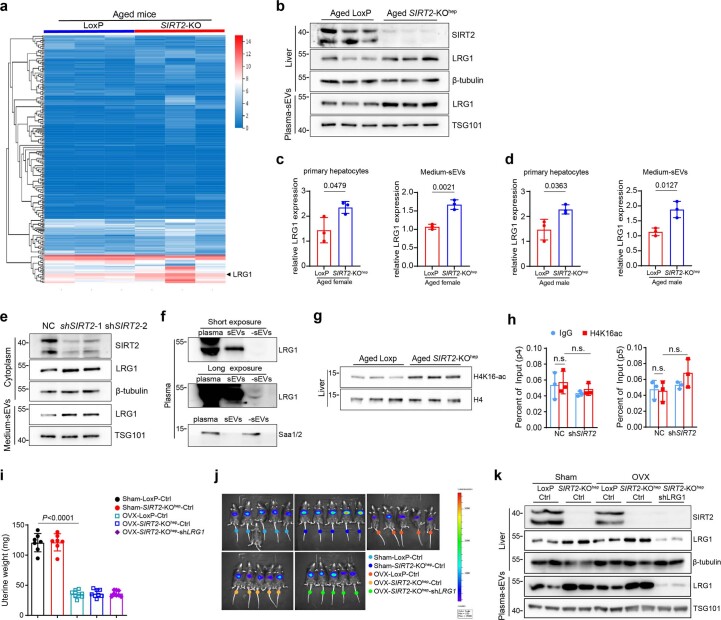
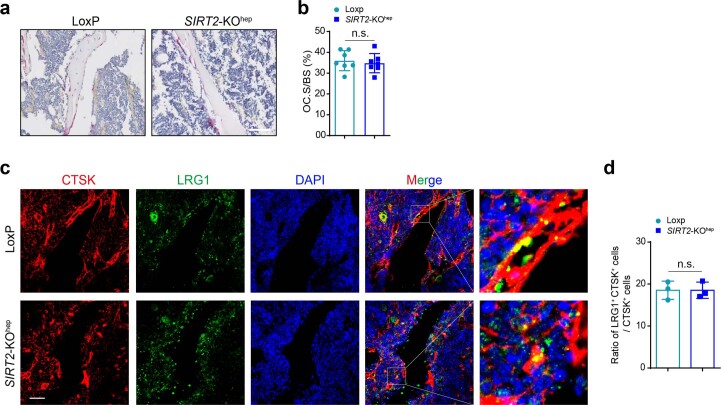
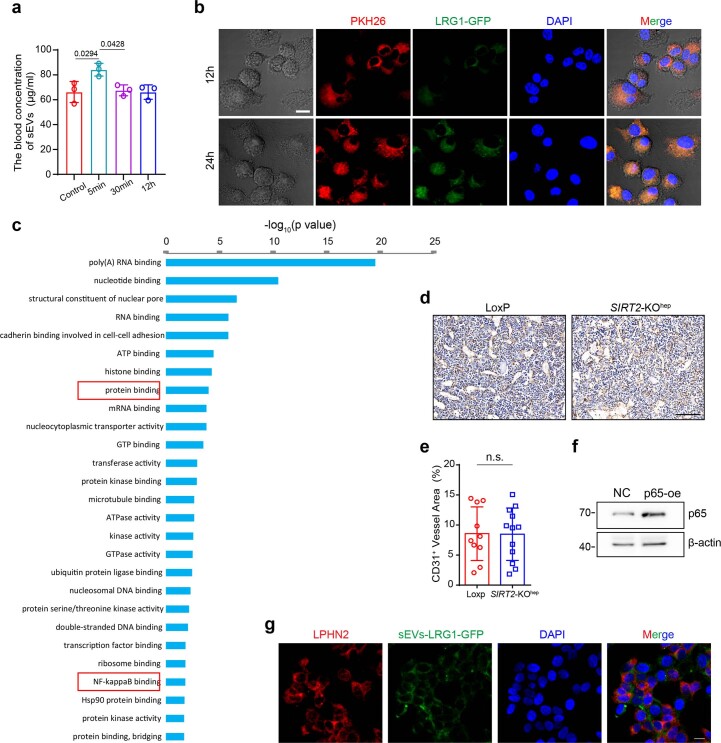
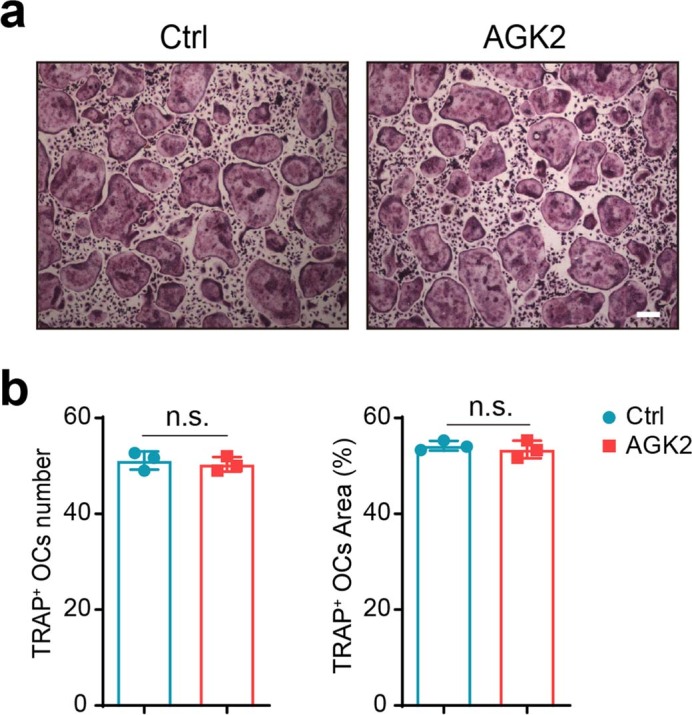
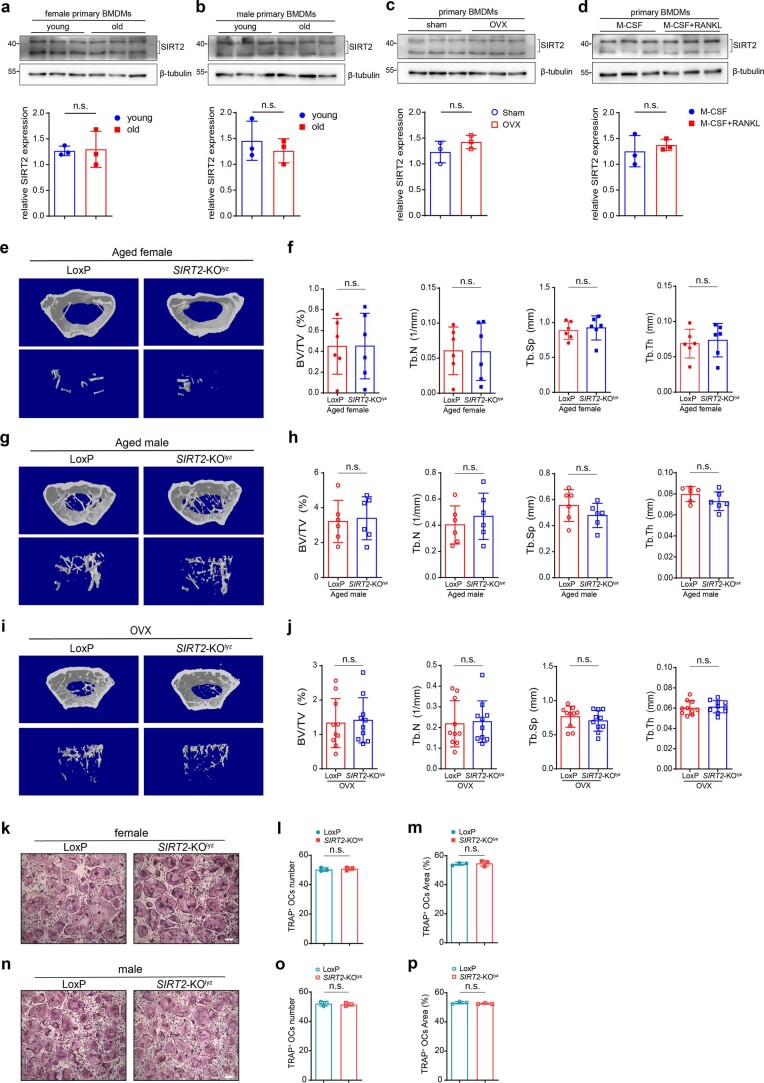
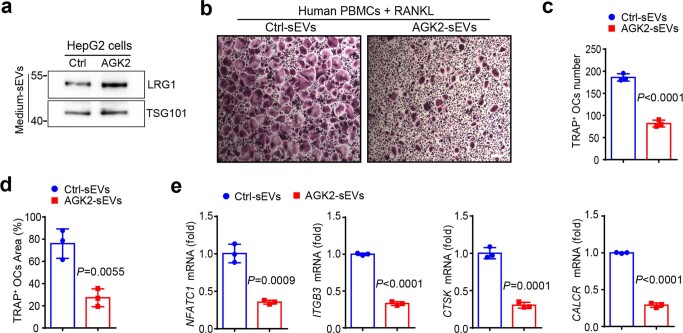
The interplay between liver and bone metabolism remains largely uncharacterized. Here, we uncover a mechanism of liver-bone crosstalk regulated by hepatocyte SIRT2. We demonstrate that hepatocyte SIRT2 expression is increased in aged mice and elderly humans. Liver-specific SIRT2 deficiency inhibits osteoclastogenesis and alleviates bone loss in mouse models of osteoporosis. We identify leucine-rich α-2-glycoprotein 1 (LRG1) as a functional cargo in hepatocyte-derived small extracellular vesicles (sEVs). In SIRT2-deficient hepatocytes, LRG1 levels in sEVs are upregulated, leading to increased transfer of LRG1 to bone-marrow-derived monocytes (BMDMs), and in turn, to inhibition of osteoclast differentiation via reduced nuclear translocation of NF-κB p65. Treatment with sEVs carrying high levels of LRG1 inhibits osteoclast differentiation in human BMDMs and in mice with osteoporosis, resulting in attenuated bone loss in mice. Furthermore, the plasma level of sEVs carrying LRG1 is positively correlated with bone mineral density in humans. Thus, drugs targeting hepatocyte-osteoclast communication may constitute a promising therapeutic strategy for primary osteoporosis.


Conflict of interest statement

The authors declare no competing interests.

Figures

Fig. 1
Fig. 1. Hepatocyte-specific SIRT2 knockout prevents age-related bone loss with less-active osteoclastogenesis.
a, Western blot analysis of SIRT2 protein expression in primary hepatocytes of aged female and male mice; n = 3 mice, two technical replicates of three biological replicates for each group and results from one experiment are shown. b, Western blot density analyzed by ImageJ and quantification analysis was shown (young mice, 3 months of age, n = 3 and aged mice, 18 months of age, n = 3,). c, Represented IHC images of SIRT2 protein expression in liver tissues from young and aged mice (scale bar, 50 µm); n = 3 mice, one technical replicate of three biological replicates for each group. d, SIRT2 protein expression intensity analyzed by ImageJ and quantification analysis was shown (young mice, 3 months of age, n = 3 and aged mice, 18 months of age, n = 3,). e,f, Represented images of 3D restoration and quantification of trabecular BV/TV, Tb.N, Tb.Sp and Tb.Th of distal femurs of aged female LoxP and SIRT2-KOhep mice (18 months of age), as measured by μ-CT (n = 8, LoxP mice and n = 9, SIRT2-KOhep mice). g,h, Represented images of 3D restoration and quantification of trabecular BV/TV, Tb.N, Tb.Sp and Tb.Th of distal femurs of aged male LoxP and SIRT2-KOhep mice (18 months of age), as measured by μ-CT (n = 10, LoxP mice and n = 12, SIRT2-KOhep mice). i,j, Plasma CTX-1 in aged female and male LoxP and SIRT2-KOhep mice was detected by ELISA. k,m, TRAP staining on paraffin-embedded femur sections in aged female and male LoxP and SIRT2-KOhep mice (scale bar, 100 µm). l,n, Quantification of osteoclast surface/bone surface ratios (Oc.S/BS) is shown on the right. (e,f,i,k,l shows one technical replicate of eight (LoxP mice) or nine (SIRT2-KOhep mice) biological replicates for each group. g,h,j,m,n, one technical replicate of 10 (LoxP mice) or 12 (SIRT2-KOhep mice) biological replicates for each group). Data are presented as mean ± s.d., with biologically individual data points shown. P values were determined by unpaired two-tailed Mann–Whitney U-test (Tb.Th group of f and Tb.Sp group of h), unpaired two-tailed Student’s t-test with Welch’s correction (BV/TV group of h) or unpaired two-tailed Student’s t-test (others). Source data
Fig. 2
Fig. 2. Aged SIRT2−/− hepatocyte-derived sEVs inhibit osteoclastogenesis.
BMDMs were isolated and cultured with murine M-CSF and RANKL stimulation for 7 d to generate osteoclasts, combined with the corresponding treatments. a, Representative TRAP staining images of osteoclasts administered with the plasma (100 µl) of aged LoxP or SIRT2-KOhep male mice (LoxP plasma or SIRT2-KOhep plasma) (scale bar, 200 µm). b,c, Number and area of multi-nucleated TRAP+ cells with indicated treatment were measured. OC, osteoclast. d, Osteoclast-specific genes NFATc1, Acp5, cathespin K and DC-STAMP mRNA levels in LoxP-plasma- or SIRT2-KOhep-plasma-treated osteoclasts were measured by real-time PCR; n = 3 biologically independent experiments (ad). e, Representative TRAP staining images of osteoclasts treated with sEVs (derived from 100 µl plasma) derived from LoxP plasma or SIRT2-KOhep plasma (LoxP-sEVs or SIRT2-KOhep-sEVs), as well as with SIRT2-KOhep-plasma-depleted sEVs (SIRT2-KOhep-plasma(-sEVs), 100 µl) (scale bar, 200 µm). f,g, Number and area of multi-nucleated TRAP+ cells with indicated treatment were measured. h, The mRNA expression of osteoclast-specific genes in the corresponding treated osteoclasts was measured by real-time PCR; n = 3 biologically independent experiments (eh). i,l, Representative TRAP staining images of osteoclasts treated with sEVs (4 µg ml−1) derived from the medium of the primary hepatocytes of aged female (i) and male (l) LoxP mice or SIRT2-KOhep mice (LoxP-hep-sEVs or SIRT2-KOhep-hep-sEVs) (scale bar, 200 µm). j,k,m,n, Number and area of multi-nucleated TRAP+ cells of female (j,k) and male (m,n) mice with indicated treatment were measured, respectively; n = 3 biologically independent experiments (in). Data are presented as mean ± s.d., with biologically individual data points shown. P values were determined by one-way analysis of variance (ANOVA) followed by Tukey’s test (bd,fh) and an unpaired two-tailed Student’s t-test (j,k,m,n). Source data
Fig. 3
Fig. 3. SIRT2-KOhep prevents OVX-induced bone loss through upregulating LRG1 expression in hepatocytes.
a, Venn diagram showing the overlap numbers of SIRT2-KOhep-regulated plasma proteins by mass spectra (MS) and SIRT2-KOhep-regulated hepatic mRNAs by RNA-seq in aged mice (18 months of age). b, LRG1 mRNA expression in the livers of aged LoxP and SIRT2-KOhep mice measured by real-time PCR. One technical replicate of 10 (LoxP mice) or 12 (SIRT2-KOhep mice) biological replicates for each group. c,d, Western blot analysis of LRG1 protein expression in the primary hepatocytes and supernatant-derived sEVs of aged female (c) and male (d) LoxP and SIRT2-KOhep mice; n = 3 mice, one technical replicate of three biological replicates for each group. e,g, Represented in situ immunofluorescence images of murine femurs in aged female (e) and male (g) LoxP and SIRT2-KOhep mice (18 months of age) (scale bar, 50 µm). DAPI, 4,6-diamidino-2-phenylindole. f,h, Quantitation of ratio of LRG1 and CTSK double-positive area to CTSK-positive area on bone sections of the aged female (f) or male (h) LoxP (n = 3) and SIRT2-KOhep (n = 3) mice, was measured by ImageJ. (eh, one technical replicate of three biological replicates for each group). i, Schematic view of enrichment of H4K16ac on LRG1 promoter region from ChIP-seq data from Cistrome DB Toolkit. j, ChIP analysis showing enrichment of H4K16ac at the LRG1 proximal promoter region in NC and shSIRT2-AML12 hepatocytes using the primers p1, p2 and p3; n = 3 biologically independent experiments. k, The experimental procedure for hepatocyte-specific LRG1 knockdown by AAV8 virus. LoxP and SIRT2-KOhep mice (12 weeks of age) were given tail injections of 2 × 1011 viral particles of either AAV8-shLRG1 or Ctrl vector 7 d before OVX to maximize the viral expression and knockdown efficiency. The real-time observation of gene expression was performed by BLI 14 d after viral injection. Mice were killed 5 weeks after OVX for CTX-1 and bone mass test. l, Plasma CTX-1 was detected by ELISA. m,n, Represented images of 3D restoration and quantification of trabecular BV/TV, Tb.N, Tb.Sp and Tb.Th of distal femurs of the indicated group mice, as measured by μ-CT (n = 7, Sham-LoxP-Ctrl mice; n = 7, Sham-SIRT2-KOhep-Ctrl mice; n = 8, OVX-LoxP-Ctrl mice; n = 8, OVX-SIRT2-KOhep-Ctrl mice and n = 8, OVX-SIRT2-KOhep-shLRG1 mice). (ln, one technical replicate of seven (Sham-LoxP-Ctrl mice); seven (Sham-SIRT2-KOhep-Ctrl mice); eight (OVX-LoxP-Ctrl mice); eight (OVX-SIRT2-KOhep-Ctrl mice) and eight (OVX-SIRT2-KOhep-shLRG1 mice) biological replicates for each group). Data are presented as mean ± s.d., with biologically individual data points shown. P values were determined by unpaired two-tailed Student’s t-test (b,f,h), one-way ANOVA followed by Tukey’s test (l,n) and two-way ANOVA followed by Tukey’s test (j). Source data
Fig. 4
Fig. 4. Hepatocyte-derived sEV-LRG1 mediates the protection of SIRT2-KOhep against osteoclastogenesis and bone loss.
a, Schema of BMDM treatment with sEVs. The sEVs were purified from the supernatant of shSIRT2-AML12 cells infected with Ctrl or shLRG1 lentiviral vectors. sEV-LRG1 protein expression was analyzed by western blot. The isolated primary BMDMs were co-cultured with each set of transduced sEVs (4 µg ml−1) and murine M-CSF/RANKL stimulation for 7 d to generate osteoclasts and followed TRAP staining and real-time PCR test. b, TRAP staining of osteoclasts treated with NC-sEVs or shSIRT2-sEVs or shSIRT2-shLRG1-sEVs (scale bar, 200 µm). c,d, Number and area of multi-nucleated TRAP+ cells with indicated treatment were measured. e, The mRNA expression of osteoclast-specific genes in the corresponding treated osteoclasts was measured by real-time PCR. (be, n = 3 biologically independent experiments). f, The experimental procedure for sEVs treatment in vivo. C57BL/6J mice were consecutively intravenously injected with the NC-sEVs, shSIRT2-sEVs, shSIRT2-shLRG1-sEVs and LRG1-sEVs (50 µg per mouse, every other day) 3 d after OVX. Micro-CT and TRAP staining were performed 6 weeks after the first injection. g, Representative biophotonic images of the tissue distribution of fluorescence signal in mice at 4 and 8 h after intravenous injection of PKH26-labeled sEVs isolated from the supernatant of AML12 cells. h,i, Represented images of 3D restoration (h) and quantification of trabecular BV/TV, Tb.N, Tb.Sp and Tb.Th of distal femurs of the indicated group mice (i), as measured by μ-CT (n = 7, sham + NC-sEVs; n = 7, OVX + NC-sEVs; n = 7, OVX + shSIRT2-sEVs; n = 7, OVX + shSIRT2-shLRG1-sEVs and n = 7, OVX + LRG1-sEVs). j, Plasma CTX-1 in each group was detected by ELISA. k, TRAP staining on paraffin-embedded femur sections in each group after corresponding sEV treatment (scale bar, 100 µm). l, Quantification of Oc.S/BS is shown on the right; (hl, one technical replicate of seven biological replicates for each group). Data are presented as mean ± s.d., with biologically individual data points shown. P values were determined by one-way ANOVA followed by Tukey’s test (ce,i,j,l). Source data
Fig. 5
Fig. 5. Hepatocyte-derived sEV-LRG1 inhibits osteoclastogenesis by repressing RANKL-induced NF-κB p65 nuclear translocation.
a, Western blot (IB) of the hepatocyte-derived sEV-LRG1 binding proteins identified by IP assays in BMDMs, followed by LC–MS. b, Endogenous sEV-LRG1-NF-κB p65 interaction was analyzed by the amount of NF-κB p65 co-immunoprecipitated with sEVs–Flag–LRG1 (4 µg ml−1) in primary BMDMs. Representative from two independent biological experiments. c, Western blot analysis of phosphorylation of p65 and the activities of TGF-β signaling in osteoclasts treated with LRG1-sEVs (4 µg ml−1). Representative result from two independent biological experiments. d,e, Immunofluorescence analysis of p65 (red) location in RANKL-induced BMDMs treated with LRG1–GFP–sEVs (4 µg ml−1) (green) (scale bar, 20 µm) and quantitation of ratio of nuclear p65 to total p65 was measured by ImageJ. Representative result from three independent biological experiments. f, BMDMs were treated with RANKL or LRG1-sEVs (4 µg ml−1) for 24 h followed by nucleocytoplasmic separation analysis with western blot. Lamin B and β-tubulin served as internal controls for the nucleus and cytoplasm, respectively. Representative results from two independent biological experiments. g,i, Represented immunofluorescence images of primary BMDMs isolated from aged female (g) or male (i) LoxP (n = 3, 18 months of age) and SIRT2-KOhep mice (n = 3, 18 months of age) (scale bar, 20 µm). h,j, Quantitation of ratio of nuclear p65 to total p65 in BMDMs of female (h) or male (j) LoxP and SIRT2-KOhep mice was measured by ImageJ. (gj, one technical replicate of three biological replicates for each group). k, TRAP staining of osteoclasts treated with LRG1-sEVs (4 µg ml−1) and the inhibitors of p65 nuclear translocation, Sc-3060 (10 µM) and JSH-23 (6 µM) (scale bar, 200 µm). l, Quantitation of the area of multi-nucleated TRAP+ cells with indicated treatment. m, The mRNA expression of osteoclast-specific genes in each group osteoclast was measured by real-time PCR. (km, n = 3 biologically independent experiments). n, TRAP staining of RAW 264.7 cells overexpressing p65 and treated with LRG1-sEVs (4 µg ml−1) (scale bar, 200 µm). o, Quantitation of the area of multi-nucleated TRAP+ cells with indicated treatment. p, The mRNA expression of osteoclast-specific genes in each indicated osteoclast group was measured by real-time PCR. (np, n = 3 biologically independent experiments). Data are presented as mean ± s.d., with biologically individual data points shown. P values were determined by unpaired two-tailed Student’s t-test (h,j) and one-way ANOVA followed by Tukey’s test (e,l,m,o,p). Source data
Fig. 6
Fig. 6. SIRT2 inhibitor AGK2 significantly suppresses OVX-induced bone loss in vivo.
a, The experimental procedure for AGK2 treatment on OVX mouse model. b, Western blot analysis of LRG1 protein expression in the livers and plasma sEVs of OVX C57BL/6J mice treated with AGK2. (Two technical replicates of two (sham mice), three (OVX mice) and three (OVX + AGK2 mice) biological replicates for each group). c,d, Represented images of 3D restoration and quantification of trabecular BV/TV, Tb.N, Tb.Sp and Tb.Th of distal femurs of OVX C57BL/6J mice after 6 weeks of intraperitoneal injection of AGK2 (50 mg kg−1, every other day), as measured by μ-CT (n = 8, sham mice; n = 8, OVX mice; n = 8, OVX + AGK2 mice). (c,d, one technical replicate of eight biological replicates for each group). e,f, Micro-CT analysis of 3D restoration and quantification of trabecular BV/TV, Tb.N, Tb.Sp and Tb.Th of distal femurs of OVX-SIRT2-KOhep mice after 6 weeks of treatment of AGK2 (n = 7, LoxP + OVX mice; n = 6, SIRT2-KOhep + OVX mice and n = 6, SIRT2-KOhep + OVX + AGK2 mice). (e,f. one technical replicate of seven (LoxP + OVX mice), six (SIRT2-KOhep + OVX mice) and six (SIRT2-KOhep + OVX + AGK2 mice) biological replicates for each group). Data are presented as mean ± s.d., with biologically individual data points shown. P values were determined by one-way ANOVA followed by Tukey’s test (d,f). Source data
Fig. 7
Fig. 7. Hepatocyte-derived shSIRT2-sEVs or human LRG1high plasma sEVs inhibit human osteoclast differentiation and plasma sEV-LRG1 inversely correlates with bone resorption in patients.
a, Western blot analysis of LRG1 protein expression in the cytoplasm and sEVs derived from SIRT2-knockdown (shSIRT2) HepG2 human hepatocytes. b, Representative TRAP staining images of human PBMCs cultured with RANKL and sEVs (10 µg ml−1) derived from the supernatant of control and shSIRT2-HepG2 cells (NC-sEVs, shSIRT2-1-sEVs, shSIRT2-2-sEVs) (scale bars, 200 µm). c, Number of multi-nucleated TRAP+ cells with indicated treatment was measured. d, The mRNA expression of osteoclast-specific genes in the corresponding treated osteoclasts was measured by real-time PCR. (ad, n = 3 biologically independent experiments). e, Western blot analysis of LRG1 protein expression in sEVs derived from LRG1-high- or low-expression plasma. f, Representative TRAP staining images of human PBMCs cultured with RANKL and sEVs (20 µg ml−1) derived from three LRG1-high-expression human plasma or three LRG1-low-expression human plasma (LRG1low plasma sEVs, LRG1high plasma sEVs) (scale bars, 200 µm). g,h, Number and area of multi-nucleated TRAP+ cells. i,The mRNA expression of osteoclast-specific genes measured by real-time PCR. (ei, n = 3 biologically independent experiments). j, The inhibitory effect of sEVs and denosumab on osteoclast differentiation and the rebound effect after cessation of treatments. Representative TRAP staining images of PBMCs cultured with RANKL and sEV-LRG1 (10 µg ml−1) or denosumab (500 ng ml−1) (scale bars, 200 µm). The inhibitory experiments were performed by the administration of RANKL and sEVs or the commercial denosumab. After 10 d of treatment, half of PBMCs were stained by TRAP (top). At the same time, for the other half of PBMCs, both sEVs and denosumab administration were stopped, but PBMCs continued to be treated with RANKL for 4 d (bottom). k, Area of multi-nucleated TRAP+ cells with indicated treatment was measured. (jk, n = 3 biologically independent experiments). l,m, The presented IHC images of SIRT2 expression levels in human liver tissues and association between SIRT2 expression levels and different ages are shown. LAG, low age groups (age <51 years, n = 54); HAG, high age groups (age >51 years, n = 60). n, Representative western blot analysis of protein expression of plasma sEV-LRG1 from female healthy control (BMD T score of lumbar spine is >−1, n = 28) and patients with osteoporosis (BMD T score of lumbar spine <−2.5, n = 25). o, Plots of protein expression of plasma sEV-LRG1 in female healthy control (n = 28) and osteoporotic patient group (n = 25). Association between human plasma sEV-LRG1 expression and BMD (p), bone resorption marker β-CTX (q) and bone formation markers PINP (r) and BALP (s) in 120 human participants of both sexes (females, n = 84 and males, n = 36). Data are presented as mean ± s.d., with biologically individual data points shown. P values were determined by one-way ANOVA followed by Tukey’s test (c,d), unpaired two-tailed Student’s t-test (gi), unpaired two-tailed Mann–Whitney U-test (o), two-way ANOVA followed by Tukey’s test (k), two-tailed Spearman’s correlation test (m) and linear correlation and regression analyses (ps). Source data
Fig. 8
Fig. 8. A working model of the hepatic SIRT2-regulated liver–bone communication.
The upregulation of hepatocyte SIRT2 involved in aging-associated NF-κB p65 activation and osteoclastogenesis through sEV-LRG1. Upregulated LRG1 protein in SIRT2−/− hepatocytes transferred into osteoclasts through sEVs acts as a brake on pro-osteoclastic activity to maintain aged and postmenopausal bone homeostasis. The inter-organ action of the SIRT2–sEV-LRG1–NF-κB–NFATc1 axis may be a promising therapeutic target in primary osteoporosis.
Extended Data Fig. 1
Extended Data Fig. 1. Young SIRT2-KOhep mice have normal body weight, bone mass and aged SIRT2-KOhep mice have normal body weight and osteoblastogenesis.
Young LoxP and SIRT2-KOhep mice in both sexes were compared (3 months of age). a, Body weight of the young female LoxP (n = 4) and SIRT2-KOhep (n = 4) mice. b,c, Represented images of 3D restoration and quantification of trabecular BV/TV, Tb.N., Tb.Sp. and Tb.Th. of distal femur of the young female LoxP (n = 4) and SIRT2-KOhep (n = 4) mice, as measured by micro-CT.(a-c. one technical replicate of 4 biological replicates for each group). d, Body weight of the young male LoxP (n = 6) and SIRT2-KOhep (n = 6) mice. e,f, Represented images of 3D restoration and quantification of trabecular BV/TV, Tb.N., Tb.Sp. and Tb.Th. of distal femur of the young male LoxP (n = 6) and SIRT2-KOhep (n = 6) mice, as measured by micro-CT.(d-f, one technical replicate of 6 biological replicates for each group). Aged LoxP and SIRT2-KOhep mice in both sexes were compared (18 months of age). g, Body weight of the aged female LoxP (n = 8) and SIRT2-KOhep (n = 9) mice. h, PINP in aged female LoxP (n = 8) and SIRT2-KOhep (n = 9) mice were detected by ELISA. k, Body weight of the aged male LoxP (n = 10) and SIRT2-KOhep (n = 12) mice. l, PINP in aged male LoxP (n = 10) and SIRT2-KOhep (n = 12) mice. i, m, H&E staining on paraffin-embedded femur sections in aged female and male LoxP and SIRT2-KOhep mice (scale bar, 100 µm; black arrowheads point to osteoblasts). j, n, Quantification of osteoblast surface/bone surface ratios (Ob.S/BS) are shown on the right (j, aged female LoxP mice, n = 8 and aged female SIRT2-KOhepmice,n = 9;n, aged male LoxP mice, n = 10 and aged male SIRT2-KOhepmice, n = 12). (g-j. one technical replicate of 8 (LoxP mice) or 9 (SIRT2-KOhep mice) biological replicates for each group. k-n. one technical replicate of 10 (LoxP mice) or 12 (SIRT2-KOhep mice) biological replicates for each group). Data are presented as mean ± SD. with biologically individual data points shown. P values are determined by unpaired two-tailed Student’s t-test (a, c, d, f, g, h, j, k, l, n). n.s., not significant. Source data
Extended Data Fig. 2
Extended Data Fig. 2. Liver-specific SIRT2 deficiency has no effects on osteogenic differentiation and Vitamin D synthesis.
a, Alkaline phosphatase (ALP) and alizarin red (ARS) staining after osteogenesis from bone marrow-derived mesenchymal cells (BM-MSCs) treated with LoxP-plasma and SIRT2-KOhep-plasma for 7 days and 14 days respectively. b, Area of ALP staining and ARS staining positive osteoblasts was analyzed by ImageJ and quantification analysis is shown. c, The expression of osteogenic genes Runx2, Sp7, osteocalcin and ALP in osteoblasts as measured by real-time PCR. n = 3 biologically independent experiments. d, CYP2R1 and CYP27A1 mRNA level in livers of aged female LoxP and SIRT2-KOhep mice (18 months of age) were analyzed by real-time PCR (aged female LoxP mice, n = 8 and aged female SIRT2-KOhep mice, n = 9). e, Total plasma concentration of Vitamin D of aged female LoxP and SIRT2-KOhep mice were detected by ELISA. f, CYP2R1 and CYP27A1 mRNA level in livers of aged male LoxP and SIRT2-KOhep mice (18 months of age) were analyzed by real-time PCR (aged male LoxP mice, n = 10 and aged male SIRT2-KOhep mice, n = 12). g, Total plasma concentration of Vitamin D of aged male LoxP and SIRT2-KOhep mice were detected by ELISA. (d,e. one technical replicate of 8 (LoxP mice) or 9 (SIRT2-KOhep mice) biological replicates for each group. f, g. one technical replicate of 10 (LoxP mice) or 12 (SIRT2-KOhep mice) biological replicates for each group). Data are presented as mean ± SD. with biologically individual data points shown. P values were determined by one-way ANOVA followed by Tukey’s test (b, c). P values are determined by unpaired two-tailed Student’s t-test (d-g). n.s., not significant. Source data
Extended Data Fig. 3
Extended Data Fig. 3. Identification of murine plasma-derived and AML12 hepatocytes supernatant-derived sEVs.
a, Electron microscopy images of sEVs isolated from plasma of aged LoxP and SIRT2-KOhep mice (18 months) (scale bar, 100 nm). n = 2 mice. b, Western blot analysis of sEVs protein markers TSG101, HSP70, ALIX in plasma-derived sEVs. n = 3 mice. c, Representative immunofluorescence images show the internalization of PKH26-labeled plasma-derived sEVs (4 μg/ml) (red) in BMDMs (scale bar, 20 µm). n = 2 biologically independent experiments. d, Western blot analysis of SIRT2 expression in the cytoplasm of SIRT2-knockdown AML12 cells. e, Electron microscopy images of sEVs isolated from AML12 hepatocytes supernatant-derived sEVs (scale bar, 100 nm). f, Western blot analysis of sEVs protein markers TSG101, HSP70, ALIX in the sEVs derived from the supernatant control (NC) and SIRT2-knockdown (SIRT2 shRNA) AML12 cells. g, Nanoparticle tracking analysis (NTA) of the sEVs derived from the supernatant NC and SIRT2 shRNA AML12 cells and isolated by ultracentrifugation. h, Representative immunofluorescence images show the internalization of PKH26-labeled sEVs (4 μg/ml) (red) in BMDMs (scale bar, 20 µm). (d-h, n = 1 biologically independent experiment). Source data
Extended Data Fig. 4
Extended Data Fig. 4. SIRT2-knockdown AML12 hepatocytes and aged SIRT2-/- hepatocyte-derived sEVs inhibit osteoclastogenesis.
a, Representative TRAP staining images of osteoclasts treated with the sEVs (4 μg/ml) derived from control AML12 hepatocytes (NC-sEVs) or SIRT2-knockdown AML12 hepatocytes (shSIRT2-1-sEVs or shSIRT2-2-sEVs) (scale bar, 200 µm). b,c, Number and area of multi-nucleated TRAP+ cells with indicated treatment were measured. d, The mRNA expression of osteoclast-specific genes in the corresponding treated osteoclasts was measured by real-time PCR. (a-d, n = 3 biologically independent experiments). e,f, The osteoclast-specific genes NFATc1, Acp5, Cathespin K and DC-stamp mRNA expression in osteoclasts treated with aged female(e) or male (f) LoxP-hep-sEVs or SIRT2-KOhep-hep-sEVs measured by real-time PCR. n = 3 biologically independent experiments. Data are presented as mean ± SD. with biologically individual data points shown. P values are determined by one-way ANOVA followed by Tukey’s test (b-d), unpaired two-tailed Student’s t-test with Welch’s correction (DC-stamp group of e) and unpaired two-tailed Student’st-test (e, others; f). Source data
Extended Data Fig. 5
Extended Data Fig. 5. SIRT2-KOhep prevents against OVX-induced bone loss through upregulating LRG1 expression in hepatocytes and sEVs.
a, Heatmap of differentially expressed genes identified by RNA-seq using liver tissues from aged LoxP (n = 3) and SIRT2-KOhep mice (n = 3). b, Western blot analysis of LRG1 protein expression in the livers and plasma sEVs of aged LoxP and SIRT2-KOhep mice. n = 3 mice.one technical replicate of 3 biological replicates for each group. c, d, Western blot density analyzed by ImageJ and quantification analysis was shown. n = 3 mice, one technical replicate of 3 biological replicates for each group. e, Western blot analysis of LRG1 protein expression in the cytoplasm and supernatant-derived sEVs of NC and shSIRT2-AML12 hepatocytes. f, Western blot analysis of respective LRG1, Saa1/2 protein level in plasma, plasma sEVs and plasma removed sEVs (-sEVs). g, Western blot analysis of H4K16ac protein levels in the liver of aged LoxP and SIRT2-KOhep mice. n = 3 mice.one technical replicate of 3 biological replicates for each group. h,ChIP analysis showing the enrichment of H4K16ac at the LRG1 proximal promoter region in NC and shSIRT2-AML12 hepatocytes using the primers p4 and p5, which are located at the distant upstream or downstream sites of LRG1 promoter and used as negative control. n = 3 biologically independent experiments. i, Uterine weight in each group after OVX or sham operation (Sham-LoxP-Ctrl mice: n = 7; Sham-SIRT2-KOhep-Ctrl mice: n = 7; OVX-LoxP-Ctrl mice: n = 8; OVX-SIRT2-KOhep-Ctrl mice: n = 8; and OVX-SIRT2-KOhep-shLRG1 mice: n = 8). (one technical replicate of 7 (Sham-LoxP-Ctrl mice); 7 (Sham-SIRT2-KOhep-Ctrl mice); 8 (OVX-LoxP-Ctrl mice); 8 (OVX-SIRT2-KOhep-Ctrl mice) and 8 (OVX-SIRT2-KOhep-shLRG1 mice) biological replicates for each group). j, The real-time observation of AAV8 liver-specific expression in each group was performed by BLI at 14th day after viral injection. k, Western blot analysis of LRG1 protein levels in the liver and plasma sEVs of each group. one technical replicate of 2 biological replicates for each group. Data are presented as mean ± SD. with biologically individual data points shown. P values are determined by unpaired two-tailed Student’s t-test (c, d, i), two-way ANOVA followed by Tukey’s test (h). n.s., not significant. Source data
Extended Data Fig. 6
Extended Data Fig. 6. SIRT2-KOhep has no effects on number of osteoclasts and LRG1 protein level in the osteoclast progenitors in young mice.
a, b, TRAP staining on paraffin-embedded femur sections in young LoxP (n = 7) and SIRT2-KOhep (n = 7) mice (3 months of age) (scale bar, 100 µm) and quantification of Oc.S/BS is shown on the right. One technical replicate of 7 biological replicates for each group. c,d, Represented in situ immunofluorescence images of murine femurs in young mice (scale bar, 50 µm)and quantitation of ratio of LRG1 and CTSK double positive area to CTSK positive area on bone sections of the young LoxP (n = 3) and SIRT2-KOhep (n = 3) mice. One technical replicate of 3 biological replicates for each group. Data are presented as mean ± SD. with biologically individual data points shown. P values were determined by unpaired two-tailed Student’s t-test (b, d). Source data
Extended Data Fig. 7
Extended Data Fig. 7. Hepatocyte-derived sEV-LRG1 suppresses osteoclast differentiation by inhibiting NF-κB p65 nuclear translocation, independently of angiogenesis.
a, The blood concentration of sEVs at different time points after tail vein injection of sEVs. n = 3 mice. One technical replicate of 3 biological replicates. b, Immunofluorescence analysis of the distribution of sEV-LRG1-GFP (green) in RANKL-induced BMDMs at 12 h and 24 h after supplementing sEVs labeled with PKH26 (red) in supernatant (scale bar, 20 µm). c, Enrichment of signaling pathway of sEV-LRG1 binding proteins in DAVID Bioinformatics database. d, IHC detection of CD31 in the paraffin-embedded bone section of distal femur of aged LoxP and SIRT2-KOhep mice (scale bar, 100μm). e, Quantification of CD31 positive vessels area (aged LoxP mice: n = 10 and aged SIRT2-KOhep mice: n = 12). One technical replicate of 10 (LoxP mice) or 12 (SIRT2-KOhep mice) biological replicates for each group. f, Western blot analysis of p65 protein levels in the RAW 264.7 cells overexpressed p65. n = 3 biologically independent experiments. g, HEK293T cells transfected with LPHN2 plasmid were treated with LRG1-sEVs (4 μg/ml) and then immunofluorescence colocalization analysis of sEV-LRG1 and LPNH2 was shown (scale bar, 20 µm). n = 2 biologically independent experiments. Data are presented as mean ± SD. with biologically individual data points shown. P values are determined by one-way ANOVA followed by Tukey’s test (a) and unpaired two-tailed Student’s t-test (e). n.s., not significant. Source data
Extended Data Fig. 8
Extended Data Fig. 8. AGK2 has no effect on osteoclast differentiation.
a, Representative TRAP staining images of BMDMs treated with RANKL and AGK2 (10 µM) or DMSO (scale bar, 200 µm). b, Number and area of multi-nucleated TRAP+ cells with indicated treatment were measured. n = 3 biologically independent experiments. Data are presented as mean ± SD. with biologically individual data points shown. P values are determined by unpaired two-tailed Student’s t-test (b). n.s., not significant. Source data
Extended Data Fig. 9
Extended Data Fig. 9. BMDM-specific SIRT2 knockout has no effect on inhibiting osteoclastogenesis and slowing down bone loss in aged and OVX mice.
a,b, Western blot analysis of SIRT2 protein expression in the primary BMDMs derived from female (a)or male (b) young (n = 3, 3 months of age) and aged (n = 3, 18 months of age) mice.c, Western blot analysis of SIRT2 protein expression in the primary BMDMs derived from sham (n = 3) and OVX (n = 3) mice (12 weeks of age). (a-c, one technical replicate of 3 biological replicates for each group). d, Western blot analysis of SIRT2 protein expression in the primary BMDMs treated with RANKL. n = 3 biologically independent experiments. (a-d, Western blot density analyzed by ImageJ and quantification analysis was shown). e-h, Represented images of 3D restoration and quantification of trabecular BV/TV, Tb.N., Tb.Sp. and Tb.Th. of distal femur of the aged female (e,f) or male (g,h) LoxP (both n = 6) and SIRT2-KOlyz (both n = 6) mice, as measured by micro-CT. One technical replicate of 6 biological replicates for each group. i,j, Represented images of 3D restoration and quantification of trabecular BV/TV, Tb.N., Tb.Sp. and Tb.Th. of distal femur of the OVX female LoxP (n = 10) and SIRT2-KOhep (n = 10) mice (12 weeks of age), as measured by micro-CT. One technical replicate of 10 biological replicates for each group. k,n, BMDMs were isolated from LoxP and SIRT2-KOlyz mice (8 weeks of age) and cultured with murine M-CSF and RANKL stimulation for 7 days to generate osteoclasts. Representative TRAP staining images of osteoclasts (scale bar, 200 µm). l,m,o,p, Number and area of multi-nucleated TRAP+ cells of female (l-m) or male (o-p) mice. n = 3 biologically independent experiments. Data are presented as mean ± SD. with biologically individual data points shown. P values are determined by unpaired two-tailed Student’s t-test (a-d,f, h, j, l, m, o, p). n.s., not significant. Source data
Extended Data Fig. 10
Extended Data Fig. 10. Hepatocyte-derived AGK2-sEVs inhibit human osteoclast differentiation.
a, Western blot analysis of LRG1 protein expression in the sEVs derived from HepG2 cells treated with AGK2 (5 µM). b, Representative TRAP staining images of human PBMCs cultured with RANKL and sEVs(10 μg/ml) derived from the supernatant of HepG2 cells treated with control or AGK2 (Ctrl-sEVs, AGK2-sEVs) (scale bars, 200 µm). c,d, Number and area of multi-nucleated TRAP+ cells. e, The mRNA expression of osteoclast-specific genes measured by real-time PCR. n = 3 biologically independent experiments. Data are presented as mean ± SD. with biologically individual data points shown. P values are determined by unpaired two-tailed Student’s t-test (c-e). Source data

Comment in

References

    1. Schuit SC, et al. Fracture incidence and association with bone mineral density in elderly men and women: the Rotterdam Study. Bone. 2004;34:195–202. doi: 10.1016/j.bone.2003.10.001. - DOI - PubMed
    1. Rachner TD, Khosla S, Hofbauer LC. Osteoporosis: now and the future. Lancet. 2011;377:1276–1287. doi: 10.1016/S0140-6736(10)62349-5. - DOI - PMC - PubMed
    1. Weske S, et al. Targeting sphingosine-1-phosphate lyase as an anabolic therapy for bone loss. Nat. Med. 2018;24:667–678. doi: 10.1038/s41591-018-0005-y. - DOI - PubMed
    1. Boyle WJ, Simonet WS, Lacey DL. Osteoclast differentiation and activation. Nature. 2003;423:337–342. doi: 10.1038/nature01658. - DOI - PubMed
    1. Asagiri M, Takayanagi H. The molecular understanding of osteoclast differentiation. Bone. 2007;40:251–264. doi: 10.1016/j.bone.2006.09.023. - DOI - PubMed

Publication types