. 2023 Jun;26(6):1021-1031.
doi: 10.1038/s41593-023-01325-4. Epub 2023 May 15.

Early alterations in the MCH system link aberrant neuronal activity and sleep disturbances in a mouse model of Alzheimer's disease

Affiliations

Early alterations in the MCH system link aberrant neuronal activity and sleep disturbances in a mouse model of Alzheimer's disease

Sara Calafate et al. Nat Neurosci. 2023 Jun.

Abstract

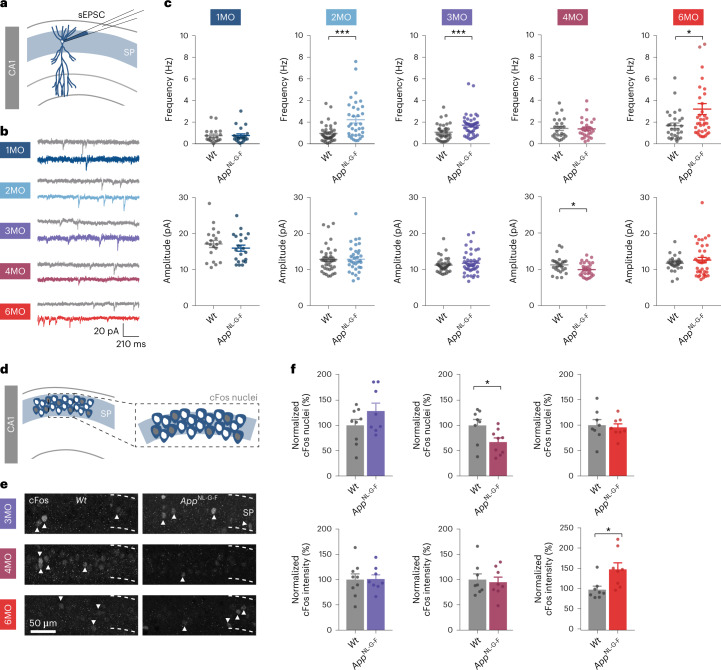
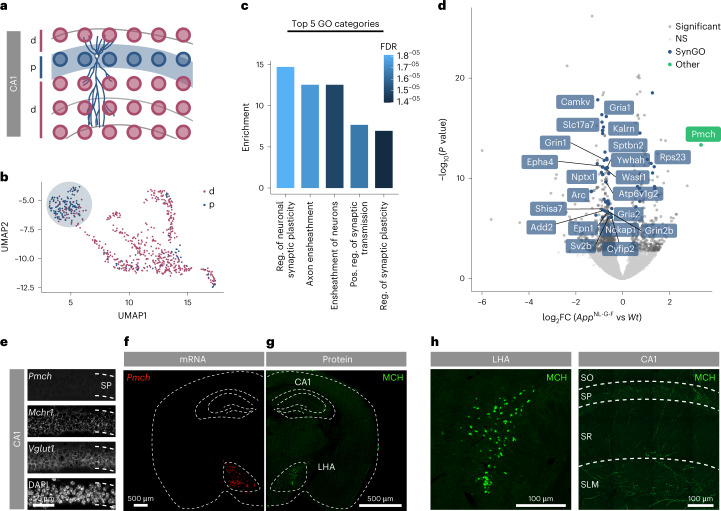
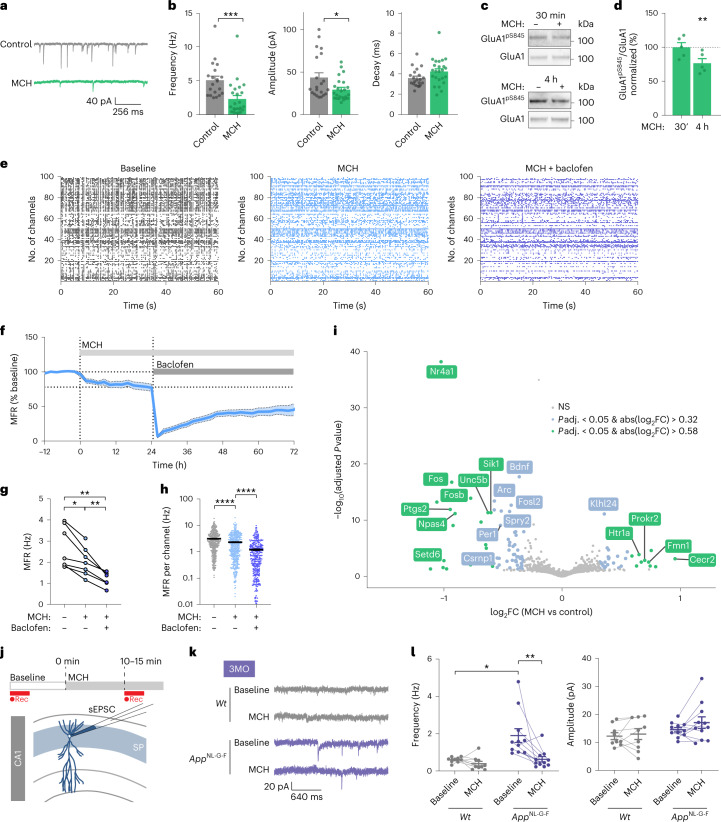
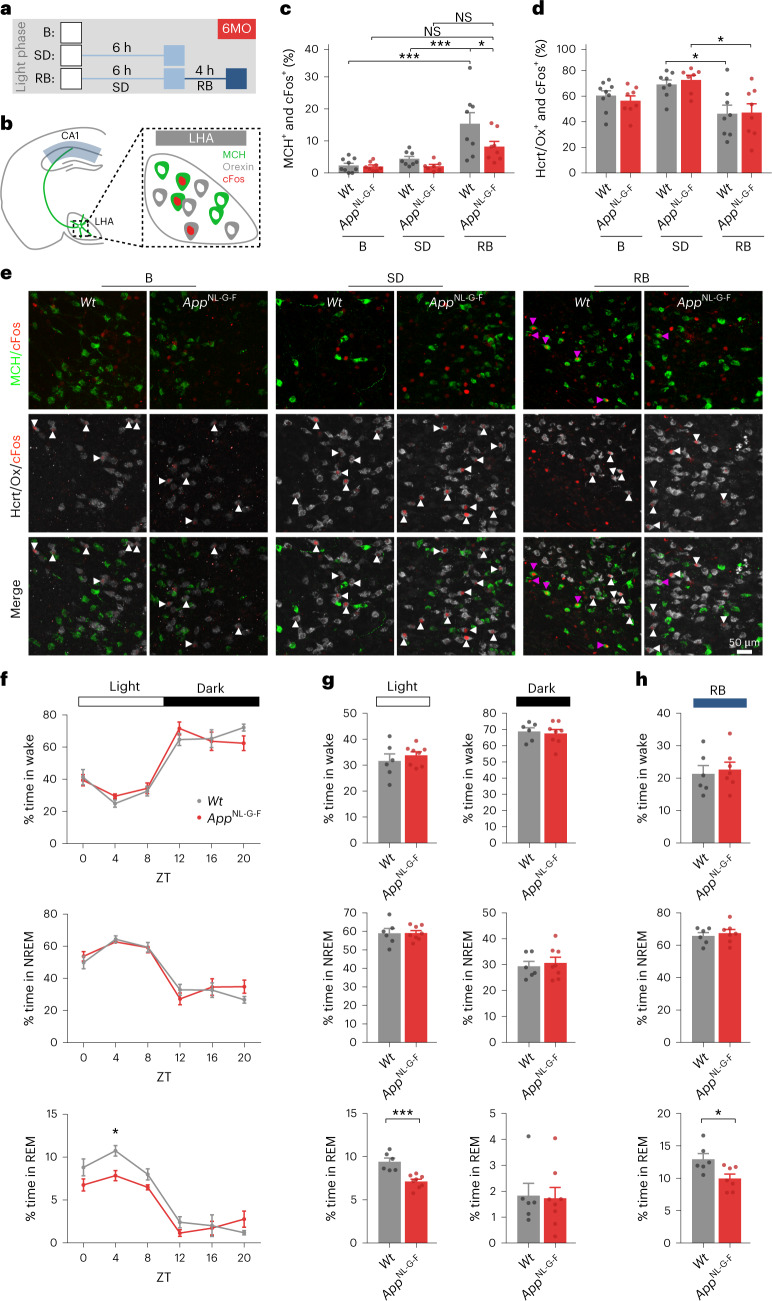
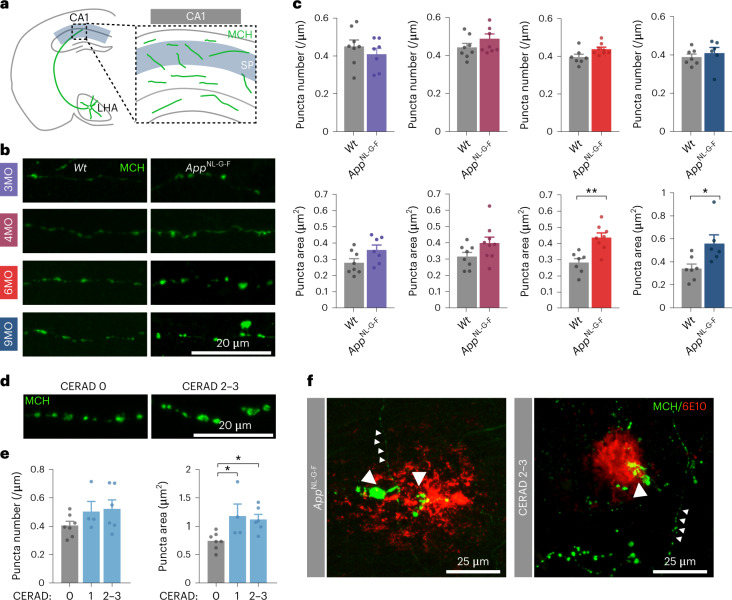
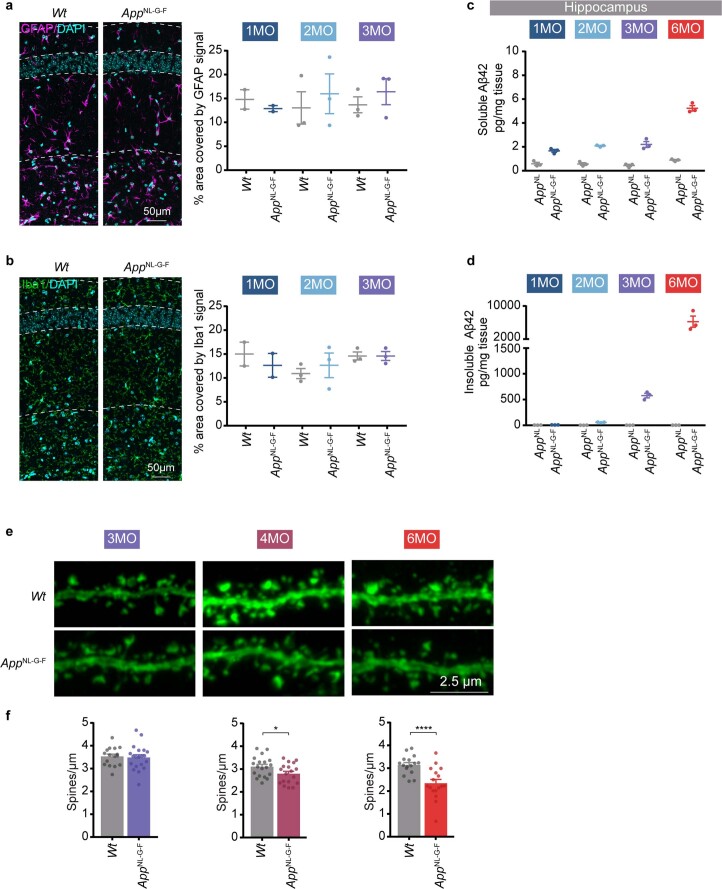
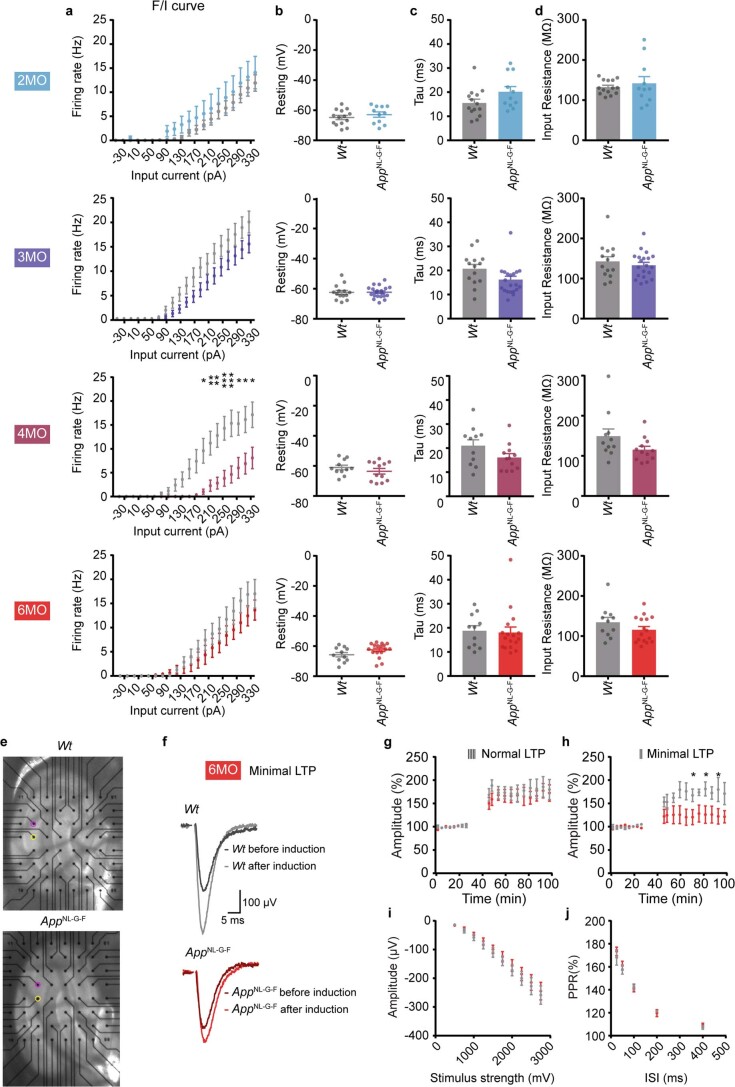
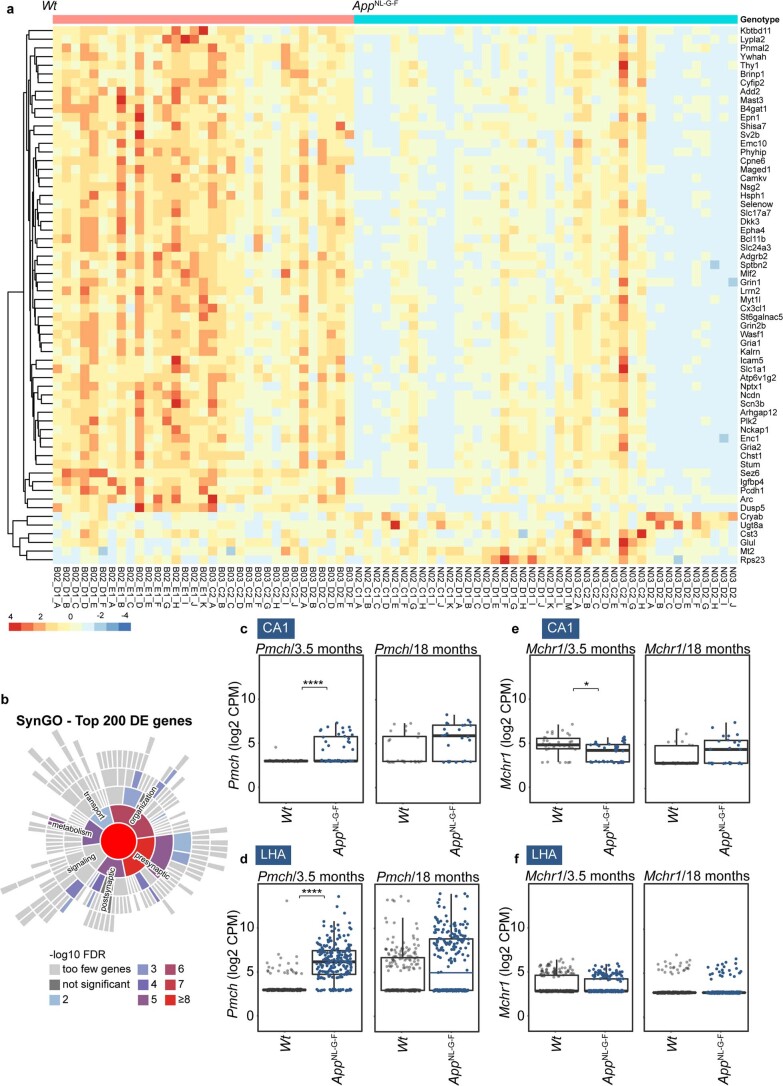
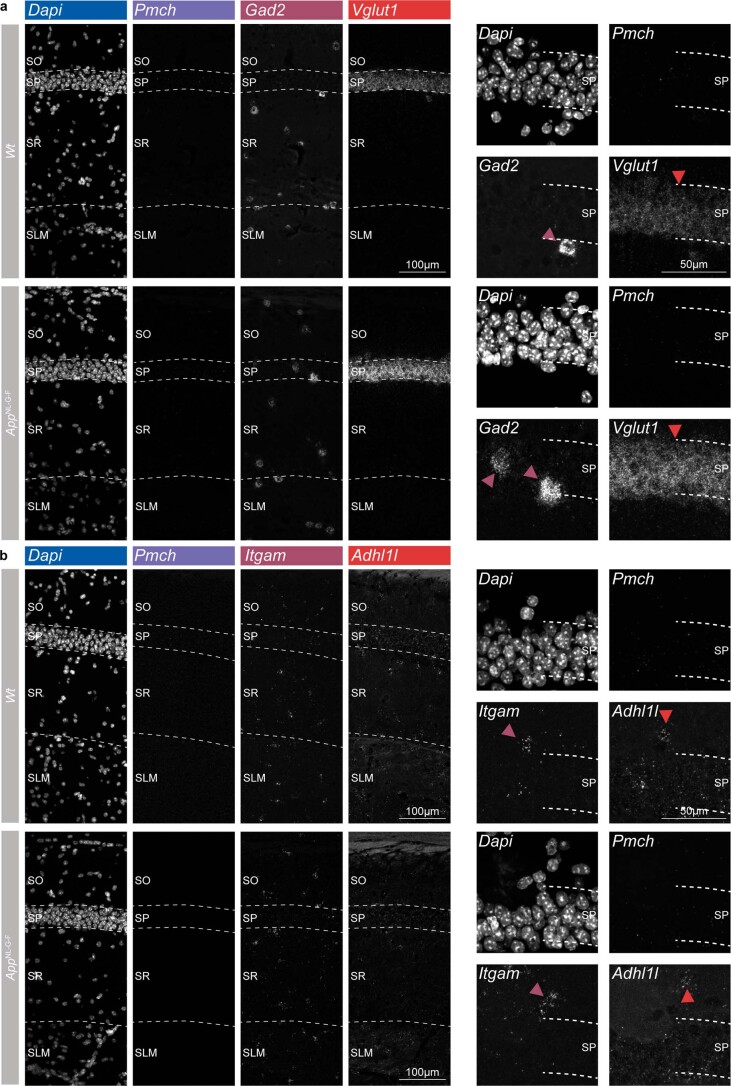
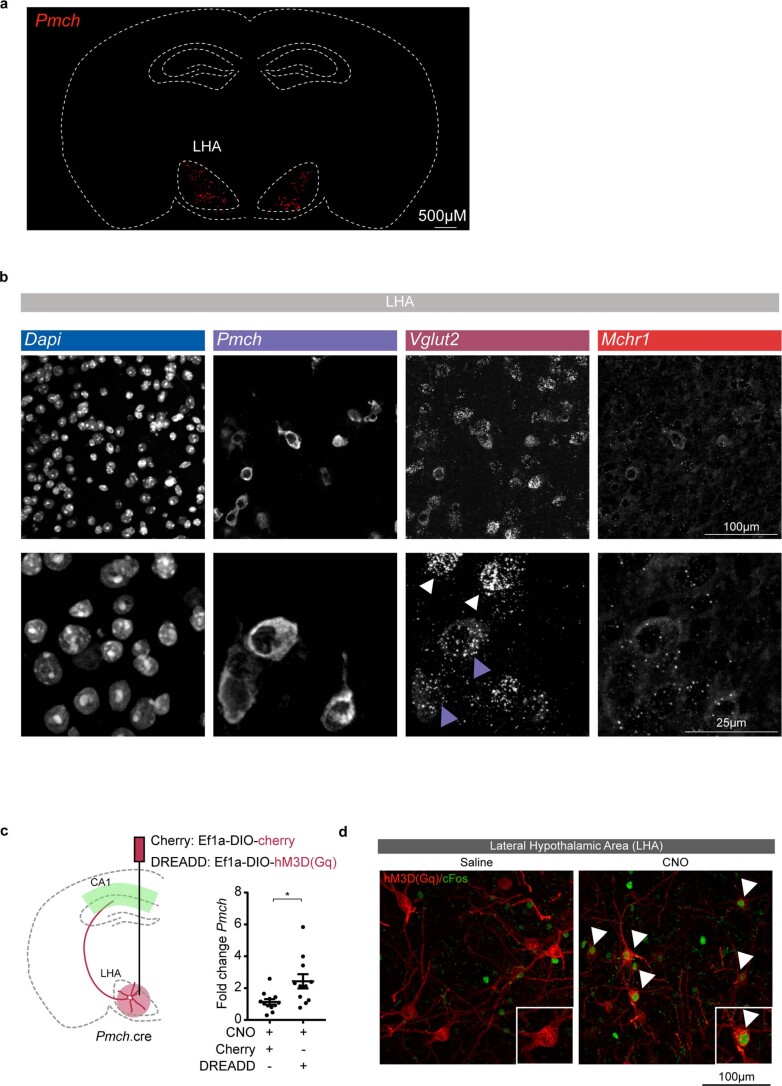
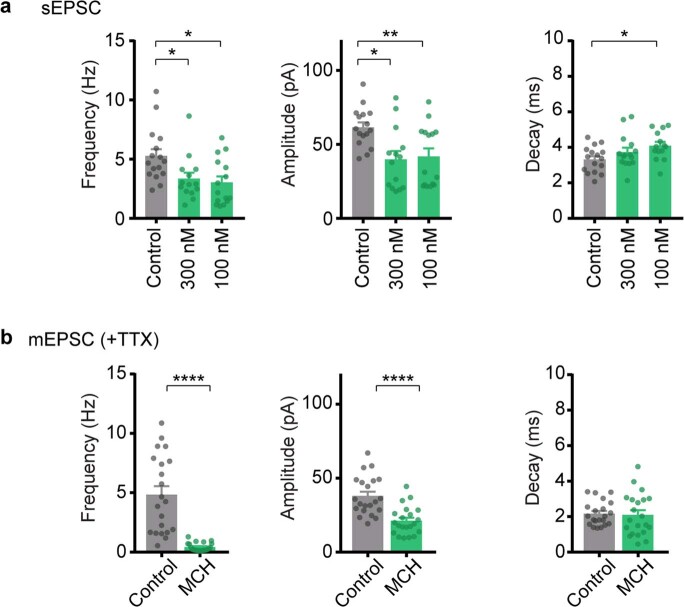
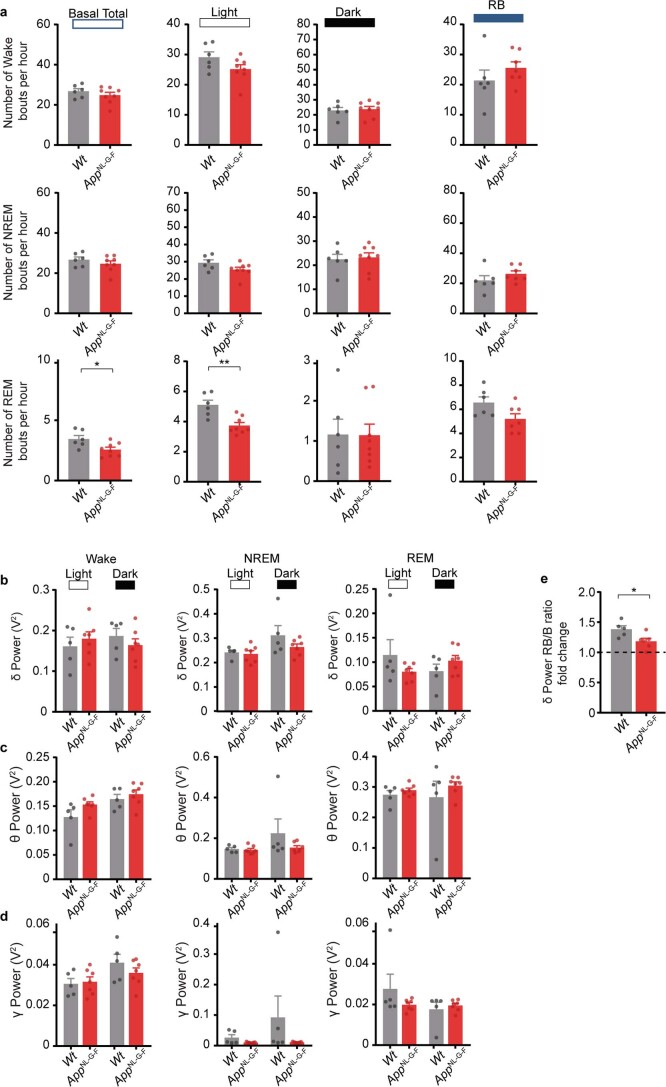
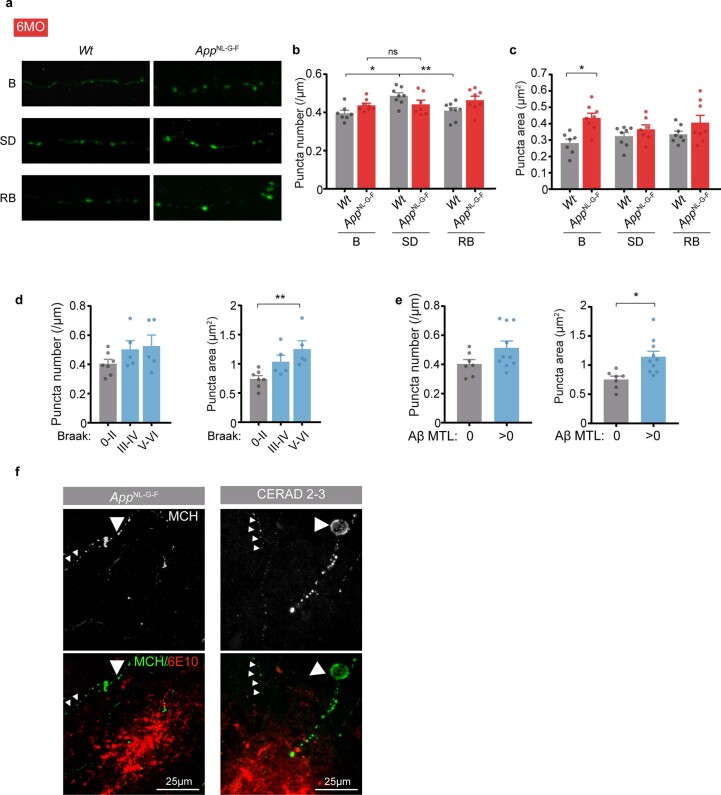
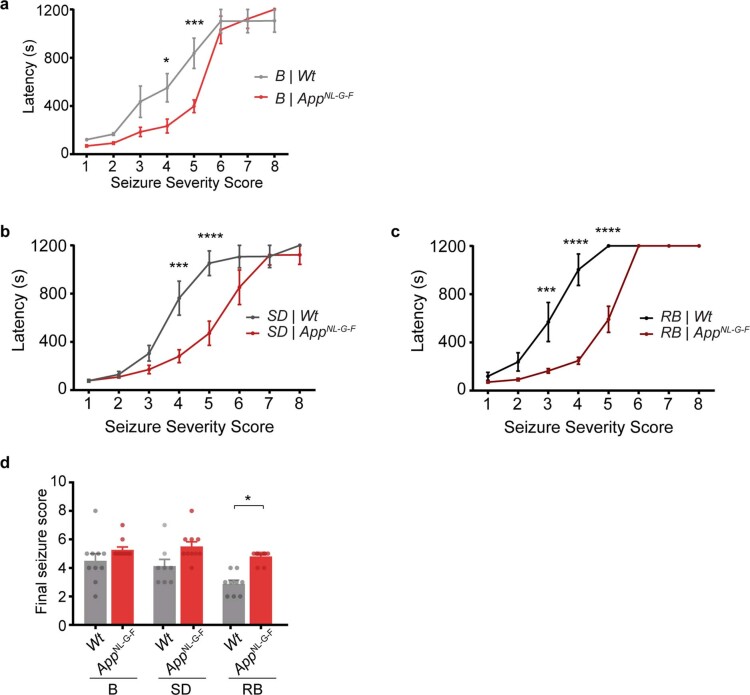
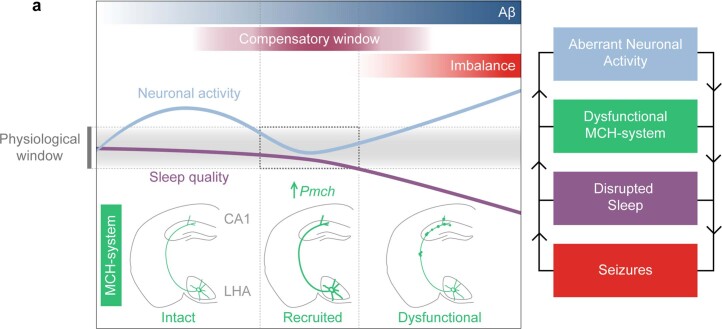
Early Alzheimer's disease (AD) is associated with hippocampal hyperactivity and decreased sleep quality. Here we show that homeostatic mechanisms transiently counteract the increased excitatory drive to CA1 neurons in AppNL-G-F mice, but that this mechanism fails in older mice. Spatial transcriptomics analysis identifies Pmch as part of the adaptive response in AppNL-G-F mice. Pmch encodes melanin-concentrating hormone (MCH), which is produced in sleep-active lateral hypothalamic neurons that project to CA1 and modulate memory. We show that MCH downregulates synaptic transmission, modulates firing rate homeostasis in hippocampal neurons and reverses the increased excitatory drive to CA1 neurons in AppNL-G-F mice. AppNL-G-F mice spend less time in rapid eye movement (REM) sleep. AppNL-G-F mice and individuals with AD show progressive changes in morphology of CA1-projecting MCH axons. Our findings identify the MCH system as vulnerable in early AD and suggest that impaired MCH-system function contributes to aberrant excitatory drive and sleep defects, which can compromise hippocampus-dependent functions.


Conflict of interest statement

D.R.T. received speaker honorarium from Biogen (USA), travel reimbursement from UCB (Belgium) and collaborated with GE HealthCare (United Kingdom), Novartis Pharma Basel (Switzerland), Probiodrug (Germany) and Janssen Pharmaceutical Companies (Belgium). T.G.O. is a scientific advisor board member and shareholder of Ceracuity (USA) and collaborated with Biogen (USA). B.D.S. is or has been consultant for Eisai, AbbVie, K5/Muna; co-founder of Augustine Tx; and founder and shareholder of K5/Muna. J.d.W. is co-founder and scientific advisory board member of Augustine Tx. All other authors declare no competing interests.

Figures

Fig. 1
Fig. 1. Homeostatic plasticity response counteracts increased excitatory drive to CA1 pyramidal neurons in AppNL-G-F mice.
ac, Whole-cell voltage clamp recordings of sEPSCs in CA1 pyramidal neurons in acute hippocampal slices from Wt and AppNL-G-F mice at different months (MO). Schematic (a) and representative traces (b) of analyzed frequency and amplitude of sEPSCs (c). Number of neurons from at least three mice per genotype: 1MO - Wt n = 20, AppNL-G-F n = 21; 2MO - Wt n = 40, AppNL-G-F n = 34 (P = 0.003); 3MO - Wt n = 36, AppNL-G-F n = 44 (P = 0.0008); 4MO - Wt n = 24, AppNL-G-F n = 27 (P = 0.0343), 6MO - Wt n = 29, AppNL-G-F n = 38 (P = 0.0168). Two-tailed unpaired t-test or Mann–Whitney test was used, depending on normality. Individual data points shown with bars represent the mean ± s.e.m. (*P < 0.05, ***P < 0.001). df, cFos immunostaining of CA1 neurons from Wt and AppNL-G-F mice at 3, 4 and 6 MO. Schematic (d) and representative images (e) of cFos in CA1 neurons at each MO. f, Top graphs show quantification of normalized number of cFos-positive CA1 neurons. Bottom graphs show the normalized intensity of the cFos signal in positive neurons. Number of mice: 3MO - Wt n = 9, AppNL-G-F n = 8; 4MO - Wt n = 8, AppNL-G-F n = 9 (P = 0.0335); 6MO - Wt n = 8, AppNL-G-F n = 8 (P = 0.0148). Two-tailed unpaired t-test or Mann–Whitney test was used, depending on normality. Individual data points are shown and bars represent the mean ± s.e.m. (*P < 0.05).
Fig. 2
Fig. 2. Spatial transcriptomics reveals Pmch as a key player in plasticity response.
a,b, Spatial transcriptomics performed on mouse sections of Wt and AppNL-G-F brains at 3.5 MO. a, TDs from CA1 pyramidal layer (p) (b) cluster away from dendritic (d) TDs in an unbiased cluster analysis. Number of TDs in p: Wt n = 33, AppNL-G-F n = 42. c, Results of GO enrichment analysis on the top 200 DE genes (based on P value). GO categories were sorted by P value and the top 8 GO categories were ordered by normalized enrichment score (Fisher’s exact test). The five most enriched GO categories are shown in the bar plot. Coloring represents false discovery rate (FDR). See additional information in Supplementary Table 2. d, Volcano plot showing average gene expression differences between AppNL-G-F and Wt TDs. Significant genes (EdgeR’s quasi-likelihood F test with Benjamini–Hochberg correction < 0.05), are shown in dark gray. Significant genes annotated in SynGO are highlighted in blue, other significant genes of interest are shown in green. The 21 genes annotated in SynGO and present in at least one homeostatic plasticity dataset are labeled (Supplementary Table 3). NS, not significant. e, CA1 pyramidal layer crops showing Pmch, Mchr1 and Vglut1 (Slc17a7) mRNA expression using RNAscope. DAPI was used to label nuclei. Wt n = 2 independent experiments. f,g, Whole-brain coronal section showing expression of Pmch (f) and MCH (g). Wt n = 3 independent experiments. h, Crops of LHA and CA1 regions showing MCH-positive cell bodies in the LHA and axons projecting to CA1 region. Wt n = 3 independent experiments. FC, fold change.
Fig. 3
Fig. 3. Melanin-concentrating hormone decreases synaptic strength and modulates firing rate homeostasis.
a,b, Whole-cell voltage clamp recordings of sEPSCs in hippocampal cultured neurons treated with vehicle or 1 μM MCH peptide for 4 h. Representative raw traces (a) and graphs (b) of sEPSC frequency (P = 0.0001), amplitude (P = 0.0255) and decay time. Number of independent cultures, n = 4; number of neurons, control n = 20, 1 μM MCH n = 24. Two-tailed unpaired t-test or Mann–Whitney test, depending on normality. Individual data points shown; bars represent the mean ± s.e.m. (*P < 0.05, ***P < 0.001). c,d, Hippocampal cultures treated with vehicle or 1 μM MCH for 30 min or 4 h (c) analyzed for phosphorylated GluA1 on serine 845 (GluA1pSer845) and total GluA1 levels. d, GluA1pSer845/GluA1 ratio normalized to vehicle (P = 0.0079). Number of independent cultures for all conditions, n = 5; data points represent the average of three replicas per each independent culture. Two-tailed unpaired t-test. Individual data points shown; bars represent the mean ± s.e.m. (**P < 0.01). e, Raster plots from a representative MEA experiment in hippocampal neurons showing activity of the same 99 channels in baseline, 24 h of 1 µM MCH and 2 d after application of 10 µM baclofen (MCH + baclofen). f, Time course of MFR after MCH (1 µM, ~20% steady-state reduction) and impaired renormalization of MFR after baclofen (10 µM) to the new set point. g, Summary of MFRs following 24 h of MCH and MCH + baclofen for 2 d. Number of independent cultures: baseline, n = 7; MCH, n = 7; baclofen, n = 6. (Baseline versus MCH P = 0.0151; MCH versus baclofen P = 0.0048, baseline versus baclofen P = 0.0099). Mixed-effect model analysis with Tukey’s post hoc test. (*P < 0.05, **P < 0.01). h, Changes in MFR per channel after MCH (MCH, 2.30 ± 0.11 Hz) and MCH + baclofen for 2 d (MCH + baclofen, 1.2 ± 0.08 Hz) compared to baseline (baseline, 3.12 ± 0.13 Hz). Number of independent cultures: baseline, n = 7; MCH, n = 7; baclofen, n = 6. (Baseline versus MCH P < 0.0001; MCH versus baclofen P < 0.0001, baseline versus baclofen P < 0.0001). Individual data points shown with bars representing the mean ± s.e.m. Mixed-effect model analysis with Tukey’s post hoc test (****P < 0.0001). i, Volcano plot showing gene expression differences between hippocampal cultures treated with vehicle or 1 μM MCH for 4 h. Number of independent cultures: n = 2, 2 replicas per culture. (log2FC values were calculated using DESeq2. P values were calculated using the Wald test and adjusted for multiple testing using Benjamini–Hochberg correction). DE genes are available in Supplementary Table 5. jl, Whole-cell voltage clamp recordings of sEPSC in CA1 pyramidal neurons in acute hippocampal slices before (baseline) and after incubation of 1 µM of MCH, from Wt and AppNL-G-F mice at 3 MO. Schematic (j) and representative traces (k) of sEPSC frequency (l; Wt baseline versus AppNL-G-F baseline P = 0.0239; AppNL-G-F baseline versus AppNL-G-F MCH P = 0.0032) and amplitude. Number of neurons: 3MO neurons from six or more mice - Wt n = 9, AppNL-G-F n = 11. Two-tailed unpaired t-test or Mann–Whitney test used depending on normality. Individual data points shown; bars represent the mean ± s.e.m. (*P < 0.05, **P < 0.01). Source data
Fig. 4
Fig. 4. Reduced fraction of active MCH neurons and perturbed rapid eye movement sleep in AppNL-G-F mice.
a, Schematic of experimental groups at 6 months: control (B), 6 h of SD, and 4 h of RB sleep following 6 h of SD. b, Location of analyzed neurons. c,d, Quantifications of LHA neurons from Wt and AppNL-G-F mice. c, MCH+ and cFos+ (Wt B versus Wt RB P = 0.0001, Wt SD versus Wt RB P = 0.0004, Wt RB versus AppNL-G-F RB P = 0.0448). d, Hcrt/Ox+ and cFos+ (Wt SD versus Wt RB P = 0.0354, AppNL-G-F SD versus AppNL-G-F RB P = 0.0126). Number of mice: 6 MO - B: Wt n = 9, AppNL-G-F n = 8; SD: Wt n = 8, AppNL-G-F n = 7, RB: Wt n = 8, AppNL-G-F n = 8. One-way analysis of variance (ANOVA) with Tukey’s post hoc test. Individual data points are shown; bars represent the mean ± s.e.m. (*P < 0.05, ***P < 0.001). e, Representative images of LHA show MCH (green) or Hcrt/Ox (gray) neurons positive for cFos (red). Magenta arrowheads denote MCH+ and cFos+; white arrows denote Hcrt/Ox+ and cFos+ neurons. f,g, Basal EEG/EMG recordings show the percentage of time spent in wake, NREM and REM states over Zeitgeber time (ZT; every 4 h; P = 0.0192; f) or during total light and dark phases (P = 0.0004; g). Number of mice: 6 MO - B: Wt n = 6, AppNL-G-F n = 8. Two-way ANOVA, with Holm–Sidak post hoc multiple-comparisons test. Individual data points are shown; bars represent the mean ± s.e.m. (*P < 0.05). h, EEG/EMG recordings during RB sleep show the percentage of time spent in wake, NREM or REM (P = 0.0214). Number of mice: 6 MO - RB: Wt n = 6, AppNL-G-F n = 7. Two-tailed unpaired t-test. Individual data points are shown; bars represent the mean ± s.e.m. (*P < 0.05).
Fig. 5
Fig. 5. Progressive impairment in MCH axon morphology in AppNL-G-F mice and individuals with Alzheimer’s disease.
a, Schematic showing location of analyzed axons. b,c, CA1-projecting MCH-positive axons in Wt and AppNL-G-F mice at 3, 4, 6 and 9 months. Representative images (b) and quantification (c) of the number of MCH puncta per axon length and respective puncta area. Number of mice: 3MO - Wt n = 8, AppNL-G-F n = 7, 4MO - Wt n = 8, AppNL-G-F n = 8, 6MO - Wt n = 7, AppNL-G-F n = 8 (P = 0.0014), 9MO - Wt n = 7, AppNL-G-F n = 6 (P = 0.023). Two-tailed unpaired t-test. Individual data points are shown; bars represent the mean ± s.e.m. (*P < 0.05, **P < 0.01). d,e, CA1-projecting MCH-positive axons in controls and individuals with AD at different stages of AD pathology. Representative images (d) and quantification (e) of the number of MCH puncta along axon length and respective puncta area in relation to CERAD. Number of individuals with AD: CERAD 0 n = 7; CERAD 1 n = 4 (P = 0.0404); CERAD 2–3 n = 6 (P = 0.0466). One-way ANOVA with Tukey’s post hoc test. Individual data points are shown; bars represent the mean ± s.e.m. (*P < 0.05). f, Representative images of MCH axons in CA1 hippocampal region show aberrant morphology near Aβ plaques labeled by 6E10 antibody (large arrowhead) and neurite with normal morphology (small arrowheads), in AppNL-G-F and brain samples from individuals with AD.
Extended Data Fig. 1
Extended Data Fig. 1. Early morphological alterations in the AppNL-G-F mice.
a,b, Representative image and area covered by signal on CA1 hippocampal sections from Wt and AppNL-G-F mice at 1, 2 and 3 months (MO) immunostained for (a) astrocyte-marker GFAP (magenta) and (b) marker of microglia activation Iba1 (green). Nuclei are labeled with DAPI (cyan). n = 3 mice per time point and genotype. Individual data points shown with bars representing mean ± SEM. c,d, Quantification of (c) soluble and (d) insoluble Aβ42 using meso ELISA on AppNL and AppNL-G-F mice hippocampal lysates at 1, 2, 3 and 6 MO. Number of mice: n = 3 mice per time point and genotype. AppNL mouse was used as control as it contains the human App gene but with only one mutation and does not develop Aβ plaques compared to AppNL-G-F. Individual data points shown with bars representing mean ± SEM. e,f, Spine analysis of CA1 pyramidal neuron proximal apical dendrites labelled with GFP from Wt and AppNL-G-F at different months (MO). (e) Representative images and (f) quantification of spine number per dendrite length. Number of dendrites from 3 mice per time point and genotype: 3MO - Wt n = 16, AppNL-G-F n = 20; 4MO - Wt n = 19, AppNL-G-F n = 18 (p = 0.0395), 6MO - Wt n = 16, AppNL-G-F n = 17 (p = 0.0005). Two-tailed unpaired t-test. Individual data points shown with bars representing mean ± SEM. (*p < 0.05, ****p < 0.0001).
Extended Data Fig. 2
Extended Data Fig. 2. Early functional alterations in the AppNL-G-F mice.
a,b,c,d Whole-cell current clamp recordings of intrinsic properties from CA1 pyramidal neurons from Wt and AppNL-G-F at different months (MO). (a) Intrinsic excitability, firing rate in function of somatic current injection, (b) resting membrane potential, (c) Tau membrane constant and (d) input resistance. Number of neurons from 3 or more mice, 3MO - Wt n = 14, AppNL-G-F n = 20; 4MO - Wt n = 11, AppNL-G-F n = 12, 6MO - Wt n = 11, AppNL-G-F n = 17. Two-tailed unpaired t-test. (*p < 0.05). (a) Two-way ANOVA, with Holm-Sidak post-hoc multiple comparisons test (190 pA p = 0.0157, 210 pA p = 0.0098, 230 pA p = 0.0018, 250 and 270 pA p = 0.0008, 290 pA p = 0.0171, 310 pA p = 0.0212, 330 pA p = 0.0303)). (b,c,d) Two-tailed unpaired t-test. Individual data points shown with bars representing mean ± SEM. (*p < 0.05, **p < 0.01, ***p < 0.001). e, Images of Wt (left) and AppNL-G-F (right) acute hippocampal slices on the multielectrode array (MEA2100, Multichannel Systems) used for field excitatory postsynaptic potential (fEPSP) recordings. Stimulation and recording electrodes are indicated with purple and yellow circles, respectively. f, Example traces of fEPSP responses in Wt and AppNL-G-F before (dark traces) and 55 minutes after minimal LTP induction (light traces). g, LTP induced in CA1 region by Schaffer collateral (SC) pathway stimulation using 3 theta burst stimulations. h, LTP induced in CA1 region using minimized theta burst stimulation paradigm (65.05 min p = 0.048, 81.55 min p = 0.049, 92.55 min p = 0.0366). i, Input-output (IO) relationship for Wt and AppNL-G-F slices. j, Paired-pulse ratio (PPR) stimulations of SC pathway. Stimulation intensities used for LTP and paired pulse ratio recordings were calculated from CA1 region using SC stimulation in Wt and AppNL-G-F slices (inter stimulus intervals (ISI): 25, 50, 100, 200 and 400 ms). Number of mice: Normal LTP –Wt n = 5, AppNL-G-F n = 5; Minimal LTP - Wt n = 4, AppNL-G-F n = 4. Two-way ANOVA, with Holm-Sidak post-hoc multiple comparisons test. Individual data points shown with bars representing mean ± SEM. (*p < 0.05).
Extended Data Fig. 3
Extended Data Fig. 3. Transcriptional alterations in the AppNL-G-F mice.
a, Heatmap showing scaled expression of DE genes (in Spatial Transcriptomics) that appear in at least one of four homeostatic plasticity datasets. Columns represent tissue domains (TD) taken from the SP layer of CA1 region, from multiple tissue slides of 2 AppNL-G-F mice and 2 Wt mice at 3.5 months (mouse genotypes are shown as colored bars across the top). Mouse information metadata is available in Supplementary Table 4. b, Sunburst visualization of Synaptic Gene Ontology (SynGO) enriched ontology terms on the top 200 DE genes (based on p-value), using a one-sided Fisher’s Exact Test, colored by -log10 FDR (False Discovery Rate). c,d,e,f, Spatial Transcriptomics performed on coronal mouse sections of Wt and AppNL-G-F brains at 3.5 and 18 months. Tissue domains (TD) from CA1 pyramidal layer and LHA were selected and Pmch and Mchr1 mRNA levels analyzed. Number of TDs in CA1 pyramidal layer: 3.5 months - Wt n = 33, AppNL-G-F n = 42 (Pmch p = 0.0001, Mchr1 p = 0.0318); 18 months - Wt n = 25, AppNL-G-F n = 25; Number of TDs in LHA: 3.5 months - Wt n = 418, AppNL-G-F n = 383 (Pmch p = 0.0001); 18 months - Wt n = 280, AppNL-G-F n = 365; EdgeR’s quasi-likelihood F-test (*p < 0.05, ****p < 0.0001). Boxplots show medians, interquartile ranges and minimum/maximum values (up to 1.5 x interquartile range) of log2 normalised expression per TD.
Extended Data Fig. 4
Extended Data Fig. 4. Pmch is not expressed in CA1 cell-bodies.
a, RNAscope on 10μm Wt and AppNL-G-F in mouse brain coronal sections at 3.5 months showing Pmch, Gad2, and Vglut1 (Slc17a7) expression in CA1 region. b, Pmch, Itgam and Adhl1l expression in CA1 region. A higher magnification image is shown on the right side for each of the transcripts.
Extended Data Fig. 5
Extended Data Fig. 5. Pmch is expressed in LHA cell-bodies.
a,b, RNAscope on 10μm Wt mouse brain coronal section showing (a) Pmch expression in whole section and (b) Pmch, Vglut2 (Slc17a6) and Mchr1 expression in the lateral hypothalamic area (LHA) (top row) and highlighted in crops (bottom row). White arrowheads indicate Vglut2 positive cells that do not express Pmch. Purple arrowheads indicate Vglut2- and Pmch-positive cells. c, RT-qPCR on hippocampal extracts from Pmch.cre animals expressing Cherry or hM3Dq(Gq) (DREADD-Cherry) in MCH-neurons in the LHA. CNO was i.p. injected at the beginning of the light-phase for 4 hours (3 mg/kg). Number of mice: Cherry n = 12, DREADD n = 11 (p = 0.0115). Two-tailed unpaired t-test. Individual data points shown with bars representing mean ± SEM. (*p < 0.05). d, Representative images from Pmch.cre animal expressing hM3Dq(Gq) in MCH-neurons in the LHA. Saline or CNO were i.p. injected at the beginning of the light-phase for 4 hours (3 mg/kg), to show that CNO injection induces cFos expression in hM3Dq(Gq)-expressing neurons. Arrowheads indicate active MCH-neurons that express hM3Dq(Gq) (red) and cFos (green). These animals belong to a different cohort from the animals used in Extended Data Fig. 5c. Number of mice: Saline n = 1, CNO n = 1.
Extended Data Fig. 6
Extended Data Fig. 6. MCH decreases hippocampal synaptic strength.
a, Whole-cell voltage clamp recordings of spontaneous excitatory postsynaptic currents (sEPSC) in hippocampal cultured neurons treated with control vehicle (H2O), 300 nM or 100 nM MCH peptide for 4 hours. (Frequency: 300 nM p = 0.0123, 100 nM p = 0.0455; Amplitude: 300 nM p = 0.0376; 100 nM p = 0.0137; Decay: 100 nM p = 0.04). Number of independent cultures: n = 3; Number of neurons: Control n = 16; 300 nM MCH n = 14; 100 nM MCH n = 13. Depending on normality, one-way ANOVA with Tukey’s post-hoc test or Kruskal-Wallis statistical test. Individual data points shown with bars representing mean ± SEM. (*p < 0.05, **p < 0.01). b, Whole-cell voltage clamp recordings of miniature excitatory post-synaptic currents (mEPSC) in the presence of tetrodotoxin (TTX, 1 μM) in hippocampal cultured neurons treated with control vehicle (H2O) or 1 μM MCH peptide for 4 hours. (Frequency: p = 0.0001; Amplitude: p = 0.0001). Number of independent cultures: n = 3; Number of neurons: Control n = 21; 1 μM MCH n = 21. Two-tailed unpaired t-test or Mann-Whitney test was used, depending on normality. Individual data points shown with bars representing mean ± SEM. (****p < 0.0001).
Extended Data Fig. 7
Extended Data Fig. 7. Sleep homeostatic response is impaired in AppNL-G-Fmice.
a, EEG/EMG recordings showing the number of wake, NREM and REM bouts per hour during total basal recording, light or dark phase, and during RB sleep. Number of mice: 6 MO - B: Wt n = 6, AppNL-G-F n = 8; RB: Wt n = 6, AppNL-G-F n = 7 (REM: Basal Total p = 0.0225, Light p = 0.0022). One-way ANOVA with Tukey’s post-hoc test. Individual data points shown with bars representing mean ± SEM. (*p < 0.05, **p < 0.01). b,c,d, EEG/EMG recordings during basal recordings showing normalized power spectra of (b) delta, (c) theta and (d) gamma (30-60 Hz) bands in wake, NREM or REM states. Number of mice: 6 MO - B: Wt n = 5, AppNL-G-F n = 7. One-way ANOVA with Tukey’s post-hoc test or Kruskal-Wallis statistical test. Individual data points shown with bars representing mean ± SEM. e, Fold-change of normalized delta power spectrums during NREM sleep from EEG/EMG recordings during RB sleep. Number of mice: 6 MO - RB: Wt n = 5, AppNL-G-F n = 6 (p = 0.0277). Unpaired Mann-Whitney test. Individual data points shown with bars representing mean ± SEM. (*p < 0.05).
Extended Data Fig. 8
Extended Data Fig. 8. MCH-positive axon morphological changes.
a,b,c, MCH-positive axons in CA1 region from Wt and AppNL-G-F mice at 6 months in B, SD and RB groups. (a) Representative image and (b) quantification of the number of MCH puncta along axon length (Wt B vs Wt SD p = 0.0079; Wt SD vs Wt RB p = 0.0266) and (c) respective puncta area (Wt B vs AppNL-G-F B p = 0.0093). Number of mice: B: Wt n = 7, AppNL-G-F n = 8; SD - Wt n = 8, AppNL-G-F n = 7, RB - Wt n = 8, AppNL-G-F n = 8. One-way ANOVA with Tukey’s post-hoc test. Individual data points shown with bars representing mean ± SEM. (*p < 0.05, **p < 0.01). Data shown for B group is the same as shown in Fig. 5c. d, e, Quantification of the number of MCH puncta per axon length and respective puncta area in relation to (d) Braak stages (p = 0.0083) and (e) Aβ deposition in the medial temporal lobe (Aβ MTL) (p = 0.006). Number of patients: Braak 0-II n = 7; Braak I-VI n = 5; Braak V-VI n = 5. One-way ANOVA with Tukey’s post-hoc test. Individual data points shown with bars representing mean ± SEM. (*p < 0.05). f, Representative images of MCH axons in CA1 hippocampal region showing aberrant morphology indicated by the large arrowhead near Aβ plaques labelled by 6E10 antibody and neurite with normal morphology indicated by smaller arrowheads, in AppNL-G-F and AD patient brain.
Extended Data Fig. 9
Extended Data Fig. 9. AppNL-G-F mice have an increased susceptibility to develop seizures.
a,b,c, Time taken by Wt and AppNL-G-F mice to reach seizure level score (see method section) in response to i.p. injection of PTZ (40 mg/kg) at (a) B state (beginning of light phase) (stage 4: Wt vs AppNL-G-F p = 0.035, stage 5: Wt vs AppNL-G-F p = 0.0008) and (b) SD (stage 4: Wt vs AppNL-G-F p = 0.0003, stage 5: Wt vs AppNL-G-F p = 0.0001) and (c) after RB sleep (stage 3: Wt vs AppNL-G-F p = 0.0001, stage 4: Wt vs AppNL-G-F p = 0.0001, stage 5: Wt vs AppNL-G-F p = 0.0001). Number of mice: 6 MO - B: Wt n = 10, AppNL-G-F n = 11; SD: Wt n = 8, AppNL-G-F n = 10; RB: Wt n = 9, AppNL-G-F n = 10. Two-way ANOVA, with Holm-Sidak post-hoc multiple comparisons test. Individual data points shown with bars representing mean ± SEM. (*p < 0.05, **p < 0.01, ***p < 0.001). d, Mean score of seizure reached by Wt and AppNL-G-F mice in response to i.p. injection of PTZ (40 mg/kg) at B, SD and RB sleep. Number of mice: 6 MO - B: Wt n = 10, AppNL-G-F n = 11; SD: Wt n = 8, AppNL-G-F n = 10; RB: Wt n = 9, AppNL-G-F n = 10 (p = 0.0117). One-way ANOVA with Tukey’s post-hoc test. Individual data points shown with bars representing mean ± SEM. (*p < 0.05).
Extended Data Fig. 10
Extended Data Fig. 10. Working model.
a, Schematic representation of the proposed working model.

References

    1. Busche MA, et al. Clusters of hyperactive neurons near amyloid plaques in a mouse model of Alzheimer’s disease. Science. 2008;321:1686–1689. doi: 10.1126/science.1162844. - DOI - PubMed
    1. Dickerson BC, et al. Increased hippocampal activation in mild cognitive impairment compared to normal aging and AD. Neurology. 2005;65:404–411. doi: 10.1212/01.wnl.0000171450.97464.49. - DOI - PMC - PubMed
    1. Baker J, Libretto T, Henley W, Zeman A. A longitudinal study of epileptic seizures in Alzheimer’s disease. Front. Neurol. 2019;10:1266. doi: 10.3389/fneur.2019.01266. - DOI - PMC - PubMed
    1. Zarhin D, et al. Disrupted neural correlates of anesthesia and sleep reveal early circuit dysfunctions in Alzheimer models. Cell Rep. 2022;38:110268. doi: 10.1016/j.celrep.2021.110268. - DOI - PMC - PubMed
    1. Lam AD, et al. Silent hippocampal seizures and spikes identified by foramen ovale electrodes in Alzheimer’s disease. Nat. Med. 2017;23:678–680. doi: 10.1038/nm.4330. - DOI - PMC - PubMed

Publication types

Substances