. 2023 May 16;22(1):84.
doi: 10.1186/s12943-023-01768-0.

Epigenetic reprogramming of Runx3 reinforces CD8 + T-cell function and improves the clinical response to immunotherapy

Affiliations

Epigenetic reprogramming of Runx3 reinforces CD8 + T-cell function and improves the clinical response to immunotherapy

Zongzhi Liu et al. Mol Cancer. .

Abstract

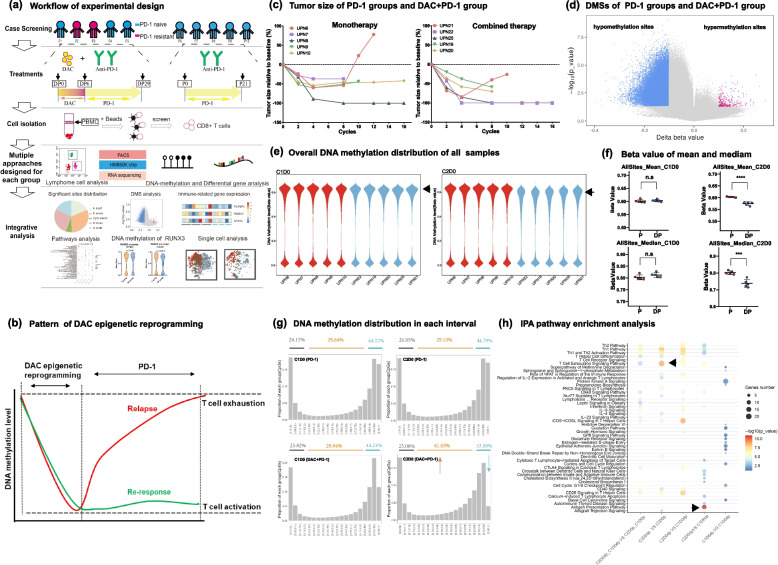
Background: Checkpoint blockade immunotherapy, represented by PD-1 or PD-L1 antibody treatment, has been of tremendous success in clinical practice. However, the low clinical response rate and lack of biomarkers for prediction of the immune response limit the clinical application of anti-PD-1 immunotherapy. Our recent work showed that a combination of low-dose decitabine and PD-1-ab significantly improved the complete response (CR) rate of cHL patients from 32 to 71%, which indicates that there is a significant correlation between epigenetic regulation and the clinical response to immunotherapy.

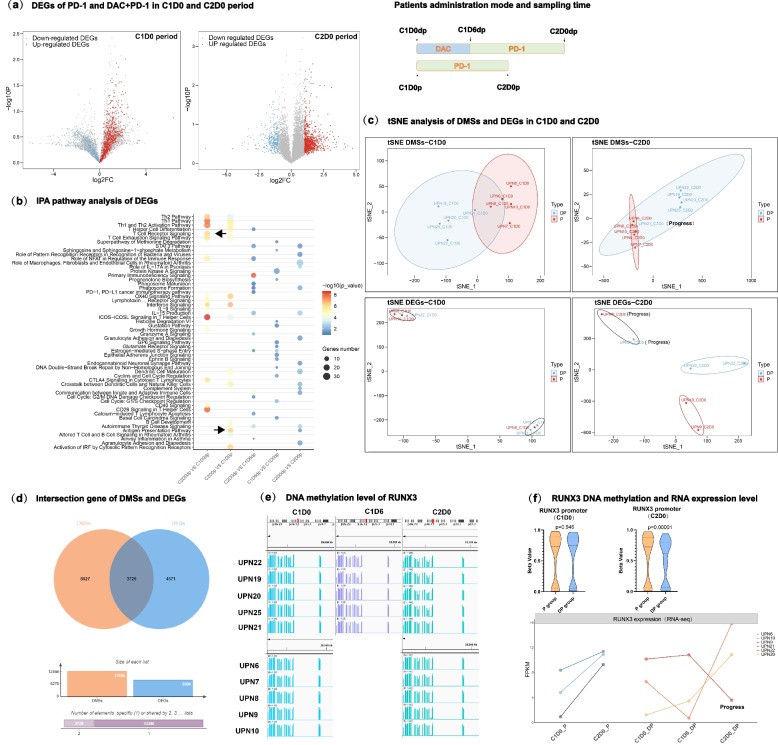
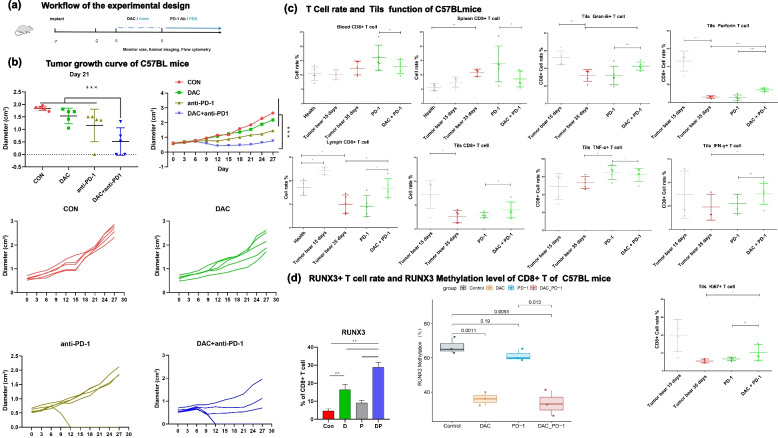
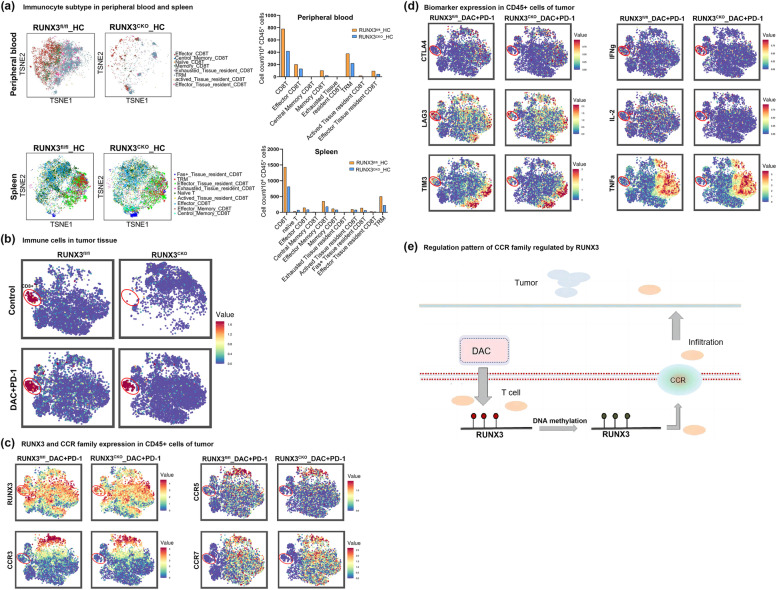
Methods: We recruited two groups of Hodgkin lymphoma patients who were treated with anti-PD-1 and DAC+anti-PD-1. CD8+ T cells were isolated from the patients' peripheral blood, DNA methylation was analyzed by EPIC, the expression profile was analyzed by RNA-seq, and multigroup analysis was performed with IPA and GSEA functional annotations. We explored the effect of DAC on the function of CD8+ T cells in the blood, spleen, tumor and lymph nodes using a mouse model. Furthermore, we explored the function of Tils in the tumor microenvironment. Then, we constructed Runx3-knockout mice to confirm the T-cell-specific function of Runx3 in CD8+ T cells and analyzed various subtypes of T cells and cytokines using mass cytometry (CyTOF).

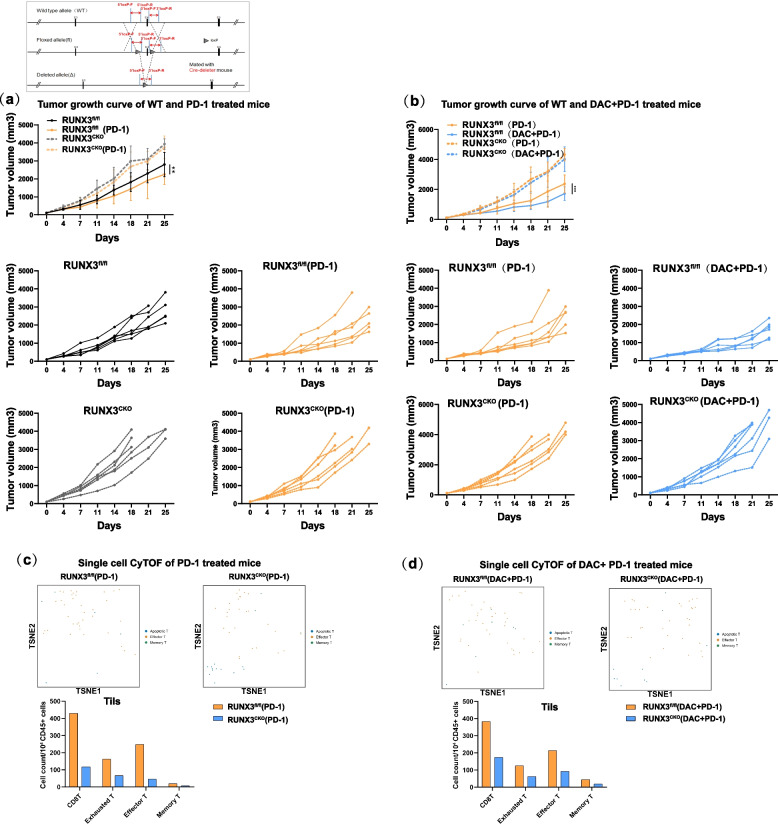
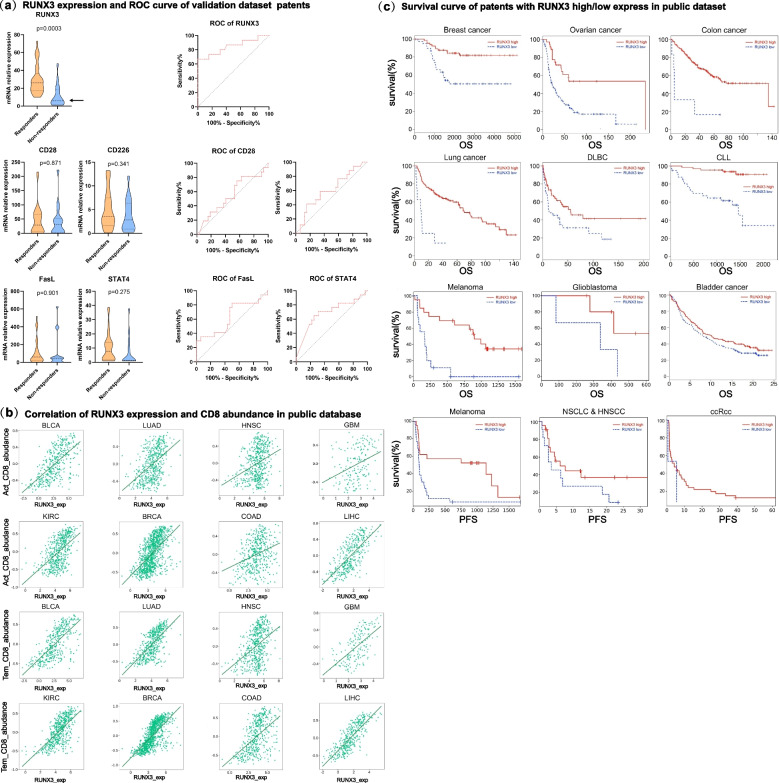
Results: Multiomics analysis identified that DNA methylation reprogramming of Runx3 was a crucial mediator of CD8+ T-cell function. Multiomics data showed that reversal of methylation of the Runx3 promoter promoted the infiltration of CD8+ TILs and mitigated the exhaustion of CD8+ T cells. Furthermore, experiments on tissue-specific Runx3-knockout mice showed that Runx3 deficiency reduced CD8+ T infiltration and the differentiation of effector T and memory T cells. Furthermore, Runx3 deficiency significantly decreased CCR3 and CCR5 levels. Immunotherapy experiments in Runx3 conditional knockout mice showed that DAC could not reverse the resistance of anti-PD-1 in the absence of Runx3. Moreover, both our clinical data and data from TISIDB showed that Runx3 could be a potential biomarker for immunotherapy to predict the clinical response rate.

Conclusion: We demonstrate that the DNA methylation of Runx3 plays a critical role in CD8+ T-cell infiltration and differentiation during decitabine-primed PD-1-ab immunotherapy, which provides a supporting mechanism for the essential role of epiregulation in immunotherapy.


Conflict of interest statement

The authors declare no competing interests.

Figures

Fig. 1
Fig. 1
DAC can trigger large-scale apparent reprogramming of CD8+ T cells. a Workflow of the experimental design including clinical sample collection and sequencing. b Schematic chart showing that DNA methylation reprogramming is correlated with clinical response and relapse. c Correlation analysis of tumor size and the anti-PD-1/DAC treatment cycles of patients. The patients were treated as indicated. Tumor size increase>50% were considered to indicate progression. d Analysis of genome-wide methylation variations in CD8 + T cells between the two indicated groups. The methylation was screened according to a |Diff beta value >0.1 and P< 0.05. Blue represents hypomethylation sites, and red represents hypermethylation sites. e Violin diagram showing the genome-wide methylation distribution of each patient. Red represents the monotherapy group, and blue represents the combined therapy group. The left panel is the baseline period of C1D0, and the right panel is the end of C2D0 treatment. f Statistical analysis of genome-wide DNA methylation levels. Upper panel: mean value of DNA methylation in the C1D0 and C2D0 periods; lower panel: median value of DNA methylation in the C1D0 and C2D0 periods (two-tailed unpaired t tests. n.s.: not significant, ***P < 0.001, ****P < 0.0001) g Distribution analysis of DNA methylation levels after anti-PD-1 or anti-PD-1/DAC. The DNA methylation value was divided into 20 sections from 0-1. A value < 0.15 was taken as the low methylation level, and a value > 0.85 was taken as the high methylation level. Upper panel: treated with anti-PD-1. Lower panel: treated with anti-PD1/DAC (left panel: before treatment; right panel: after treatment). h IPA pathway enrichment analysis. The input data are DMSs in each period. The size of the circle shows the number of enriched genes in each pathway, and the color depth represents the degree of enrichment
Fig. 2
Fig. 2
Expression profile and integrated multiomics analysis in CD8 + T cells identified important signaling pathways in response to DAC treatment. a The expression fold changes of DEGs increased at different stages. Left panel: Expression of differentially expressed genes in the C1D0 period in anti-PD-1-vs. anti-PD-1/DAC-treated patients. Right panel: Expression of differentially expressed genes in the C2D0 period in anti-PD1-vs. anti-PD-1/DAC-treated patients. Red indicates up-regulated genes, and blue indicates down-regulated genes. b IPA pathway enrichment analysis. The input data are the DEGs in each period. The size of the circle shows the number of enriched genes in each pathway, and the depth of the color represents the P-value of enrichment. c Workflow of the experimental design and tSNE analysis of DMSs and DEGs in the C1D0 and C2D0 periods. Blue represents the combined therapy group with DAC and anti-PD-1, and red represents the monotherapy group with anti-PD-1. Upper panel: tSNE analysis of DMSs. Lower panel: tSNE analysis of DEGs. d Intersecting gene analysis of DMSs and DEGs. Orange represent DMSs, and blue represents DEGs. e IGV showed Runx3 methylation levels in different patients at different stages. f Correlation of gene expression and the promoter methylation level of Runx3. Upper panel: Violin diagram showing the statistical analysis of the difference in methylation levels in the Runx3 promoter region. The figure shows the median, upper quartile and lower quartile. Two-tailed unpaired t tests. Lower panel: The expression levels of Runx3 in different periods were analyzed by a line diagram. The x-axis represents the period, and the y-axis represents the FPKM value
Fig. 3
Fig. 3
DAC downregulated T-cell exhaustion and upregulated T-cell infiltration by demethylating Runx3 and promoting Runx3 expression. a Workflow of the experimental design and analysis of the tumor growth curve using the MC38 mouse model treated with DAC, anti-PD-1 or DAC/anti-PD-1(n= ). b Tumor growth curve of mice treated with DAC, anti-PD-1 or anti-PD-1/DAC. Upperpanel: average tumor growth curves;(two-tailed unpaired t tests, *P <0.05, **P<0.01, ***P<0.001) c The proportions of GranB+, perforin+, TNF-α+, IFN-γ+, Ki67+ and CD8+ T cells were analyzed by flow cytometry. Samples were taken from the blood, spleen, tumor, or lymphocytes of MC38 mice treated with DAC, anti-PD1 or anti-PD-1/DAC as indicated. (n=5, two-tailed unpaired t tests, *P <0.05,**P <0.01***P < 0.001). d Leftpanel: The proportion of Runx3+CD8+ T cells in each group was analyzed by flow cytometry (n=5, two-tailed unpaired t tests, **P<0.01). Right panel: DNA methylation level change on Runx3 promoter in T cells treated with DAC, anti-PD-1 or antiPD-1/DAC. Y axis: Mehylation level of Runx3 (%); X axis: sampes of mice treated with DAC, anti-PD-1 or DAC/anti-PD-1. Triplicate samples were applied for each experiment and the median was shown as horizontal line within the box plots. (p<0.05)
Fig. 4
Fig. 4
The epigenetic sensitization effect of immunotherapy was eliminated in Runx3fl/fl;Lck-Cre mice. a Workflow of the construction of Runx3 conditional knockout mice and analysis of the tumor growth curve in Runx3fl/fl and Runx3fl/fl;Lck-Cre mice treated with anti-PD-1(n=5, two-tailed unpaired t tests, **P< 0.01). Upper panel: average tumor growth curves; lower panel: individual tumor growth curves. b Analysis of the tumor growth curve in Runx3fl/fl and Runx3fl/fl;Lck-Cre mice treated with anti-PD-1or DAC+ anti-PD-1(n=5,two-tailed unpaired t tests, **P<0.01). Upper panel: average tumor growth curves; lower panel: individual tumor growth curves. c tSNE analysis of immune cell subsets in the CD8+Tils of Runx3fl/fl and Runx3fl/fl;Lck-Cre mice treated with anti-PD-1. Upper panel: tSNE data showing the overall distribution of each subgroup. Lower panel: Histogram showing the absolute numbers of cells of various subtypes (cell number/104 CD45+ cells). d tSNE analysis of immune cell subsets in the CD8+ Tils of Runx3fl/fl and Runx3fl/fl;Lck-Cre mice treated with DAC+anti- PD-1. Upper panel: tSNE data showing the overall distribution of each subgroup. Lower panel: Histogram showing the absolute numbers of cells of various subtypes (cell number/104 CD45+ cells)
Fig. 5
Fig. 5
Runx3 deletion hampers CCRs expression and tumor infiltration of CD8+ T cells. a Determination of immune cell subsets in the peripheral blood and spleen of Runx3fl/fl and Runx3fl/fl;Lck-Cre (Runx3CKO)mice by tSNE analysis after mass cytometry. Left panel: tSNE data showing the overall distribution of each subgroup. Right panel: The histogram shows the absolute numbers of cells of various subtypes (cell number/104 CD45+ cells). b CD8+ T cells distribution in the tumor tissue of Runx3fl/fl and Runx3CKO mice by tSNE analysis. c tSNE plots showing Runx3 and CCRs expression of T cells after anti-PD-1/DAC treatment. The plots represented CD45+ immune cells in mice tumors, and the circle indicated CD8+ T cell population. d tSNE plots showing expression of marker genes of T cells after anti-PD-1/DAC treatment. The plots represented CD45+ immune cells in mice tumors, and the circle indicated CD8+ T cell population. e Schematic illustration showing that demethylation of Runx3 by DAC promoted CCRs expression and T-cell infiltration
Fig. 6
Fig. 6
Runx3 is a key molecular marker of the clinical response to immunotherapy. a Violin diagram showing the expression levels of Runx3, CD28, CD226, FasL and STAT4 in T cells in responders and nonresponders. The figure shows the median, upper quartile and lower quartile. Two-tailed unpaired t tests. b Correlation analysis between effector T cells, memory T cells and Runx3. The x-axis represents Runx3 expression in T cells, and the y-axis represents the abundance of memory T cells or effector T cells. c. Kaplan‒Meier survival curves between high and low expression of Runx3 in T cells and prognoses in different cancer types

Similar articles

Cited by

References

    1. Nie J, et al. Addition of low-dose decitabine to anti-PD-1 antibody camrelizumab in relapsed/refractory classical hodgkin lymphoma. J Clin Oncol. 2019;37:1479–1489. doi: 10.1200/JCO.18.02151. - DOI - PubMed
    1. Wang Y, et al. Low-dose decitabine priming endows CAR T cells with enhanced and persistent antitumour potential via epigenetic reprogramming. Nat Commun. 2021;12:409. doi: 10.1038/s41467-020-20696-x. - DOI - PMC - PubMed
    1. Esensten JH, et al. CD28 costimulation: from mechanism to therapy. Immunity. 2016;44:973–988. doi: 10.1016/j.immuni.2016.04.020. - DOI - PMC - PubMed
    1. Wei SC, et al. Fundamental mechanisms of immune checkpoint blockade therapy. Cancer Discov. 2018;8:1069–1086. doi: 10.1158/2159-8290.CD-18-0367. - DOI - PubMed
    1. Zhang Y, et al. Hijacking antibody-induced CTLA-4 lysosomal degradation for safer and more effective cancer immunotherapy. Cell Res. 2019;29:609–627. doi: 10.1038/s41422-019-0184-1. - DOI - PMC - PubMed

Publication types