

Construction of an endoplasmic reticulum stress-related signature in lung adenocarcinoma by comprehensive bioinformatics analysis
- PMID: 37189138
- PMCID: PMC10186720
- DOI: 10.1186/s12890-023-02443-2
Construction of an endoplasmic reticulum stress-related signature in lung adenocarcinoma by comprehensive bioinformatics analysis
Abstract
Background: Lung Adenocarcinoma (LUAD) is a major component of lung cancer. Endoplasmic reticulum stress (ERS) has emerged as a new target for some tumor treatments.
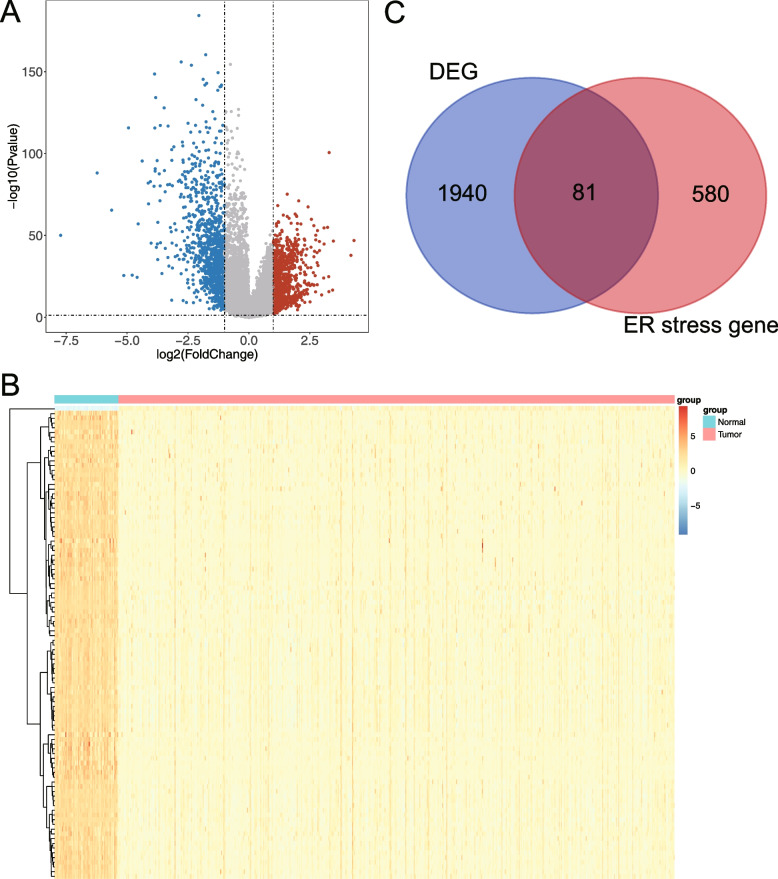
Methods: The expression and clinical data of LUAD samples were downloaded from The Cancer Genome Atlas (TCGA) and The Gene Expression Omnibus (GEO) database, followed by acquiring ERS-related genes (ERSGs) from the GeneCards database. Differentially expressed endoplasmic reticulum stress-related genes (DE-ERSGs) were screened and used to construct a risk model by Cox regression analysis. Kaplan-Meier (K-M) curves and receiver operating characteristic (ROC) curves were plotted to determine the risk validity of the model. Moreover, enrichment analysis of differentially expressed genes (DEGs) between the high- and low- risk groups was conducted to investigate the functions related to the risk model. Furthermore, the differences in ERS status, vascular-related genes, tumor mutation burden (TMB), immunotherapy response, chemotherapy drug sensitivity and other indicators between the high- and low- risk groups were studied. Finally, quantitative real-time polymerase chain reaction (qRT-PCR) was used to validate the mRNA expression levels of prognostic model genes.
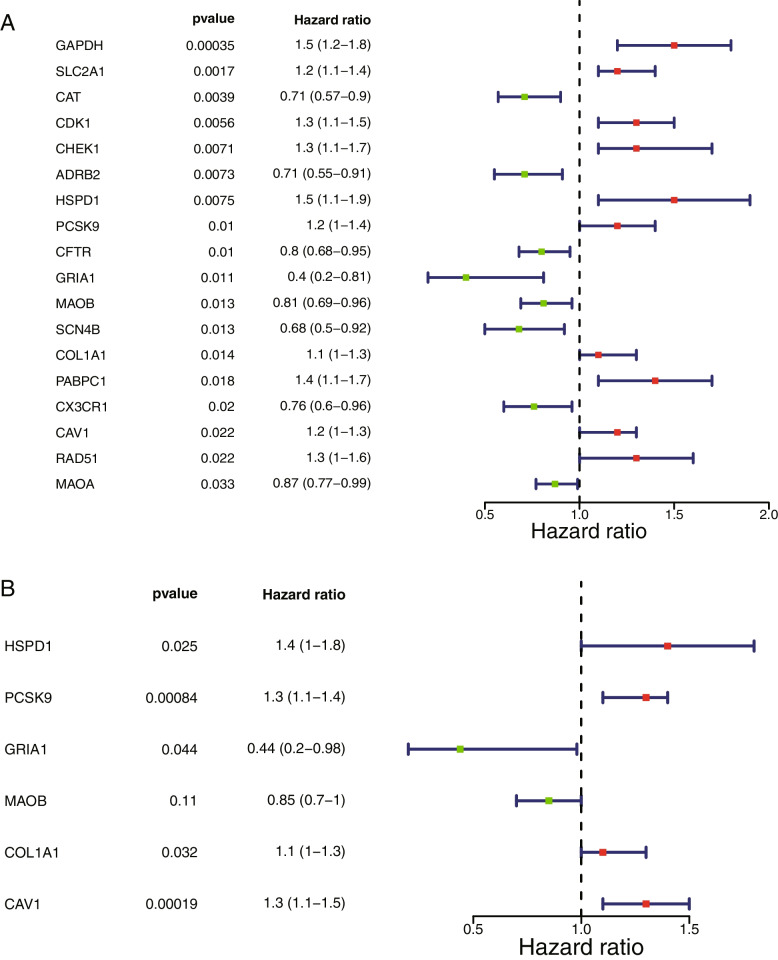
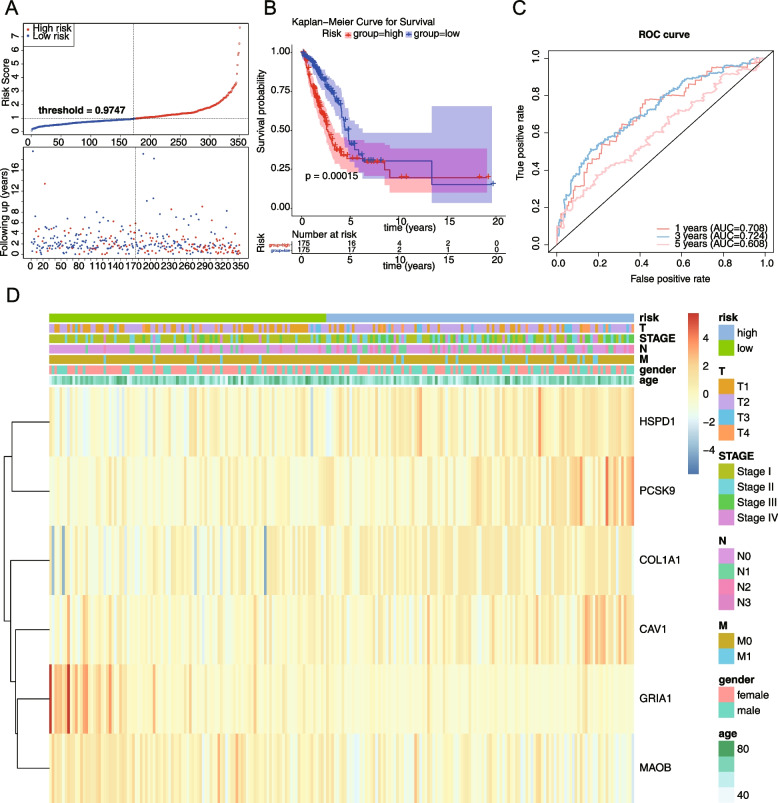
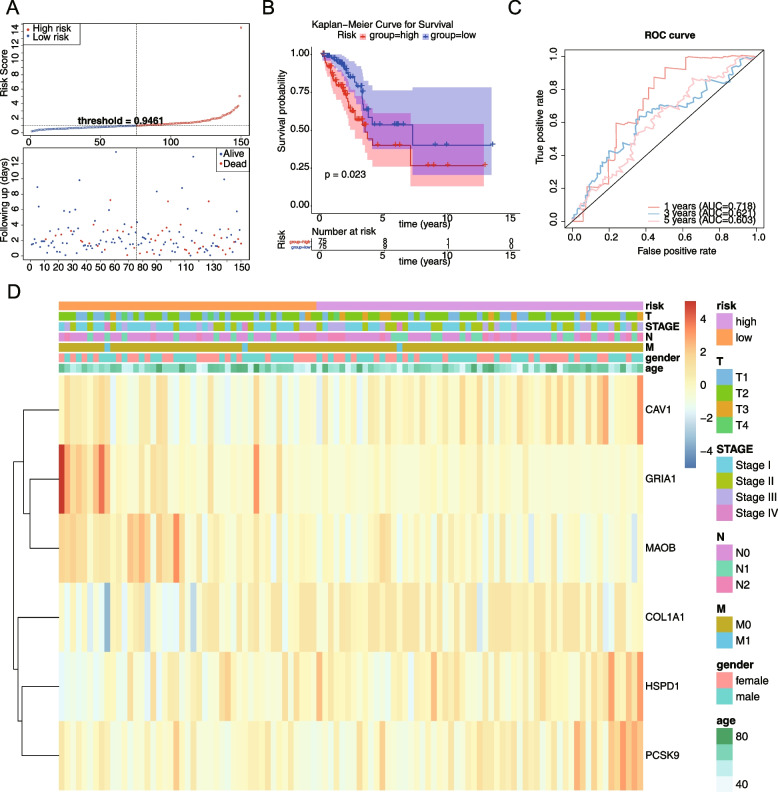
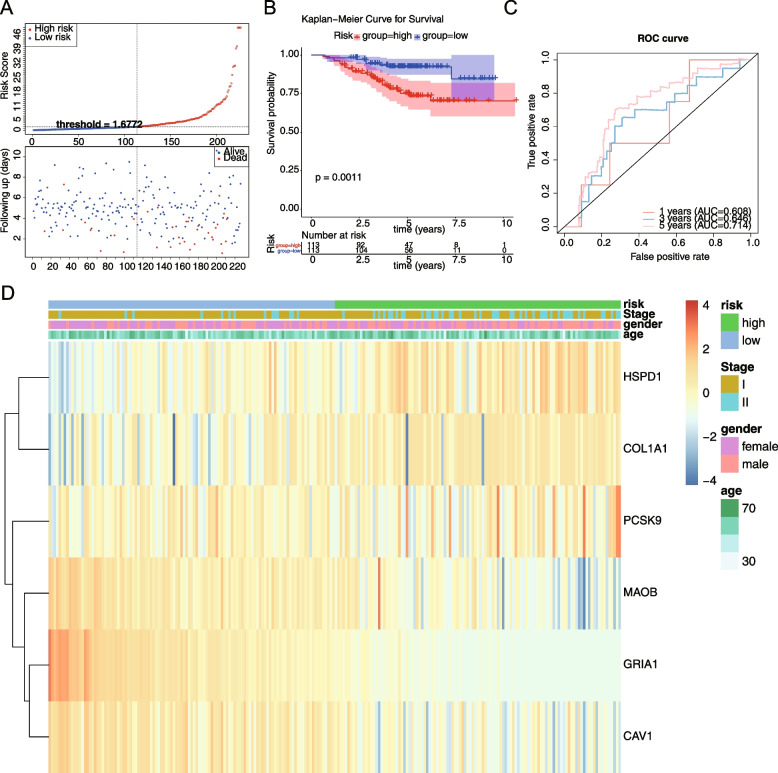
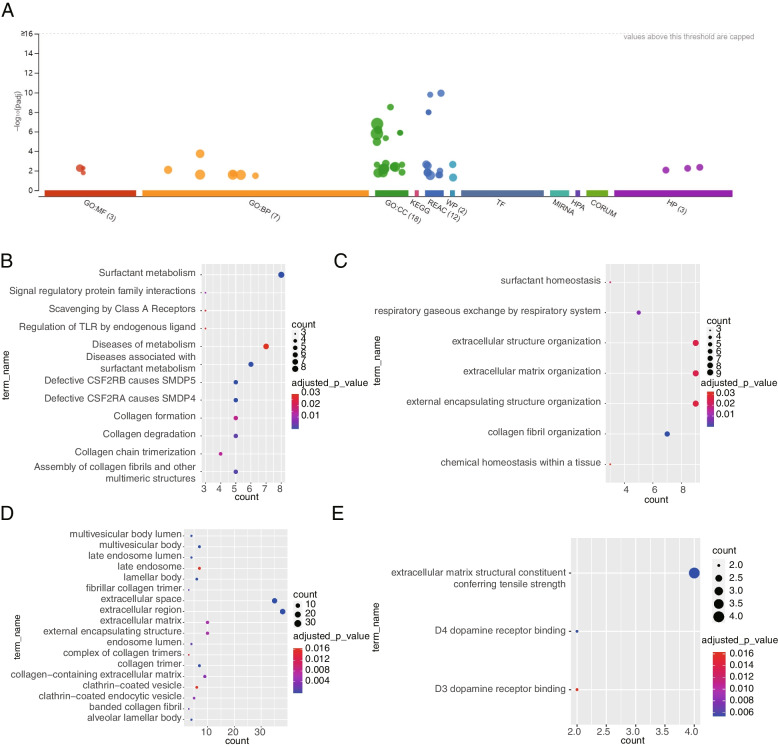
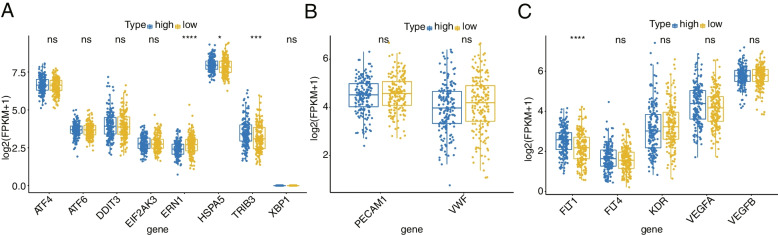
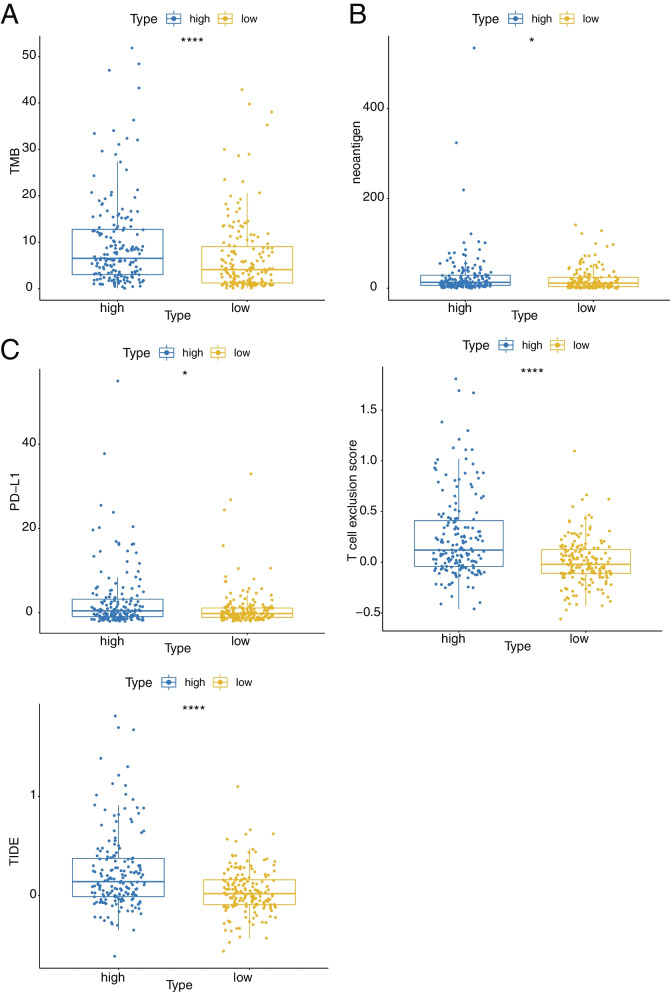
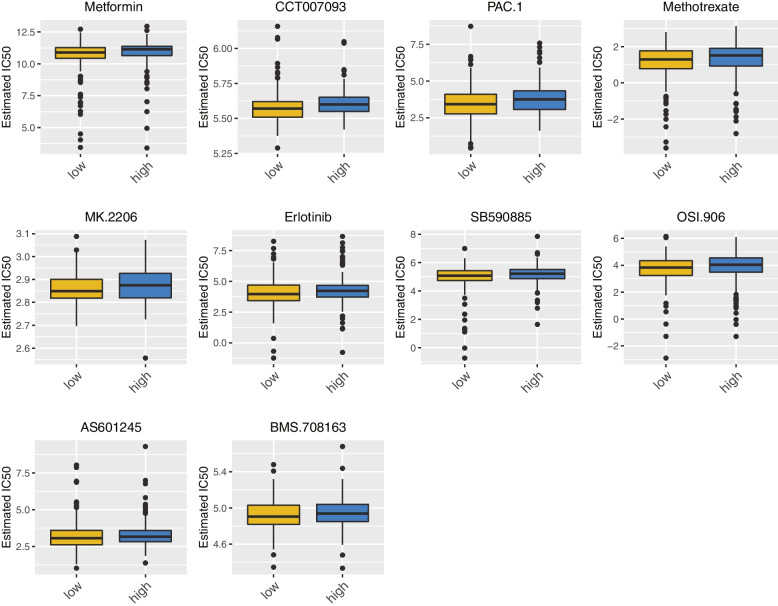
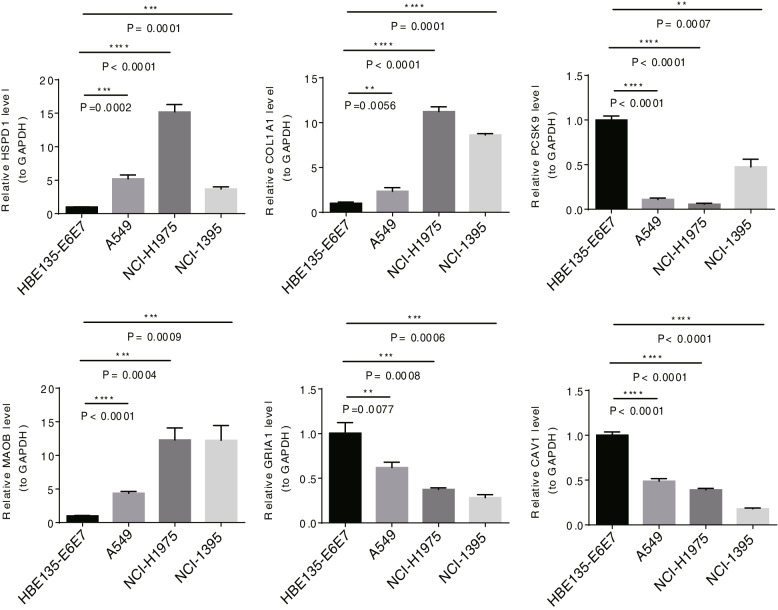
Results: A total of 81 DE-ERSGs were identified in the TCGA-LUAD dataset, and a risk model, including HSPD1, PCSK9, GRIA1, MAOB, COL1A1, and CAV1, was constructed by Cox regression analysis. K-M and ROC analyses showed that the high-risk group had a low survival, and the Area Under Curve (AUC) of ROC curves of 1-, 3- and 5-years overall survival was all greater than 0.6. In addition, functional enrichment analysis suggested that the risk model was related to collagen and extracellular matrix. Furthermore, differential analysis showed vascular-related genes FLT1, TMB, neoantigen, PD-L1 protein (CD274), Tumor Immune Dysfunction and Exclusion (TIDE), and T cell exclusion score were significantly different between the high- and low-risk groups. Finally, qRT-PCR results showed that the mRNA expression levels of 6 prognostic genes were consistent with the analysis.
Conclusion: A novel ERS-related risk model, including HSPD1, PCSK9, GRIA1, MAOB, COL1A1, and CAV1, was developed and validated, which provided a theoretical basis and reference value for ERS-related fields in the study and treatment of LUAD.
Keywords: Bioinformatics; Endoplasmic reticulum stress; Lung adenocarcinoma; Prognosis; Risk model.
© 2023. The Author(s).
Conflict of interest statement
The author has no conflicting interests to disclose with the content of this article.
Figures
Similar articles
-
Building endoplasmic reticulum stress-related LncRNAs signatures of lung adenocarcinoma.J Gene Med. 2024 Aug;26(8):e3731. doi: 10.1002/jgm.3731. J Gene Med. 2024. PMID: 39146558
-
Construction and validation of a prognostic model for lung adenocarcinoma based on endoplasmic reticulum stress-related genes.Sci Rep. 2022 Nov 18;12(1):19857. doi: 10.1038/s41598-022-23852-z. Sci Rep. 2022. PMID: 36400857 Free PMC article.
-
Construction and validation of a prognostic signature based on seven endoplasmic reticulum stress-related lncRNAs for patients with head and neck squamous cell carcinoma.Sci Rep. 2023 Dec 16;13(1):22414. doi: 10.1038/s41598-023-49987-1. Sci Rep. 2023. PMID: 38104177 Free PMC article.
-
Integrated multi-omic analysis and experiment reveals the role of endoplasmic reticulum stress in lung adenocarcinoma.BMC Med Genomics. 2024 Jan 2;17(1):12. doi: 10.1186/s12920-023-01785-4. BMC Med Genomics. 2024. PMID: 38167084 Free PMC article.
-
Prognostic Risk Signature and Comprehensive Analyses of Endoplasmic Reticulum Stress-Related Genes in Lung Adenocarcinoma.J Immunol Res. 2022 May 4;2022:6567916. doi: 10.1155/2022/6567916. eCollection 2022. J Immunol Res. 2022. PMID: 35571564 Free PMC article.
Cited by
-
The mechanism of RNA methylation writing protein-related prognostic genes in lung adenocarcinoma based on bioinformatics.Front Genet. 2025 Jun 2;16:1541541. doi: 10.3389/fgene.2025.1541541. eCollection 2025. Front Genet. 2025. PMID: 40529813 Free PMC article.
-
Gene signatures of endoplasmic reticulum stress and mitophagy for prognostic risk prediction in lung adenocarcinoma.IET Syst Biol. 2024 Jun;18(3):103-117. doi: 10.1049/syb2.12092. Epub 2024 May 30. IET Syst Biol. 2024. PMID: 38813617 Free PMC article.
-
Identification of potential biomarkers for lung adenocarcinoma: a study based on bioinformatics analysis combined with validation experiments.Front Oncol. 2024 Sep 19;14:1425895. doi: 10.3389/fonc.2024.1425895. eCollection 2024. Front Oncol. 2024. PMID: 39364312 Free PMC article.
-
Endoplasmic reticulum stress-related prognosis signature characterizes the immune landscape and predicts the prognosis of colon adenocarcinoma.Front Genet. 2025 Apr 1;16:1516232. doi: 10.3389/fgene.2025.1516232. eCollection 2025. Front Genet. 2025. PMID: 40236629 Free PMC article.
-
Targeting proprotein convertase subtilisin/kexin type 9 (PCSK9): from bench to bedside.Signal Transduct Target Ther. 2024 Jan 8;9(1):13. doi: 10.1038/s41392-023-01690-3. Signal Transduct Target Ther. 2024. PMID: 38185721 Free PMC article. Review.
References
-
- Siegel RL, Miller KD, Fuchs HE, et al. Cancer statistics, 2022. 2022;72(1):7-33. doi: 10.3322/caac.21708 - PubMed
-
- Shi JF, Wang L, Wu N, et al. Clinical characteristics and medical service utilization of lung cancer in China, 2005–2014: overall design and results from a multicenter retrospective epidemiologic survey. Lung Cancer (Amsterdam, Netherlands) 2019;128:91–100. doi: 10.1016/j.lungcan.2018.11.031. - DOI - PubMed
MeSH terms
Substances
LinkOut - more resources
Full Text Sources
Medical
Research Materials
Miscellaneous
