. 2023 Apr 10;12(8):1125.
doi: 10.3390/cells12081125.

Preclinical Studies with Glioblastoma Brain Organoid Co-Cultures Show Efficient 5-ALA Photodynamic Therapy

Affiliations

Preclinical Studies with Glioblastoma Brain Organoid Co-Cultures Show Efficient 5-ALA Photodynamic Therapy

Leire Pedrosa et al. Cells. .

Abstract

Background: The high recurrence of glioblastoma (GB) that occurs adjacent to the resection cavity within two years of diagnosis urges an improvement of therapies oriented to GB local control. Photodynamic therapy (PDT) has been proposed to cleanse infiltrating tumor cells from parenchyma to ameliorate short long-term progression-free survival. We examined 5-aminolevulinic acid (5-ALA)-mediated PDT effects as therapeutical treatment and determined optimal conditions for PDT efficacy without causing phototoxic injury to the normal brain tissue.

Methods: We used a platform of Glioma Initiation Cells (GICs) infiltrating cerebral organoids with two different glioblastoma cells, GIC7 and PG88. We measured GICs-5-ALA uptake and PDT/5-ALA activity in dose-response curves and the efficacy of the treatment by measuring proliferative activity and apoptosis.

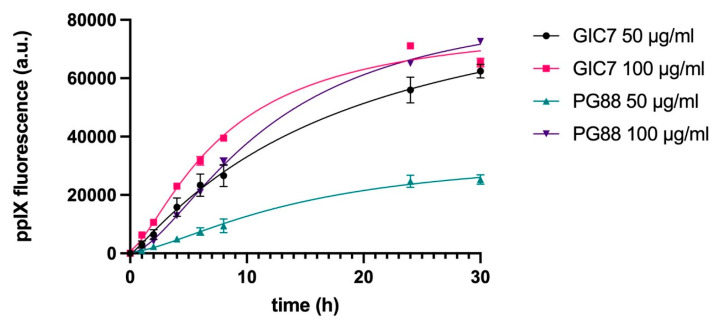
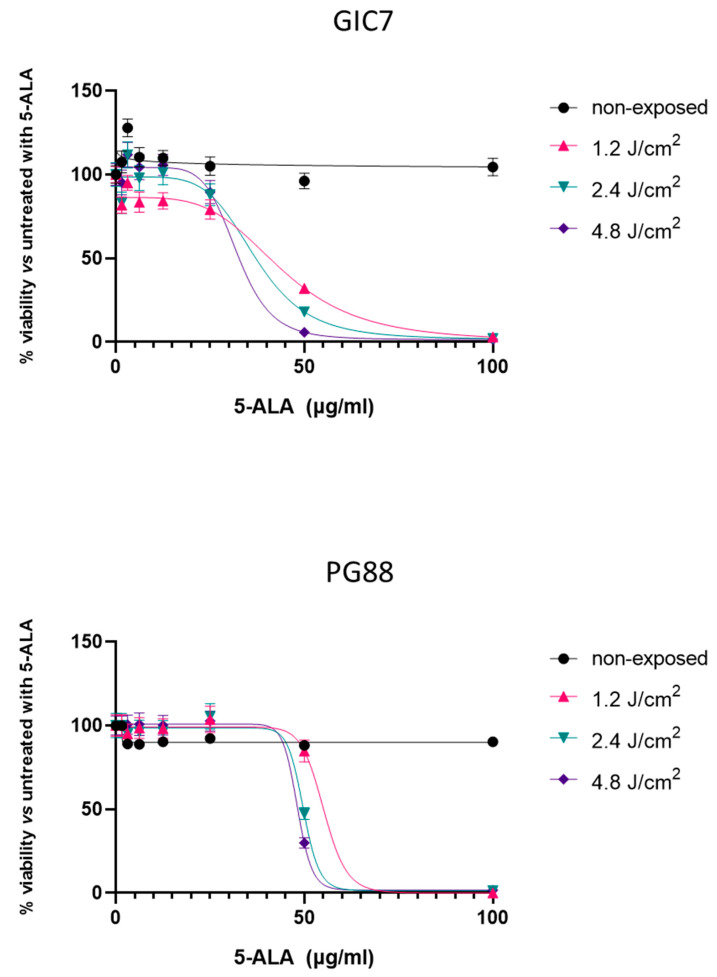
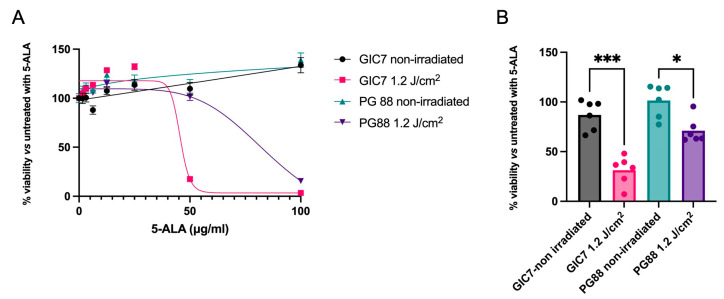
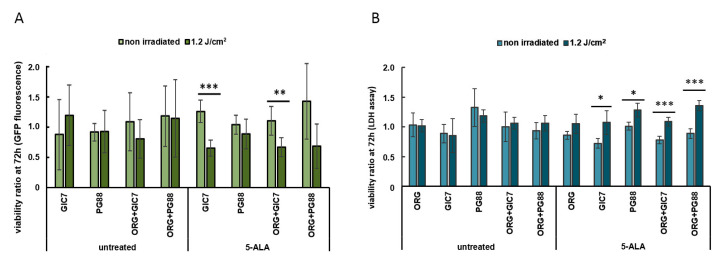
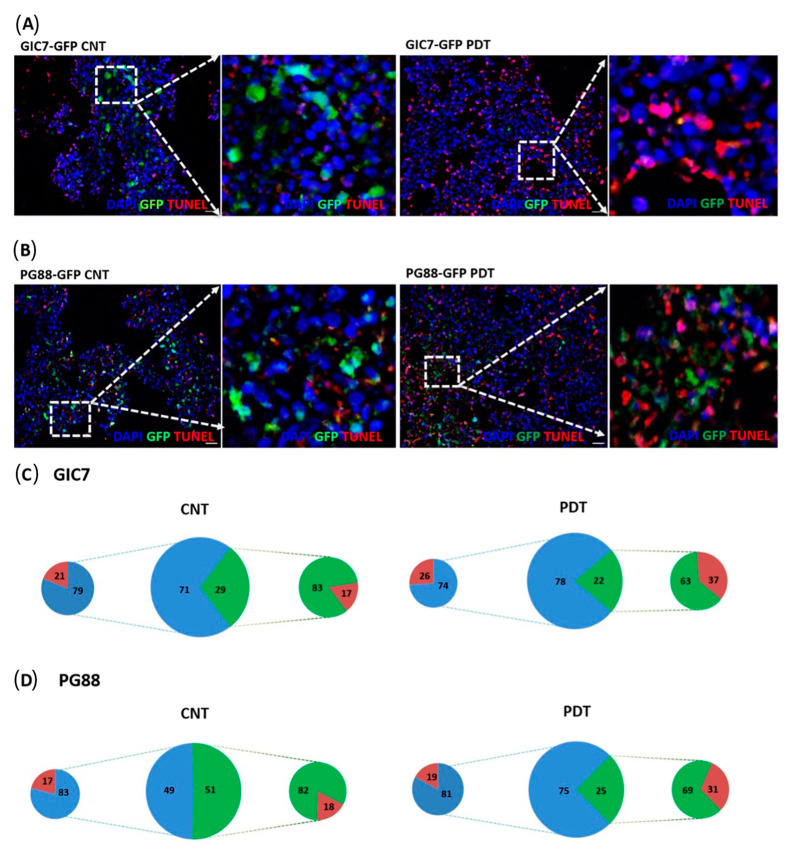
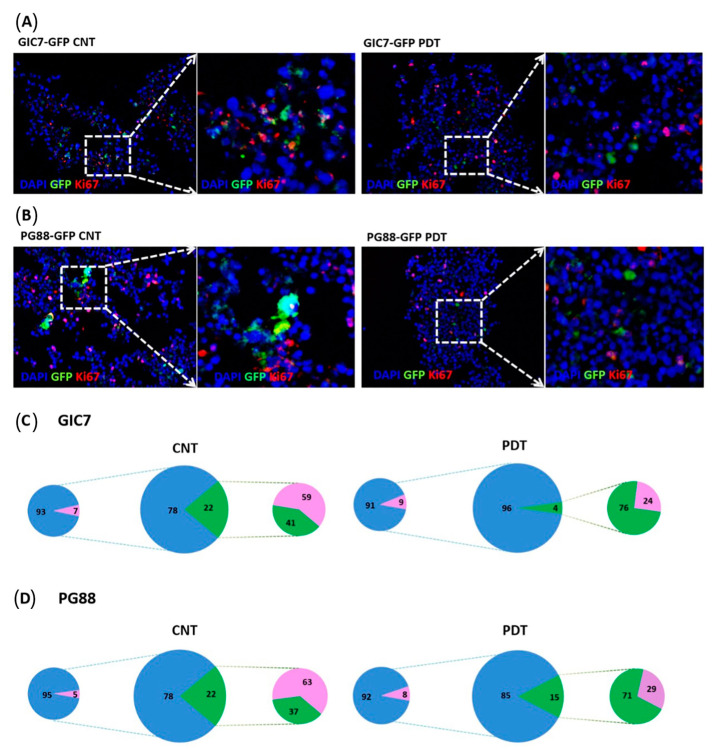
Results: 5-ALA (50 and 100 µg/mL) was applied, and the release of protoporphyrin IX (PpIX) fluorescence measures demonstrated that the emission of PpIX increases progressively until its stabilization at 24 h. Moreover, decreased proliferation and increased apoptosis corroborated the effect of 5-ALA/PDT on cancer cells without altering normal cells.

Conclusions: We provide evidence about the effectiveness of PDT to treat high proliferative GB cells in a complex in vitro system, which combines normal and cancer cells and is a useful tool to standardize new strategic therapies.

Keywords: 3D tumor models; 5-ALA; drug screening; glioblastoma; neurological cancers; organoids; personalized medicine; photodynamic therapy; spheroids.


Conflict of interest statement

Marc Centellas and Marta Muñoz-Tudurí are employees of Laboratorios Gebro Pharma S.A.; the rest of the authors declare no conflict of interest.

Figures

Figure 1
Figure 1
Schematic protocol of hiPSC cell cultures to induce neurocortical organoids and their co-culture with GFP-GICs. (A) Schematic protocol for neural induction of organoid cultures. The medium has been changed sequentially as indicated to obtain the different cell lineages. (B) On day 47, the GFP-GICs were seeded on top of the organoids to study their infiltration capacity on organoids. The obtained assembloid was followed by fluorescence microscopy until the end of the experiment when some of them were preserved for further histological analysis and confocal microscope imaging.
Figure 2
Figure 2
Immunofluorescence labeling of two differentiated organoids at day 43. The left panels show sections of organoids with blue nuclei stained with Fluoromount DAPI, scale Bar = 100 μm (10×). The dashed-line square represents the field visualized at higher magnification in the subsequent panels. The upper figures show the presence of neurons TUBB3 (red) and astrocytes GFAP (yellow). The bottom panels show oligodendrocytes O4 (red) and embryonic stem cells SOX2 (yellow). Scale bar 20 μm (40×).
Figure 3
Figure 3
Follow-up of organoid-GICs co-culture by microscope. (A) Co-culture of GFP-GIC7 seeded as tumorspheres on top of the cerebral organoid, followed by fluorescence microscopy. Images were obtained from 1 to 41 days of co-culture (DoC) with a Microscopy Olympus IX51 at 4× magnification. Scale bar 200 μm. (B) Brain organoids were engrafted with 2000 single GFP-GICs proneural (left) and 2000 single GFP-mesenchymal (right) 24 days after seeding cells, which had already been differentiating for 47 days. Images were obtained with the confocal microscope. Scale bar 500 μm.
Figure 4
Figure 4
Study of the tumor engraftment effectiveness. (A) Merge of fluorescence and phase-contrast images of GFP-GIC-organoid co-cultures at days 1, 4, 7, 15, and 21 after the engraftment (DoC). Both GFP-GIC7 (top panels) and GFP-PG88 (bottom panels), seeded as tumorspheres or as a single cell, as indicated, achieve infiltration of the organoid generating a viable tumor. Both GFP-GICs grew around and inside the organoid. Images at 4× obtained with Microscope Olympus IX51 are shown. Scale bar 200 μm. (B) Semi-quantitative analyses of tumor growth expressed as the mean of tumor area (GFP positive area), concerning the total organoid, evaluating GFP fluorescence of GFP-GIC7 (left) and GFP-PG88 (right) seeded as tumorspheres or single cells. To normalize the data and homogenize the different co-cultures, the initial GFP fluorescence on DoC 1 was used to evaluate each well and to compare the GFP area. The data are representative of the tumor engraftment effectiveness of both GFP-GICs. An ANOVA test was used to compare the means of 4 different conditions for every DoC and each situation for every DoC vs. the first DoC. DoC = Days of co-culture.
Figure 5
Figure 5
Kinetic study of PpIX emission of GICs. Both GIC7 and PG88 tumorspheres were treated at 50 and 100 µg/mL of 5-ALA and PpIX fluorescence was analyzed. Results show the mean ± SE of three independent experiments (n = 3) performed in triplicate and measured periodically until 30 h after 5-ALA administration.
Figure 6
Figure 6
GIC7 (top) and PG88 (bottom) cell viability under different conditions of photodynamic therapy. The plot is representative of three independent experiments performed in both adherent cells in quadruplicate. Irradiation was applied at 1.2–4.8 J/cm2. The percentage of cell viability after 5-ALA treatment (0–100 µg/mL) was calculated with regard to control cells without treatment.
Figure 7
Figure 7
Comparison of GIC7 and PG88 cells’ behavior under 5-ALA treatment (0–100 µg/mL) and irradiation. (A) Dose-response comparison of adherent cell cultures with different 5-ALA concentrations treated with 1.2 J/cm2 irradiation. (B) Cell viability comparison between GIC7 and PG88 tumorspheres under 5-ALA 50 µg/mL and 1.2 J/cm2 irradiation. Results are representative of three independent experiments (n = 3) performed in triplicate. * p value < 0.05; *** p value < 0.005.
Figure 8
Figure 8
Cell viability after PDT of tumorspheres alone and co-cultured with brain organoids. (A) GICs viability after 72h post-irradiation using the GFP fluorescence ratio between each endpoint and time 0. (B) Global cell viability considering the ratio between the LDH release at 72 h post-irradiation and at time 0. Results are the mean ± SE of two independent experiments (n = 2) performed using six replicates. * p < 0.05, ** p < 0.01, *** p < 0.005.
Figure 9
Figure 9
Tunel analysis of GFP-GICs and organoid co-culture. Tunel of GIC7-organoid co-cultures (A) and PG88-organoid co-cultures with 5-ALA (B) no treated (CNT) (left panels) or treated (right panels) with photodynamic therapy (50 µg/mL with 5-ALA, 1.2 J/cm2 irradiation). At 20× (big squares), the scale bar is 20 µm. 5-ALA controls (GIC7-GFP CNT or PG88-GFP CNT) without PDT and PDT-treated (GIC7-GFP PDT or PG88-GFP PDT) visualizing the red TdT-DIG-rhd cells and apoptotic bodies accumulated more in treated tissue at the tumor areas (green fluorescent cells) than in 5-ALA-controls (blue). Few apoptotic cells were scattered in non-infiltrated brain-organoid tissue (blue) in both 5-ALA-control and PDT-treated co-cultures. Blue DAPI-stained nuclei were used to counterstain cells. Semi-quantitative analysis of samples: GIC7 5-ALA CNT, 12 fields from 2 samples; GIC7 PDT-treated, 19 fields from 3 samples; PG88-5-ALA CNT, 7 fields from 2 samples and PG88 PDT-treated, 17 fields from 3 samples, was done. Semi-quantitative analysis is represented as a percentage average of positive cells on (C,D) pictures: green color (GFP-GICs cells), blue organoid cells, and red TdT-DIG-rhd positive cells; comparing controls (left part) and PDT samples (right part). Significant differences between GIC7-5-ALA CNT and GIC7-PDT-treatment (p = 0.0001) and between PG88-5-ALA CNT and PG88-PDT-treatment (p < 0.001) were found. (C) Cell counts show similar TdT-positive cells in organoid areas surrounding tumors (normal cells) and more TdT-positive cells in treated organoids than untreated samples (D).
Figure 10
Figure 10
Proliferation study of GFP-GICs and organoids co-culture by Ki67. GIC7 and PG88-organoid co-cultures treated or not with PDT based on 5-ALA uptake after 5-ALA 50µg/mL treatment or medium alone. Fixed tissues were sliced at 12 µm to perform IF analysis with anti-Ki67 antibody (pink staining), scale bars 20 µm. Green fluorescent GICs infiltrated the organoid (green color), GIC7 (A) and PG88 (B) 5-ALA controls (left panels) show less positive pink nuclei (amplified in the small square at right) than PDT treated co-cultures (besides and amplified at right panels). Blue DAPI-stained nuclei were used to counterstain cells. Semiquantitative analysis of Ki67 positive cells was performed from: GIC7-5-ALA CNT, 7 fields from 1 sample; GIC7-PDT treated, 13 fields from 2 samples; PG88-5-ALA CNT, 8 fields from 1 sample and PG88-PDT treated, 11 fields from 2 samples. Results as a percentage average of positive cells are represented in (C,D) pictures: green color (GFP-GICs cells), blue DAPI-stained nuclei, and pink Ki67 positive cells; comparing controls (left part) and PDT samples (right part). Significant differences between GIC7-5-ALA CNT and GIC7-PDT-treatment (p = 0.0001) and between PG88-5-ALA CNT and PG88-PDT-treatment (p < 0.01) were found.

References

    1. Louis D.N., Perry A., Wesseling P., Brat D.J., Cree I.A., Figarella-Branger D., Hawkins C., Ng H.K., Pfister S.M., Reifenberger G., et al. The 2021 WHO Classification of Tumors of the Central Nervous System: A summary. Neuro Oncol. 2021;23:1231–1251. doi: 10.1093/neuonc/noab106. - DOI - PMC - PubMed
    1. Thakkar J.P., Dolecek T.A., Horbinski C., Ostrom Q.T., Lightner D.D., Barnholtz-Sloan J.S., Villano J.L. Epidemiologic and Molecular Prognostic Review of Glioblastoma. Cancer Epidemiol. Biomark. Prev. 2014;23:1985–1996. doi: 10.1158/1055-9965.EPI-14-0275. - DOI - PMC - PubMed
    1. Stupp R., Hegi M.E., Mason W.P., van den Bent M.J., Taphoorn M.J.B., Janzer R.C., Ludwin S.K., Allgeier A., Fisher B., Belanger K., et al. Effects of radiotherapy with concomitant and adjuvant temozolomide versus radiotherapy alone on survival in glioblastoma in a randomised phase III study: 5-year analysis of the EORTC-NCIC trial. Lancet Oncol. 2009;10:459–466. doi: 10.1016/S1470-2045(09)70025-7. - DOI - PubMed
    1. Stupp R., Mason W.P., van den Bent M.J., Weller M., Fisher B., Taphoorn M.J.B., Belanger K., Brandes A.A., Marosi C., Bogdahn U., et al. Radiotherapy plus concomitant and adjuvant temozolomide for glioblastoma. N. Engl. J. Med. 2005;352:987–996. doi: 10.1056/NEJMoa043330. - DOI - PubMed
    1. Diksin M., Smith S., Rahman R. The Molecular and Phenotypic Basis of the Glioma Invasive Perivascular Niche. Int. J. Mol. Sci. 2017;18:2342. doi: 10.3390/ijms18112342. - DOI - PMC - PubMed

Publication types

Substances