. 2023 Apr 14;12(8):1160.
doi: 10.3390/cells12081160.

PARP1 Regulates Circular RNA Biogenesis though Control of Transcriptional Dynamics

Affiliations

PARP1 Regulates Circular RNA Biogenesis though Control of Transcriptional Dynamics

Rebekah Eleazer et al. Cells. .

Abstract

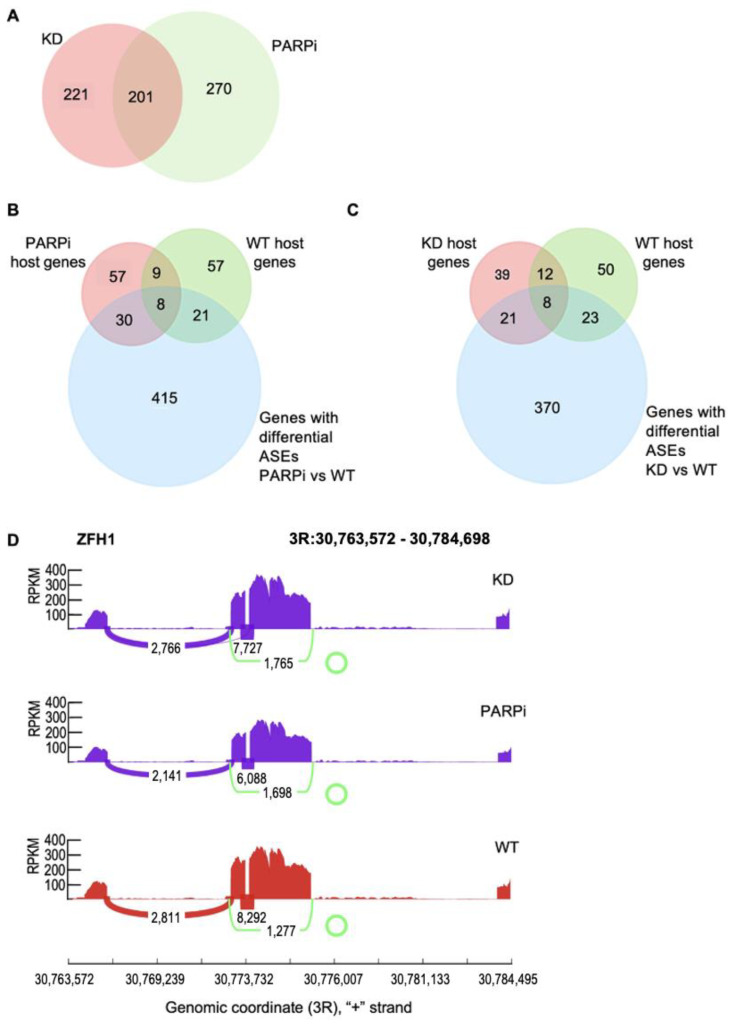
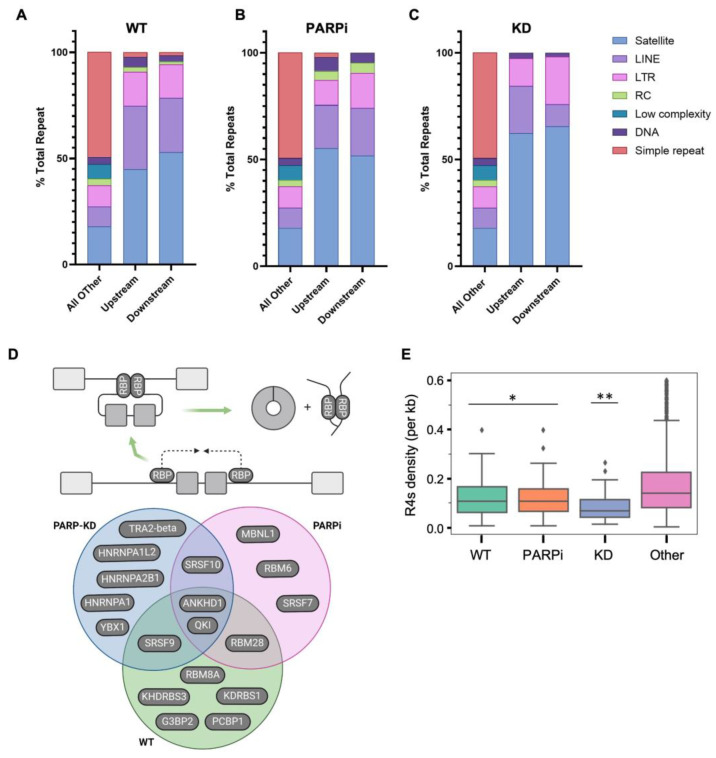
Circular RNAs (circRNAs) are a recently discovered class of RNAs derived from protein-coding genes that have important biological and pathological roles. They are formed through backsplicing during co-transcriptional alternative splicing; however, the unified mechanism that accounts for backsplicing decisions remains unclear. Factors that regulate the transcriptional timing and spatial organization of pre-mRNA, including RNAPII kinetics, the availability of splicing factors, and features of gene architecture, have been shown to influence backsplicing decisions. Poly (ADP-ribose) polymerase I (PARP1) regulates alternative splicing through both its presence on chromatin as well as its PARylation activity. However, no studies have investigated PARP1's possible role in regulating circRNA biogenesis. Here, we hypothesized that PARP1's role in splicing extends to circRNA biogenesis. Our results identify many unique circRNAs in PARP1 depletion and PARylation-inhibited conditions compared to the wild type. We found that while all genes producing circRNAs share gene architecture features common to circRNA host genes, genes producing circRNAs in PARP1 knockdown conditions had longer upstream introns than downstream introns, whereas flanking introns in wild type host genes were symmetrical. Interestingly, we found that the behavior of PARP1 in regulating RNAPII pausing is distinct between these two classes of host genes. We conclude that the PARP1 pausing of RNAPII works within the context of gene architecture to regulate transcriptional kinetics, and therefore circRNA biogenesis. Furthermore, this regulation of PARP1 within host genes acts to fine tune their transcriptional output with implications in gene function.

Keywords: RNA polymerase II elongation and pausing; backsplicing; circRNAs; gene architecture; poly (ADP-ribose) polymerase; splicing; transcription elongation.


Conflict of interest statement

The authors declare no conflict of interest. The funders had no role in the design of the study; in the collection, analyses, or interpretation of data; in the writing of the manuscript; or in the decision to publish the results.

Figures

Figure 1
Figure 1
Detection of circRNAs in paired-end sequencing data from total RNA using seekCRIT. (A) Western blot analysis of PARP1 depletion by siRNA. β-actin used as loading control. (B) Schematic representation of seekCRIT computational pipeline [18]. (C) Number of intronic circRNAs and exonic circRNAs (“backsplice junctions”), discovered by seekCRIT and the host genes they come from in the various experimental conditions. (D) Overlap of circRNAs between WT, PARPi, and PARP KD conditions. (E) Overlap of the circRNA-producing genes (host genes) between WT, PARPi, and PARP KD conditions.
Figure 2
Figure 2
Gene regulation mediated by PARP1 and PARylation. (A) Volcano plots showing differentially expressed genes in PARPi and PARP KD vs. WT conditions. Y-axis is -log p-value and x-axis is the log2 value of the fold change. Each dot represents one gene. Black dot represents no significant difference, pink represents p < 0.05, red dot represents q value < 0.05. (B) Venn diagram showing the DEGs that overlap between PARP KD (pink) compared to inhibition of its PARylation activity (green). (C) Venn diagram showing PARPi host genes (red) compared with WT host genes (green) and genes differentially expressed in PARPi (blue). (D) Venn diagram of PARP KD host genes (red), WT host genes (green), and genes differentially expressed in PARPi (blue). Numbers depicted in the intersections between circles represent the numbers of genes that are commonly regulated in two, three, or four conditions. (E,F) Top 20 enriched GO biological processes ranked by significance for PARP1 (E) and PARP KD (F).
Figure 3
Figure 3
Global alternative splicing events mediated by PARP1 and PARylation. (A) Venn diagram showing the differentially spliced genes detected by MATS in PARP1 knockdown compared to PARylation inhibition (PARPi). (B) Venn diagram of the host genes of the circRNAs generated in WT and PARPi over the differentially spliced events in PARPi compared to WT conditions (p < 0.01, by Student’s t-test). (C) Venn diagram of the host genes of the circRNAs generated in WT and PARP KD over the differentially spliced events in PARP1 KD compared to WT conditions. PARP1-mediated ASEs (alternative splicing events) detected by rMATs (p < 0.01, by Student’s t-test). (D) Sashimi plots of one example of a host gene, ZFH1, showing alternative splicing events and circRNAs formed in each condition.
Figure 4
Figure 4
Prediction of PARP1 and PARylation circRNA–miRNA–mRNA regulatory network. Dot plot comparison of differential GO biological processes regulated by predicted circRNA–microRNA interactions for circRNAs unique for WT (column 1), PARPi (column 2), and PARP1 KD (column 3). The most frequent miRNA targets in each experimental circRNA group were identified from miRTarBase (Release 9.0) [24] relative to human miRNA seeds. The target functional annotation was completed using clusterProfiler.
Figure 5
Figure 5
Linear architecture of circRNA host genes is altered upon PARP1 disruption. (A) Schematic diagram describing the influence of transcriptional space and time on backsplicing. Boxes represent exons, lines represent introns, factors regulating transcriptional space are green, RNAPII is red. Repeat elements and RBPs in flanking introns bring backsplice sites into close physical proximity to promote backsplicing. The prolonged time it takes for RNAPII to travel to a downstream acceptor provides a window of opportunity for backsplicing to occur. (B) Mean length of WT (green), PARPi (purple), PARP KD (orange) host gene lengths compared to other Drosophila genes (yellow) (* p < 0.01 vs. Other). (C) Lengths of upstream introns (pink), downstream introns (green), and internal introns (teal) compared to other Drosophila introns (purple) in WT (left), PARPi (middle), and PARP KD (right). (D) Bar graph highlighting the difference in upstream vs. downstream intron lengths (bp) in WT (green), PARPi (pink), and PARP KD (teal). Students t-test comparing upstream to downstream (* p < 0.05, error bars represent SEM). (E) Lengths of exons in WT (blue), PARPi (teal), and PARP KD (green) compared to other Drosophila exons (orange). (F) Table summarizing the mean lengths shown in the figures.
Figure 6
Figure 6
Flanking introns are differentially enriched for elements that regulate transcriptional space. The flanking introns of circRNA host genes were differentially enriched with repeat elements. Repeat elements enriched in wild type (A), PARPi (B), and PARP KD (C) upstream and downstream flanking introns compared to other Drosophila introns by type. (D) Venn diagram comparing RBP motifs significantly enriched (p < 0.05) within both flanking introns of WT, PARPi, and PARP KD. The presence of unique sets of RBP motifs in flanking introns suggests PARP1 circRNAs are regulated by different pathways. (E) Box and whisker plot showing the density of R4 G-quadruplexes in WT, PARPi, and KD host genes compared to other Drosophila genes. The results (bar graph) are represented as mean plus SEM (n ≥ 3; Student’s t-test, * p < 0.05, ** p < 0.05). The G-quadruplexes in the host genes and other Drosophila genes were identified using quadparser [26].
Figure 7
Figure 7
circRNA host genes in PARP KD exhibit distinct pausing profiles compared to WT circRNA host genes. NET-seq data were used to measure RNAPII pausing in WT and PARP KD conditions. Pausing was measured at exons (boxes) and 300 bp upstream and downstream of exons (solid lines). For each set of host genes, pausing within gene bodies was measured at exon 1 (E1) upstream of circRNA exons, the circRNA acceptor exon (A), the circRNA internal exons (I), the circRNA donor exon (D), and the exon downstream of the circRNA region (dsE). (A) RNAPII accumulates early in WT host genes (top) compared to pausing within PARP KD host genes (bottom) where RNAPII stalls at the dsE. (BD) Bar chart showing a side-by-side comparison of the differences in RNAPII accumulation at specific host gene regions as described in (A). The differences in RNAPII pausing upstream of the acceptor and acceptor regions of the circRNA are shown in (B), while (C) and (D) show differences in RNAPII pausing internal to the circRNA and downstream of the donor exon of the circRNA, respectively. (E,F) The change in RNAPII pausing within WT (E) and PARP KD (F) host genes upon PARP1 depletion.
Figure 8
Figure 8
PARP1 fine tunes host gene transcriptional output through RNAPII pausing within host gene introns. (A) Schematic diagram of the NanoString codeset design. RNA transcripts are detected with complementary capture and reporter probes designed to hybridize the linear splice and circular backsplice junctions, respectively, for each host gene. Transcripts from ribosomal-depleted paired-end RNA-seq were counted via a unique fluorescent barcode assigned to each reporter probe. (BD) Volcano plots showing the logFC of host gene expression due to PARPi (B), KD (C), and PARPi + KD combination treatment (D). Each dot represents either an mRNA or a circRNA transcript. Gray dots logFC < 2, p > 0.05; blue dots logFC > 2, p < 0.05. The log fold change of the circular transcripts was plotted against the log fold change of the linear mRNA for each host gene in PARPi (E), KD (F), and PARPi + KD combination treatment (G). (H) Pie charts showing the proportion of host genes with increased pausing (pink), decreased pausing (green), or no change in pausing (purple) within introns (left) or exons (right) upon KD. (I) Stacked bar graph showing the change in pausing within exons or introns of host genes. Host genes with increased circular to linear (C:L) ratio were compared to host genes with decreased C:L ratio.

Similar articles

Cited by

References

    1. Wang Y., Luo W., Wang Y. PARP-1 and its associated nucleases in DNA damage response. DNA Repair. 2019;81:102651. doi: 10.1016/j.dnarep.2019.102651. - DOI - PMC - PubMed
    1. Mahadevan J., Jha A., Rudolph J., Bowerman S., Narducci D., Hansen A.S., Luger K. Dynamics of endogenous PARP1 and PARP2 during DNA damage revealed by live-cell single-molecule imaging. iScience. 2023;26:105779. doi: 10.1016/j.isci.2022.105779. - DOI - PMC - PubMed
    1. Liu C., Vyas A., Kassab M.A., Singh A.K., Yu X. The role of poly ADP-ribosylation in the first wave of DNA damage response. Nucleic Acids Res. 2017;45:8129–8141. doi: 10.1093/nar/gkx565. - DOI - PMC - PubMed
    1. Kamaletdinova T., Fanaei-Kahrani Z., Wang Z.Q. The Enigmatic Function of PARP1: From PARylation Activity to PAR Readers. Cells. 2019;8:1625. doi: 10.3390/cells8121625. - DOI - PMC - PubMed
    1. Krishnakumar R., Kraus W.L. The PARP side of the nucleus: Molecular actions, physiological outcomes, and clinical targets. Mol. Cell. 2010;39:8–24. doi: 10.1016/j.molcel.2010.06.017. - DOI - PMC - PubMed

Publication types