

Single-Cell Transcriptome Analysis Revealed Heterogeneity and Identified Novel Therapeutic Targets for Breast Cancer Subtypes
- PMID: 37190091
- PMCID: PMC10137100
- DOI: 10.3390/cells12081182
Single-Cell Transcriptome Analysis Revealed Heterogeneity and Identified Novel Therapeutic Targets for Breast Cancer Subtypes
Abstract
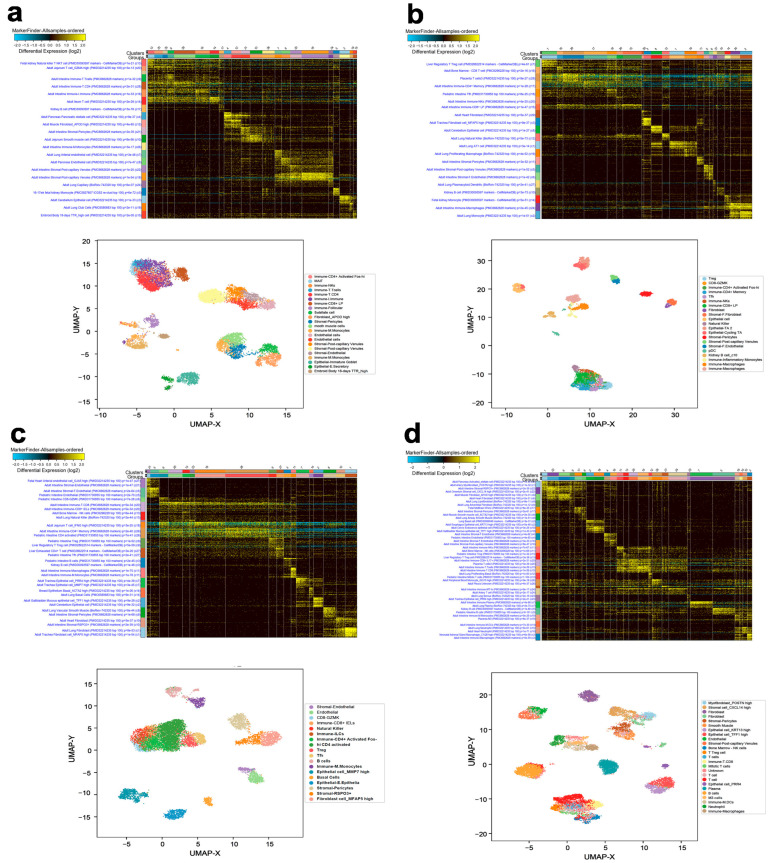
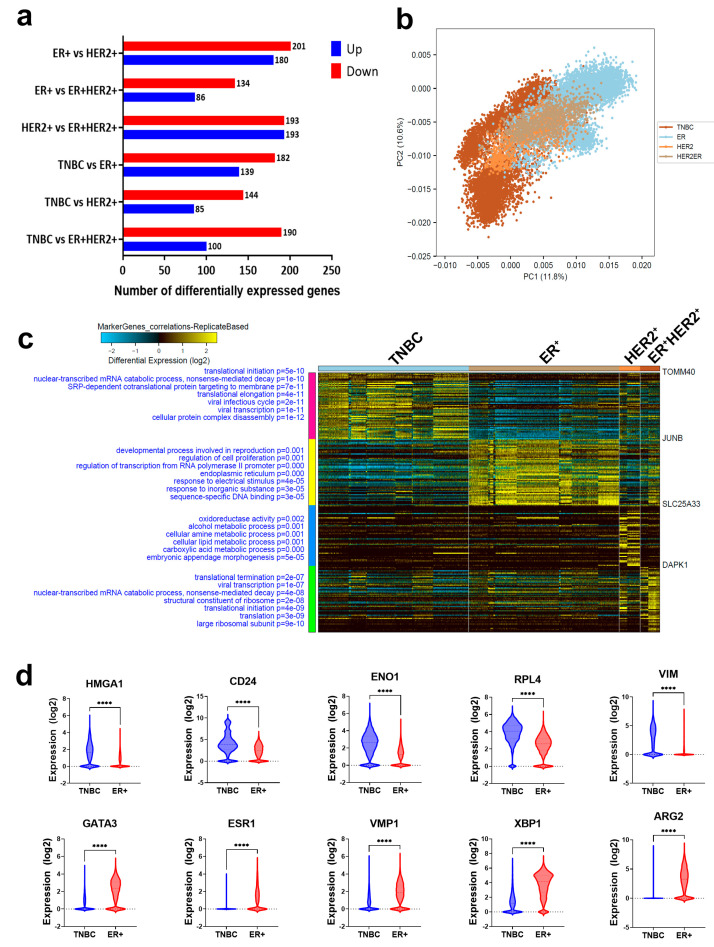
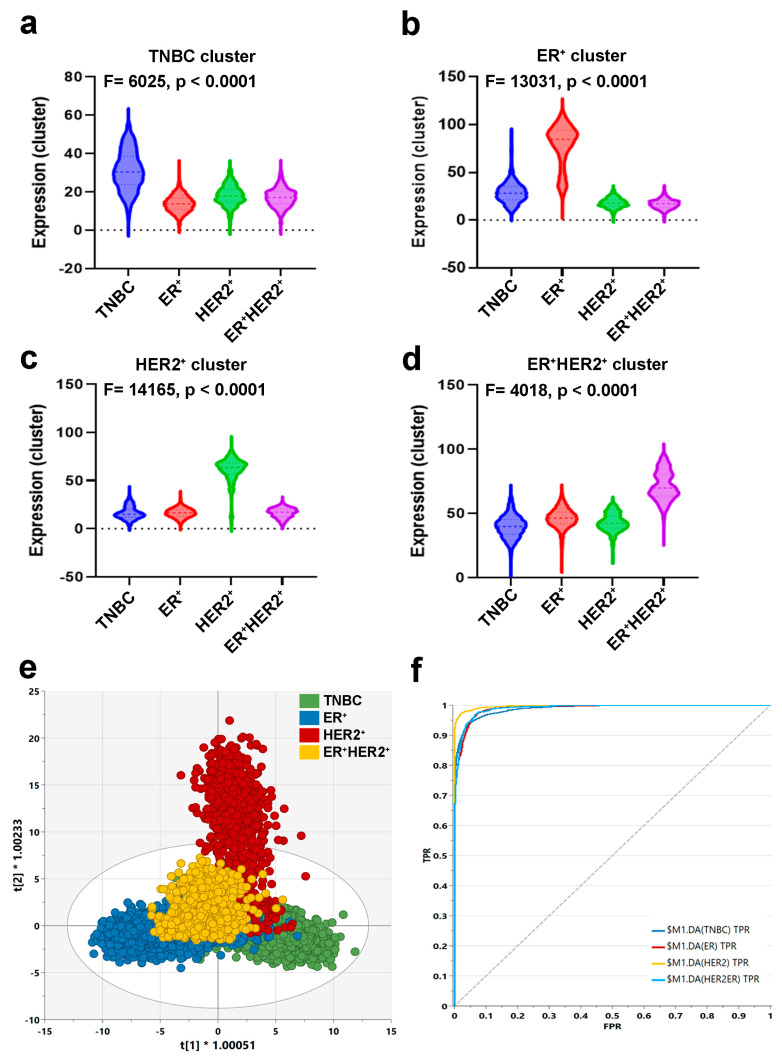
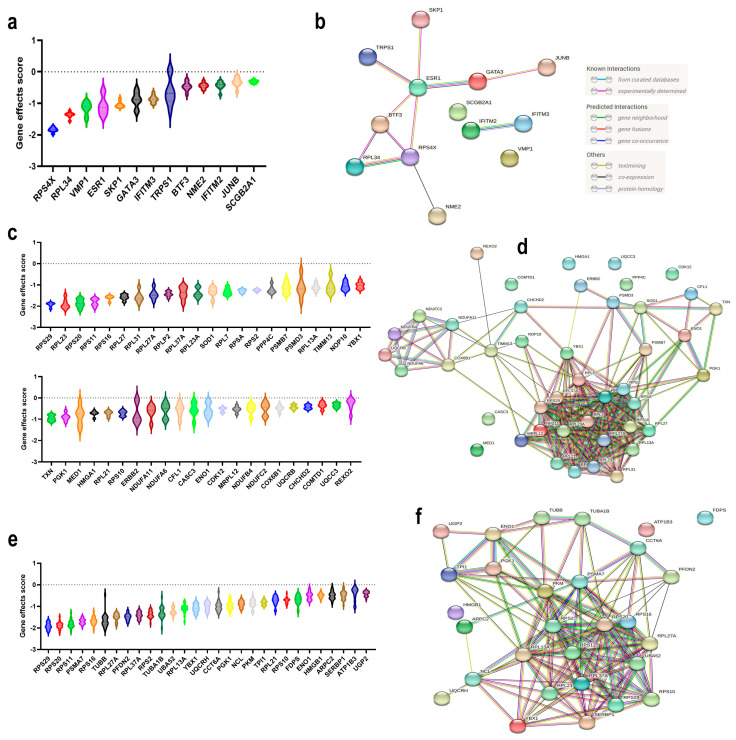
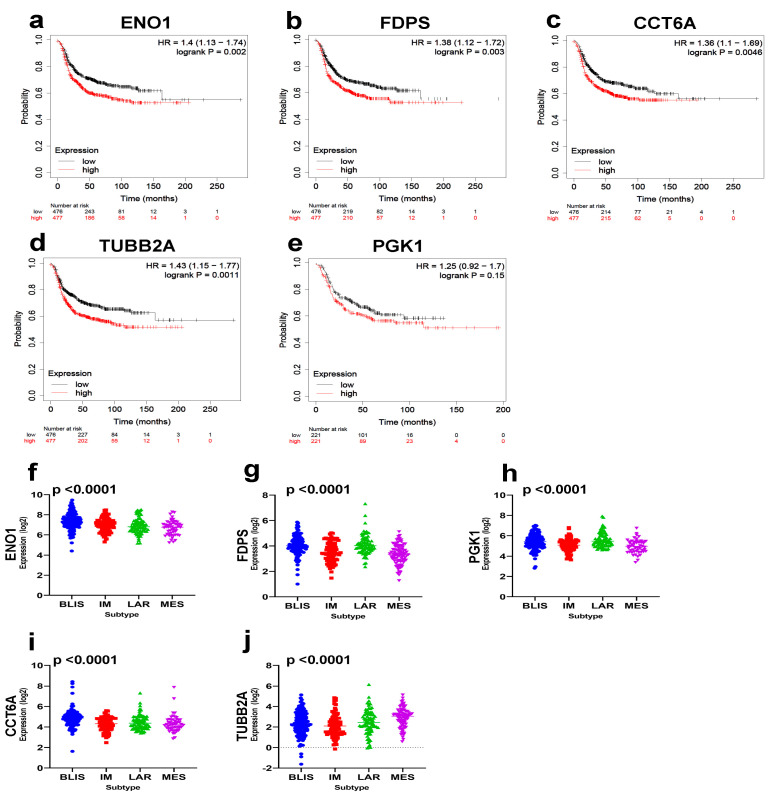
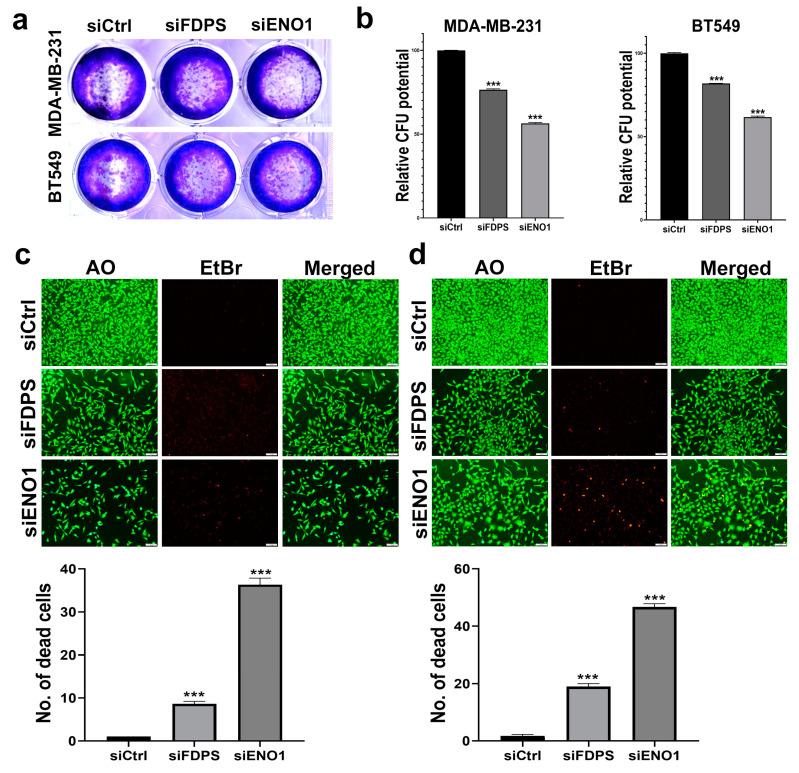
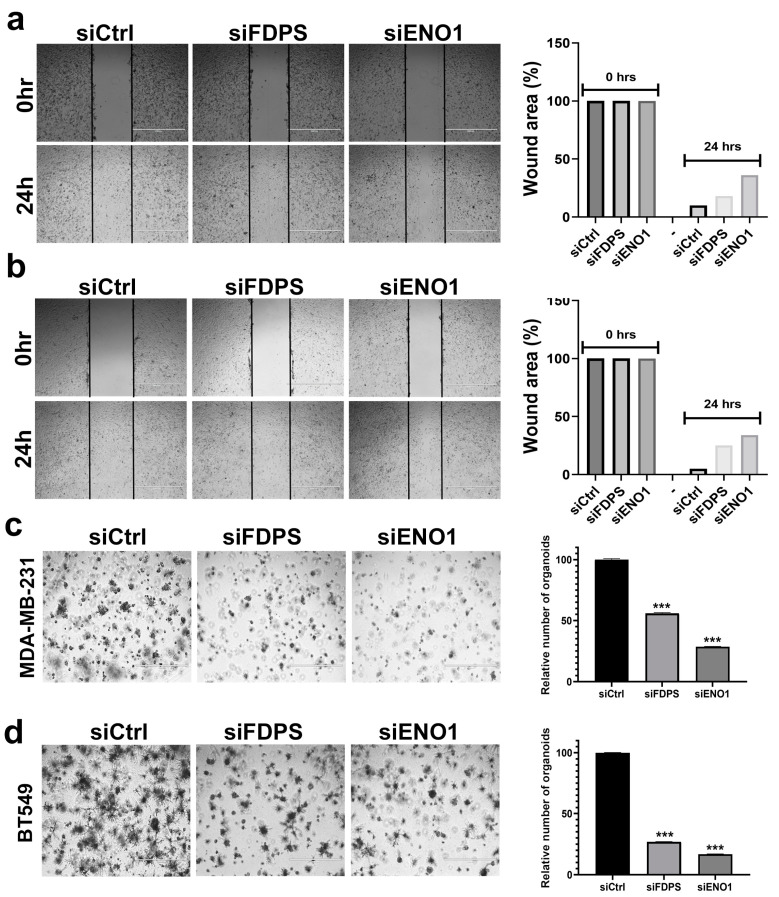
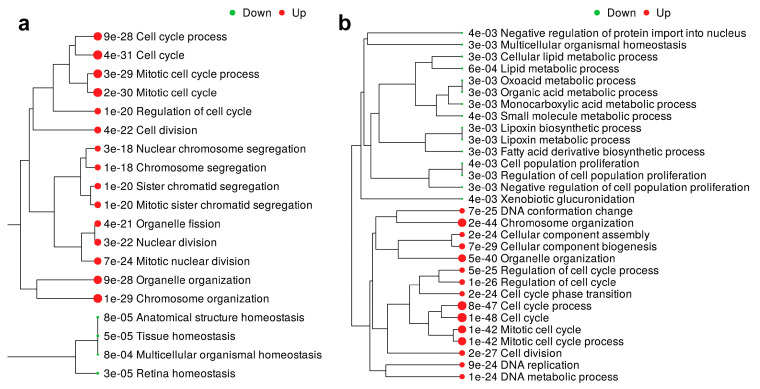
Breast cancer (BC) is a heterogeneous disease, which is primarily classified according to hormone receptors and HER2 expression. Despite the many advances in BC diagnosis and management, the identification of novel actionable therapeutic targets expressed by cancerous cells has always been a daunting task due to the large heterogeneity of the disease and the presence of non-cancerous cells (i.e., immune cells and stromal cells) within the tumor microenvironment. In the current study, we employed computational algorithms to decipher the cellular composition of estrogen receptor-positive (ER+), HER2+, ER+HER2+, and triple-negative BC (TNBC) subtypes from a total of 49,899 single cells' publicly available transcriptomic data derived from 26 BC patients. Restricting the analysis to EPCAM+Lin- tumor epithelial cells, we identified the enriched gene sets in each BC molecular subtype. Integration of single-cell transcriptomic with CRISPR-Cas9 functional screen data identified 13 potential therapeutic targets for ER+, 44 potential therapeutic targets for HER2+, and 29 potential therapeutic targets for TNBC. Interestingly, several of the identified therapeutic targets outperformed the current standard of care for each BC subtype. Given the aggressive nature and lack of targeted therapies for TNBC, elevated expression of ENO1, FDPS, CCT6A, TUBB2A, and PGK1 predicted worse relapse-free survival (RFS) in basal BC (n = 442), while elevated expression of ENO1, FDPS, CCT6A, and PGK1 was observed in the most aggressive BLIS TNBC subtype. Mechanistically, targeted depletion of ENO1 and FDPS halted TNBC cell proliferation, colony formation, and organoid tumor growth under 3-dimensional conditions and increased cell death, suggesting their potential use as novel therapeutic targets for TNBC. Differential expression and gene set enrichment analysis in TNBC revealed enrichment in the cycle and mitosis functional categories in FDPShigh, while ENO1high was associated with numerous functional categories, including cell cycle, glycolysis, and ATP metabolic processes. Taken together, our data are the first to unravel the unique gene signatures and to identify novel dependencies and therapeutic vulnerabilities for each BC molecular subtype, thus setting the foundation for the future development of more effective targeted therapies for BC.
Keywords: TNBC; breast cancer; molecular subtypes; single cell analysis; therapeutic targets.
Conflict of interest statement
The authors declare no conflict of interest.
Figures
Similar articles
-
Transcriptome profiling and network enrichment analyses identify subtype-specific therapeutic gene targets for breast cancer and their microRNA regulatory networks.Cell Death Dis. 2023 Jul 12;14(7):415. doi: 10.1038/s41419-023-05908-8. Cell Death Dis. 2023. PMID: 37438342 Free PMC article.
-
Comprehensive transcriptome analysis identifies novel molecular subtypes and subtype-specific RNAs of triple-negative breast cancer.Breast Cancer Res. 2016 Mar 15;18(1):33. doi: 10.1186/s13058-016-0690-8. Breast Cancer Res. 2016. PMID: 26975198 Free PMC article.
-
Overexpressing S100A9 ameliorates NK cell dysfunction in estrogen receptor-positive breast cancer.Cancer Immunol Immunother. 2024 May 7;73(7):117. doi: 10.1007/s00262-024-03699-1. Cancer Immunol Immunother. 2024. PMID: 38713229 Free PMC article.
-
Novel miRNA Targets and Therapies in the Triple-Negative Breast Cancer Microenvironment: An Emerging Hope for a Challenging Disease.Int J Mol Sci. 2020 Nov 24;21(23):8905. doi: 10.3390/ijms21238905. Int J Mol Sci. 2020. PMID: 33255471 Free PMC article. Review.
-
Triple negative breast cancer: looking for the missing link between biology and treatments.Oncotarget. 2015 Sep 29;6(29):26560-74. doi: 10.18632/oncotarget.5306. Oncotarget. 2015. PMID: 26387133 Free PMC article. Review.
Cited by
-
Disrupted Lipid Metabolism, Cytokine Signaling, and Dormancy: Hallmarks of Doxorubicin-Resistant Triple-Negative Breast Cancer Models.Cancers (Basel). 2024 Dec 23;16(24):4273. doi: 10.3390/cancers16244273. Cancers (Basel). 2024. PMID: 39766172 Free PMC article.
-
Transforming cancer treatment: integrating patient-derived organoids and CRISPR screening for precision medicine.Front Pharmacol. 2025 Mar 25;16:1563198. doi: 10.3389/fphar.2025.1563198. eCollection 2025. Front Pharmacol. 2025. PMID: 40201690 Free PMC article. Review.
-
Association between EPCAM upregulation and clinicopathological parameters and outcomes of breast cancer.Int J Clin Exp Pathol. 2024 Nov 15;17(11):421-428. doi: 10.62347/EGXS1506. eCollection 2024. Int J Clin Exp Pathol. 2024. PMID: 39660329 Free PMC article.
-
Identification and multi-omics analysis of essential coding and long non-coding genes in colorectal cancer.Biochem Biophys Rep. 2025 Feb 13;41:101938. doi: 10.1016/j.bbrep.2025.101938. eCollection 2025 Mar. Biochem Biophys Rep. 2025. PMID: 40034256 Free PMC article.
-
Transcriptome profiling and network enrichment analyses identify subtype-specific therapeutic gene targets for breast cancer and their microRNA regulatory networks.Cell Death Dis. 2023 Jul 12;14(7):415. doi: 10.1038/s41419-023-05908-8. Cell Death Dis. 2023. PMID: 37438342 Free PMC article.
References
-
- Meyers R.M., Bryan J.G., McFarland J.M., Weir B.A., Sizemore A.E., Xu H., Dharia N.V., Montgomery P.G., Cowley G.S., Pantel S., et al. Computational correction of copy number effect improves specificity of CRISPR-Cas9 essentiality screens in cancer cells. Nat. Genet. 2017;49:1779–1784. doi: 10.1038/ng.3984. - DOI - PMC - PubMed
Publication types
MeSH terms
Substances
LinkOut - more resources
Full Text Sources
Research Materials
Miscellaneous
