. 2023 Apr 20;15(8):2387.
doi: 10.3390/cancers15082387.

Biomarkers of Tumor Heterogeneity in Glioblastoma Multiforme Cohort of TCGA

Affiliations

Biomarkers of Tumor Heterogeneity in Glioblastoma Multiforme Cohort of TCGA

Garrett Winkelmaier et al. Cancers (Basel). .

Abstract

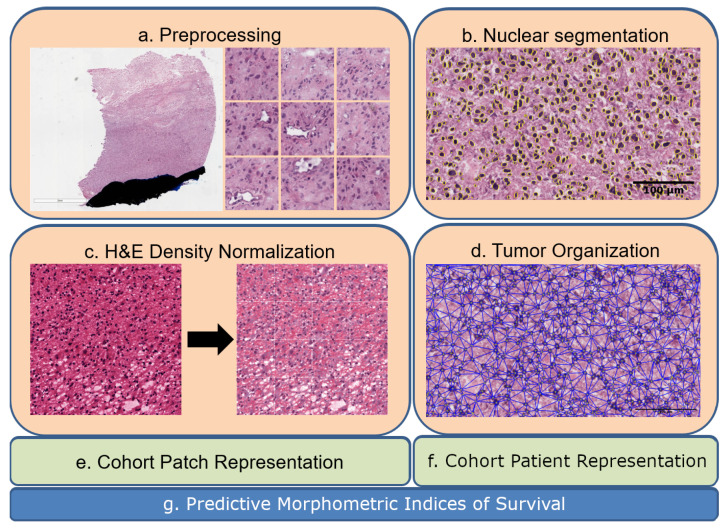
Tumor Whole Slide Images (WSI) are often heterogeneous, which hinders the discovery of biomarkers in the presence of confounding clinical factors. In this study, we present a pipeline for identifying biomarkers from the Glioblastoma Multiforme (GBM) cohort of WSIs from TCGA archive. The GBM cohort endures many technical artifacts while the discovery of GBM biomarkers is challenged because "age" is the single most confounding factor for predicting outcomes. The proposed approach relies on interpretable features (e.g., nuclear morphometric indices), effective similarity metrics for heterogeneity analysis, and robust statistics for identifying biomarkers. The pipeline first removes artifacts (e.g., pen marks) and partitions each WSI into patches for nuclear segmentation via an extended U-Net for subsequent quantitative representation. Given the variations in fixation and staining that can artificially modulate hematoxylin optical density (HOD), we extended Navab's Lab method to normalize images and reduce the impact of batch effects. The heterogeneity of each WSI is then represented either as probability density functions (PDF) per patient or as the composition of a dictionary predicted from the entire cohort of WSIs. For PDF- or dictionary-based methods, morphometric subtypes are constructed based on distances computed from optimal transport and linkage analysis or consensus clustering with Euclidean distances, respectively. For each inferred subtype, Kaplan-Meier and/or the Cox regression model are used to regress the survival time. Since age is the single most important confounder for predicting survival in GBM and there is an observed violation of the proportionality assumption in the Cox model, we use both age and age-squared coupled with the Likelihood ratio test and forest plots for evaluating competing statistics. Next, the PDF- and dictionary-based methods are combined to identify biomarkers that are predictive of survival. The combined model has the advantage of integrating global (e.g., cohort scale) and local (e.g., patient scale) attributes of morphometric heterogeneity, coupled with robust statistics, to reveal stable biomarkers. The results indicate that, after normalization of the GBM cohort, mean HOD, eccentricity, and cellularity are predictive of survival. Finally, we also stratified the GBM cohort as a function of EGFR expression and published genomic subtypes to reveal genomic-dependent morphometric biomarkers.

Keywords: Glioblastoma Multiforme; TCGA; biomarker; tumor heterogeneity; whole slide imaging.


Conflict of interest statement

The authors declare no conflict of interest.

Figures

Figure 1
Figure 1
Eash WSI is represented in the context of tumor heterogeneity for biomarker discovery: (a) a WSI is partitioned to patches of 224-by-224, where each patch is analyzed for pen marks or other aberrations; (b) nuclei are segmented in patches; (c) H&E optical density is normalized in each patch; (d) nuclei organization is quantified in each patch; (e,f) computed indices from nuclei and their organizations are used for the dictionary- and PDF-based representations. (g) Predictive morphometric indices of survival are identified.
Figure 2
Figure 2
H&E stain is heterogeneous between patients. Two patches from two WSIs indicate a diverse staining signature. They are normalized for quantifying HOD and visualized in the RGB space.
Figure 3
Figure 3
Dictionary-based learning identified two and three subpopulation (e.g., clusters) of patients based on cellularity and eccentricity indices, respectively. (top row): Computed similarity matrices; (middle row) the cumulative Density Function (CDF) of similarity matrices shows the quality of the number of clusters for each index (e.g., a flat horizontal line indicates a low number of misclassified samples between clusters). (bottom row) Silhouette plots of 800,000 randomly sampled nuclei show the similarity of patients within a cluster (e.g., a silhouette score less than 1) and a red dashed indicating the average silhouette score.
Figure 4
Figure 4
Representative patches showing low, medium, and high eccentricities corresponding to clusters 1, 2, and 3 from the dictionary-based method.
Figure 5
Figure 5
Representative patches showing low, and high cellularities corresponding to clusters 1 and 2 from the dictionary-method.
Figure 6
Figure 6
Steps in the dictionary-based method for representing heterogeneity: (a) each WSI is partitioned into patches; (b) each patch is quantified in terms of nuclear indices and organization; (c) each computed index (e.g., HOD content, nuclear size) is aggregated across the entire cohort for dictionary-based learning (e.g., alphabets, which are four in this example); and (d) each WSI is then represented as a composition of learned alphabets.
Figure 7
Figure 7
Optimal transport identifies subpopulations of patients, based on PDF representation, for survival analysis. Top row: similarity matrices identified by linkage analysis; Bottom row: Kaplan–Meier plots, hazard ratio, and computed p-values for three computed morphometric indices of nuclear size, solidity, and total chromatin.
Figure 8
Figure 8
The forest plot indicates biomarkers associated with the subpopulation at risk using the PDF-based representation without any genomic preconditioning. The asterisks **, ***, and **** denote the number of stratifications per morphometric index.
Figure 9
Figure 9
Using the PDF method, pre-conditioned on the classical subtype, the forest plot indicates the subpopulation at risk. The asterisks **, ***, and **** denote the number of stratifications per morphometric index.
Figure 10
Figure 10
Using the PDF method, pre-conditioned on a high EGFR expression, the forest plot indicates the subpopulation at risk. For example, Area cluster two has an 52% decreased risk of death compared to Area cluster zero. The asterisks **** denote the number of stratifications per morphometric index.

References

    1. Ostrom Q.T., Cioffi G., Waite K., Kruchko C., Barnholtz-Sloan J.S. CBTRUS statistical report: Primary brain and other central nervous system tumors diagnosed in the United States in 2014–2018. Neuro-Oncology. 2021;23:iii1–iii105. doi: 10.1093/neuonc/noab200. - DOI - PMC - PubMed
    1. Verhaak R.G., Hoadley K.A., Purdom E., Wang V., Qi Y., Wilkerson M.D., Miller C.R., Ding L., Golub T., Mesirov J.P., et al. Integrated genomic analysis identifies clinically relevant subtypes of glioblastoma characterized by abnormalities in PDGFRA, IDH1, EGFR, and NF1. Cancer Cell. 2010;17:98–110. doi: 10.1016/j.ccr.2009.12.020. - DOI - PMC - PubMed
    1. Zhu X., Yao J., Huang J. Deep convolutional neural network for survival analysis with pathological images; Proceedings of the 2016 IEEE International Conference on Bioinformatics and Biomedicine (BIBM); Shenzhen, China. 15–18 December 2016; Piscataway, NJ, USA: IEEE; 2016. pp. 544–547.
    1. Lin H., Chen H., Graham S., Dou Q., Rajpoot N., Heng P.A. Fast scannet: Fast and dense analysis of multi-gigapixel whole-slide images for cancer metastasis detection. IEEE Trans. Med. Imaging. 2019;38:1948–1958. doi: 10.1109/TMI.2019.2891305. - DOI - PubMed
    1. Jung H., Lodhi B., Kang J. An automatic nuclei segmentation method based on deep convolutional neural networks for histopathology images. BMC Biomed. Eng. 2019;1:1–12. doi: 10.1186/s42490-019-0026-8. - DOI - PMC - PubMed