Molecular and phenotypic characteristics influencing the degree of cytoreduction in high-grade serous ovarian carcinomas
- PMID: 37191035
- PMCID: PMC10358208
- DOI: 10.1002/cam4.6085
Molecular and phenotypic characteristics influencing the degree of cytoreduction in high-grade serous ovarian carcinomas
Abstract
Background: High-grade serous ovarian carcinoma (HGSOC) is the deadliest ovarian cancer subtype, and survival relates to initial cytoreductive surgical treatment. The existing tools for surgical outcome prediction remain inadequate for anticipating the outcomes of the complex relationship between tumour biology, clinical phenotypes, co-morbidity and surgical skills. In this genotype-phenotype association study, we combine phenotypic markers with targeted DNA sequencing to discover novel biomarkers to guide the surgical management of primary HGSOC.
Methods: Primary tumour tissue samples (n = 97) and matched blood from a phenotypically well-characterised treatment-naïve HGSOC patient cohort were analysed by targeted massive parallel DNA sequencing (next generation sequencing [NGS]) of a panel of 360 cancer-related genes. Association analyses were performed on phenotypic traits related to complete cytoreductive surgery, while logistic regression analysis was applied for the predictive model.
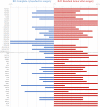
Results: The positive influence of complete cytoreductive surgery (R0) on overall survival was confirmed (p = 0.003). Before surgery, low volumes of ascitic fluid, lower CA125 levels, higher platelet counts and relatively lower clinical stage at diagnosis were all indicators, alone and combined, for complete cytoreduction (R0). Mutations in either the chromatin remodelling SWI_SNF (p = 0.036) pathway or the histone H3K4 methylation pathway (p = 0.034) correlated with R0. The R0 group also demonstrated higher tumour mutational burden levels (p = 0.028). A predictive model was developed by combining two phenotypes and the mutational status of five genes and one genetic pathway, enabling the prediction of surgical outcomes in 87.6% of the cases in this cohort.
Conclusion: Inclusion of molecular biomarkers adds value to the pre-operative stratification of HGSOC patients. A potential preoperative risk stratification model combining phenotypic traits and single-gene mutational status is suggested, but the set-up needs to be validated in larger cohorts.
Keywords: cancer genetics; clinical observations; gynaecological oncology; mutations; risk model; surgery.
© 2023 The Authors. Cancer Medicine published by John Wiley & Sons Ltd.
Conflict of interest statement
Torkildsen reports personal fees from AstraZeneca and GlaxoSmithKline. Thomsen reports personal fees from Bayer, Eisai Co., and AstraZeneca, and Thomsen and Bjørge report financial support from AstraZeneca for a researcher‐initiated trial. The other authors declare no conflict of interest.
Figures


References
-
- Siegel RL, Miller KD, Jemal A. Cancer statistics, 2020. CA Cancer J Clin. 2020;70(1):7‐30. - PubMed
-
- Cancer Registry of Norway . Cancer in Norway 2021–Cancer Incidence, Mortality, Survival and Prevalence in Norway. Cancer Registry of Norway; 2021.
-
- Bristow RE, Tomacruz RS, Armstrong DK, Trimble EL, Montz FJ. Survival effect of maximal cytoreductive surgery for advanced ovarian carcinoma during the platinum era: a meta‐analysis. J Clin Oncol. 2002;20(5):1248‐1259. - PubMed
-
- Chang SJ, Bristow RE, Ryu HS. Impact of complete cytoreduction leaving no gross residual disease associated with radical cytoreductive surgical procedures on survival in advanced ovarian cancer. Ann Surg Oncol. 2012;19(13):4059‐4067. - PubMed
-
- du Bois A, Reuss A, Pujade‐Lauraine E, Harter P, Ray‐Coquard I, Pfisterer J. Role of surgical outcome as prognostic factor in advanced epithelial ovarian cancer: a combined exploratory analysis of 3 prospectively randomized phase 3 multicenter trials by the Arbeitsgemeinschaft Gynaekologische Onkologie Studiengruppe Ovarialkarzinom (AGO‐OVAR) and the Groupe d'Investigateurs Nationaux Pour les Etudes des Cancers de l'Ovaire (GINECO). Cancer. 2009;115(6):1234‐1244. - PubMed
Publication types
MeSH terms
LinkOut - more resources
Full Text Sources
Medical
Research Materials
Miscellaneous

