. 2023 Jun;307(5):e222008.
doi: 10.1148/radiol.222008. Epub 2023 May 16.

AI-based CT Body Composition Identifies Myosteatosis as Key Mortality Predictor in Asymptomatic Adults

Affiliations

AI-based CT Body Composition Identifies Myosteatosis as Key Mortality Predictor in Asymptomatic Adults

Maxime Nachit et al. Radiology. 2023 Jun.

Abstract

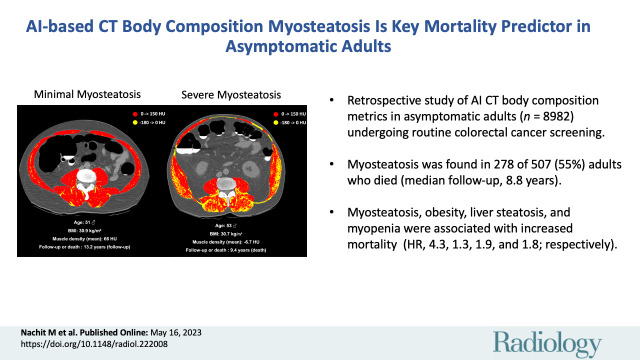
Background Body composition data have been limited to adults with disease or older age. The prognostic impact in otherwise asymptomatic adults is unclear. Purpose To use artificial intelligence-based body composition metrics from routine abdominal CT scans in asymptomatic adults to clarify the association between obesity, liver steatosis, myopenia, and myosteatosis and the risk of mortality. Materials and Methods In this retrospective single-center study, consecutive adult outpatients undergoing routine colorectal cancer screening from April 2004 to December 2016 were included. Using a U-Net algorithm, the following body composition metrics were extracted from low-dose, noncontrast, supine multidetector abdominal CT scans: total muscle area, muscle density, subcutaneous and visceral fat area, and volumetric liver density. Abnormal body composition was defined by the presence of liver steatosis, obesity, muscle fatty infiltration (myosteatosis), and/or low muscle mass (myopenia). The incidence of death and major adverse cardiovascular events were recorded during a median follow-up of 8.8 years. Multivariable analyses were performed accounting for age, sex, smoking status, myosteatosis, liver steatosis, myopenia, type 2 diabetes, obesity, visceral fat, and history of cardiovascular events. Results Overall, 8982 consecutive outpatients (mean age, 57 years ± 8 [SD]; 5008 female, 3974 male) were included. Abnormal body composition was found in 86% (434 of 507) of patients who died during follow-up. Myosteatosis was found in 278 of 507 patients (55%) who died (15.5% absolute risk at 10 years). Myosteatosis, obesity, liver steatosis, and myopenia were associated with increased mortality risk (hazard ratio [HR]: 4.33 [95% CI: 3.63, 5.16], 1.27 [95% CI: 1.06, 1.53], 1.86 [95% CI: 1.56, 2.21], and 1.75 [95% CI: 1.43, 2.14], respectively). In 8303 patients (excluding 679 patients without complete data), after multivariable adjustment, myosteatosis remained associated with increased mortality risk (HR, 1.89 [95% CI: 1.52, 2.35]; P < .001). Conclusion Artificial intelligence-based profiling of body composition from routine abdominal CT scans identified myosteatosis as a key predictor of mortality risk in asymptomatic adults. © RSNA, 2023 Supplemental material is available for this article. See also the editorial by Tong and Magudia in this issue.


Conflict of interest statement

Disclosures of conflicts of interest: M.N. Patents planned, issued, or pending (PCT/EP2022/065769 Ref WO/2022/258788). Y.H. No relevant relationships. R.M.S. Cooperative research and development agreement with PingAn; patent licenses, software licenses, or royalties from iCAD, Philips, ScanMed, PingAn, and Translation Holdings. I.A.L. Associate editor for Clinical Science and Liver International; patents planned, issued, or pending (PCT/EP2022/065769 Ref WO/2022/258788). P.J.P. Consulting fees from Bracco, Nanox, and GE Healthcare.

Figures

None
Graphical abstract
Flowchart shows patient inclusion and exclusion. Patients with missing
body composition data (body mass index [BMI], liver density, skeletal muscle
index [SMI], or muscle density) or with evident muscle artifacts at CT were
excluded before the univariable analysis. Multivariable analysis was
performed on the cohort with complete data available, including smoking
status, medical history of cardiovascular events, and visceral fat
measurements. (* = data were missing in 679 patients, when accounting
for overlaps.)
Figure 1:
Flowchart shows patient inclusion and exclusion. Patients with missing body composition data (body mass index [BMI], liver density, skeletal muscle index [SMI], or muscle density) or with evident muscle artifacts at CT were excluded before the univariable analysis. Multivariable analysis was performed on the cohort with complete data available, including smoking status, medical history of cardiovascular events, and visceral fat measurements. (* = data were missing in 679 patients, when accounting for overlaps.)
Venn diagrams show the number of patients according to abnormal body
composition feature (myosteatosis, liver steatosis, myopenia, obesity) at
baseline and their intersection with the number of patients (A) who
experienced at least one adverse event (ie, cardiovascular event or death; n
= 1836) and (B) who died during follow-up (n = 507). Adverse events mostly
occurred in patients with abnormal body composition.
Figure 2:
Venn diagrams show the number of patients according to abnormal body composition feature (myosteatosis, liver steatosis, myopenia, obesity) at baseline and their intersection with the number of patients (A) who experienced at least one adverse event (ie, cardiovascular event or death; n = 1836) and (B) who died during follow-up (n = 507). Adverse events mostly occurred in patients with abnormal body composition.
(A) Unenhanced axial abdominal CT image with a Hounsfield
unit–based color scale of skeletal muscles in a 51-year-old man with
obesity, smoking history, no type 2 diabetes, and no history of
cardiovascular events at inclusion shows mild fatty infiltration in the
muscles (myosteatosis, yellow), with most voxels in the positive range of
Hounsfield units (red). The patient was lost to follow-up after 13.2 years.
(B) Unenhanced axial abdominal CT image with a Hounsfield unit–based
color scale of skeletal muscles in a 53-year-old man with obesity, smoking
history, no type 2 diabetes, and no history of cardiovascular events at
inclusion shows severe fatty infiltration in the muscles (myosteatosis,
yellow), mostly distributed in the paravertebral (ie, erector spinae and
multifidus) and oblique muscle groups. The patient died after 9.4 years of
follow-up. BMI = body mass index.
Figure 3:
(A) Unenhanced axial abdominal CT image with a Hounsfield unit–based color scale of skeletal muscles in a 51-year-old man with obesity, smoking history, no type 2 diabetes, and no history of cardiovascular events at inclusion shows mild fatty infiltration in the muscles (myosteatosis, yellow), with most voxels in the positive range of Hounsfield units (red). The patient was lost to follow-up after 13.2 years. (B) Unenhanced axial abdominal CT image with a Hounsfield unit–based color scale of skeletal muscles in a 53-year-old man with obesity, smoking history, no type 2 diabetes, and no history of cardiovascular events at inclusion shows severe fatty infiltration in the muscles (myosteatosis, yellow), mostly distributed in the paravertebral (ie, erector spinae and multifidus) and oblique muscle groups. The patient died after 9.4 years of follow-up. BMI = body mass index.
Kaplan-Meier curves of survival probability according to body
composition parameter, including (A) obesity, (B) liver steatosis, (C)
myopenia, and (D) myosteatosis, show an association between myosteatosis and
high mortality risk. Statistics were computed with the Mantel-Cox log-rank
test. HR = hazard ratio.
Figure 4:
Kaplan-Meier curves of survival probability according to body composition parameter, including (A) obesity, (B) liver steatosis, (C) myopenia, and (D) myosteatosis, show an association between myosteatosis and high mortality risk. Statistics were computed with the Mantel-Cox log-rank test. HR = hazard ratio.
Schematic shows possible transition states of the multistate Markov
model, starting at inclusion (ie, CT scan acquisition) and leading to
intermediate states (ie, major adverse cardiovascular events [MACEs],
indicated by gray circles) and/or to an absorbing state (ie, death or loss
to follow-up, indicated by red circles). Transitions numbered 2, 4, 6, 8, or
9 lead to an absorbing state and transitions numbered 1, 3, 5, or 7 lead to
an intermediate state. CV = cardiovascular.
Figure 5:
Schematic shows possible transition states of the multistate Markov model, starting at inclusion (ie, CT scan acquisition) and leading to intermediate states (ie, major adverse cardiovascular events [MACEs], indicated by gray circles) and/or to an absorbing state (ie, death or loss to follow-up, indicated by red circles). Transitions numbered 2, 4, 6, 8, or 9 lead to an absorbing state and transitions numbered 1, 3, 5, or 7 lead to an intermediate state. CV = cardiovascular.
Partial dependence curves extracted from the random forest survival
model show the survival function value of each body composition parameter
according to (A) sex as a covariate and (B) male and (C) female sex. These
results highlight the importance of muscle density in modulating mortality
risk (see Appendix S1), independent from the quartile-based stratification;
thus, myosteatosis is the most impactful body composition predictor of
mortality. BMI = body mass index, HU = Hounsfield unit.
Figure 6:
Partial dependence curves extracted from the random forest survival model show the survival function value of each body composition parameter according to (A) sex as a covariate and (B) male and (C) female sex. These results highlight the importance of muscle density in modulating mortality risk (see Appendix S1), independent from the quartile-based stratification; thus, myosteatosis is the most impactful body composition predictor of mortality. BMI = body mass index, HU = Hounsfield unit.

Comment in

References

    1. Blüher M . Obesity: global epidemiology and pathogenesis . Nat Rev Endocrinol 2019. ; 15 ( 5 ): 288 – 298 . - PubMed
    1. González-Muniesa P , Mártinez-González MA , Hu FB , et al. . Obesity . Nat Rev Dis Primers 2017. ; 3 ( 1 ): 17034 . - PubMed
    1. Prado CMM , Lieffers JR , McCargar LJ , et al. . Prevalence and clinical implications of sarcopenic obesity in patients with solid tumours of the respiratory and gastrointestinal tracts: a population-based study . Lancet Oncol 2008. ; 9 ( 7 ): 629 – 635 . - PubMed
    1. Ali R , Baracos VE , Sawyer MB , et al. . Lean body mass as an independent determinant of dose-limiting toxicity and neuropathy in patients with colon cancer treated with FOLFOX regimens . Cancer Med 2016. ; 5 ( 4 ): 607 – 616 . - PMC - PubMed
    1. Martin L , Birdsell L , Macdonald N , et al. . Cancer cachexia in the age of obesity: skeletal muscle depletion is a powerful prognostic factor, independent of body mass index . J Clin Oncol 2013. ; 31 ( 12 ): 1539 – 1547 . - PubMed

LinkOut - more resources