

Plasmer: an Accurate and Sensitive Bacterial Plasmid Prediction Tool Based on Machine Learning of Shared k-mers and Genomic Features
- PMID: 37191574
- PMCID: PMC10269668
- DOI: 10.1128/spectrum.04645-22
Plasmer: an Accurate and Sensitive Bacterial Plasmid Prediction Tool Based on Machine Learning of Shared k-mers and Genomic Features
Abstract
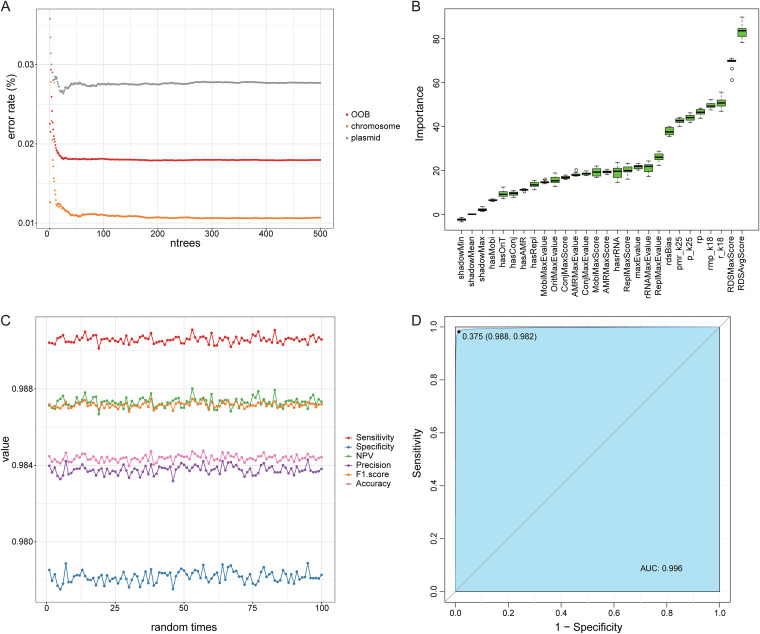
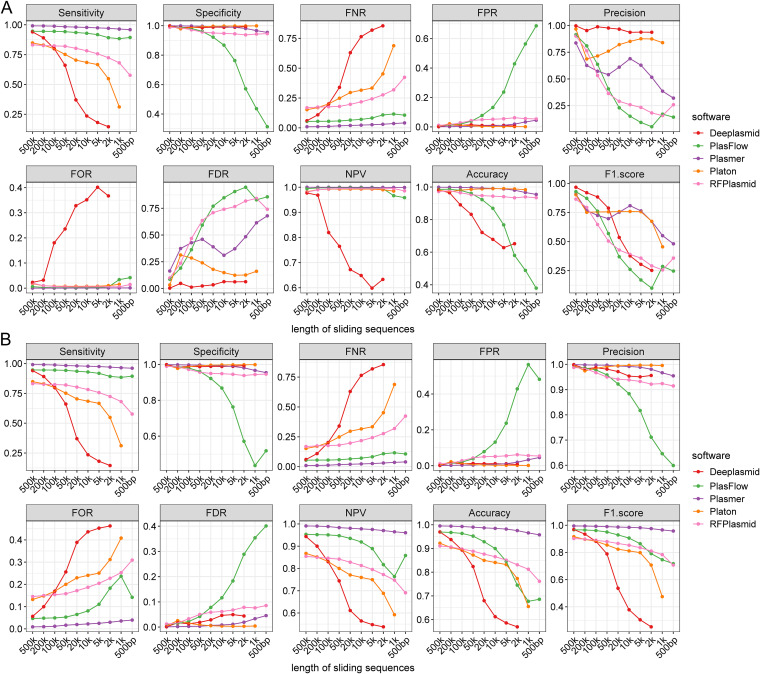
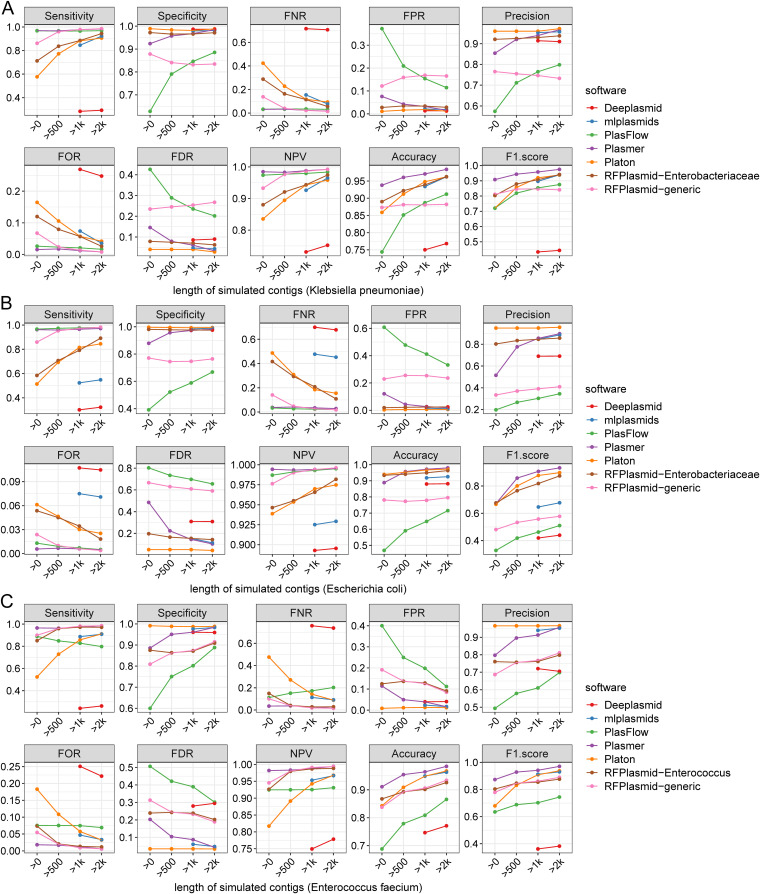
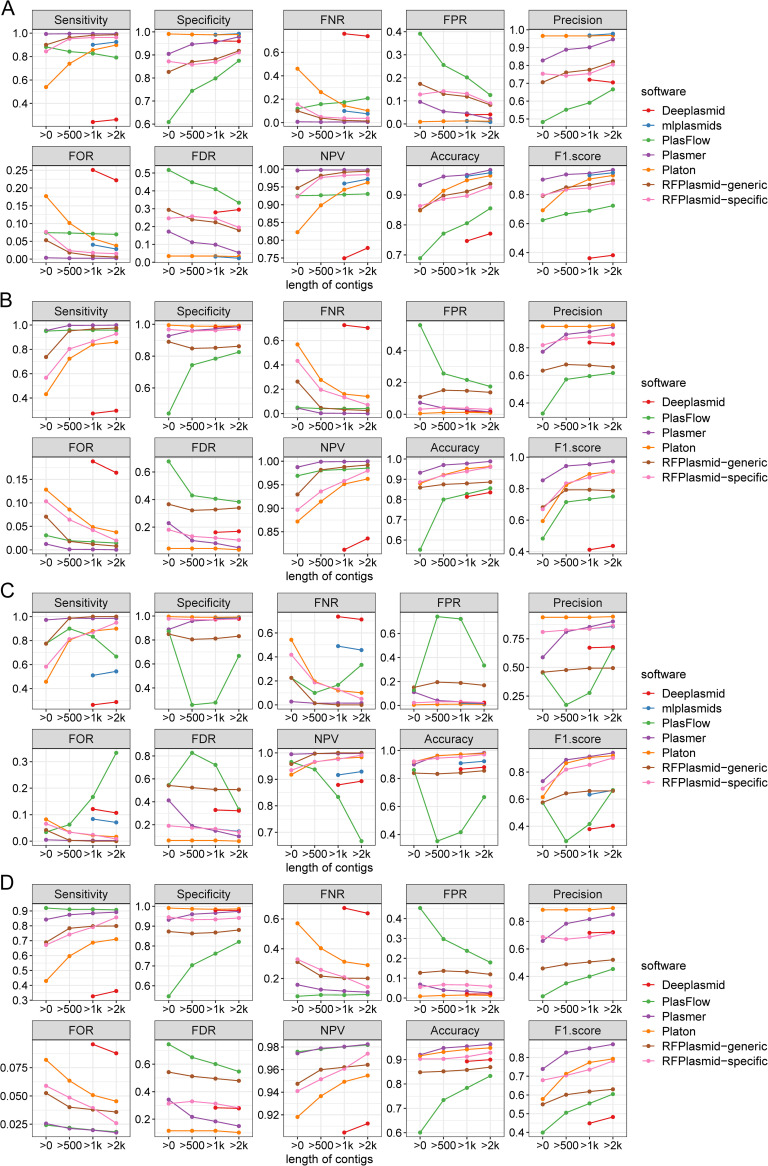
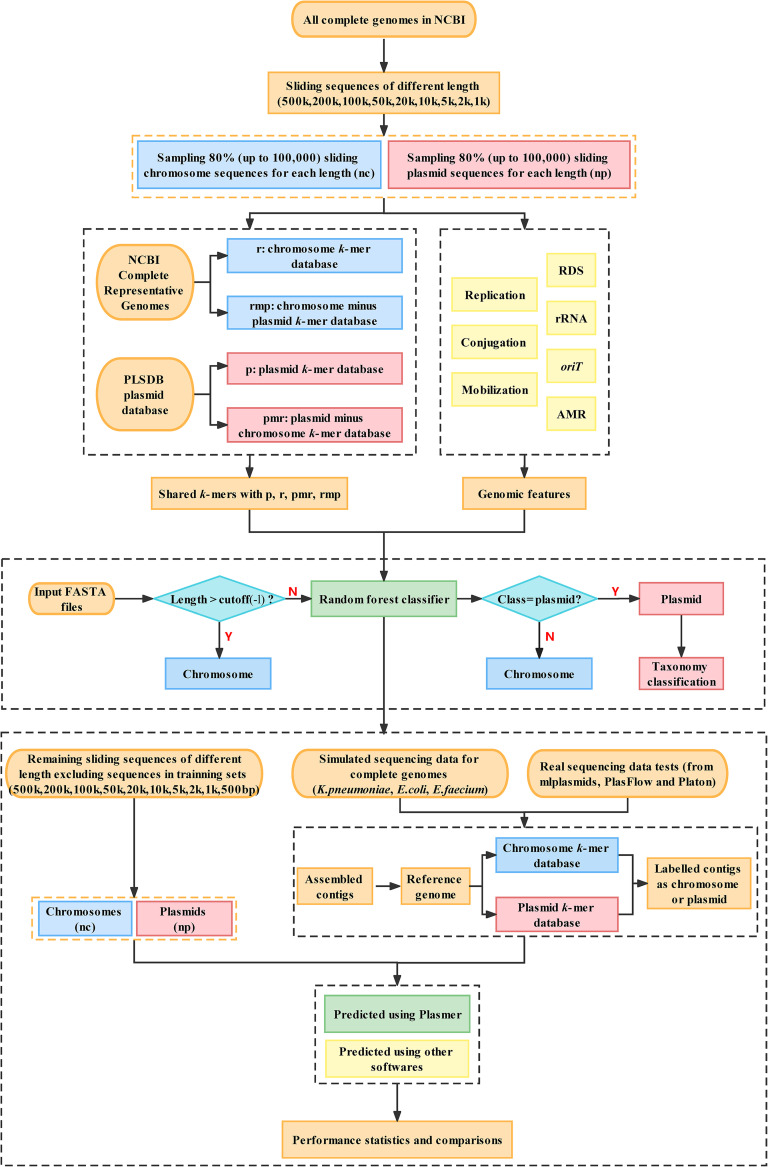
Identification of plasmids in bacterial genomes is critical for many factors, including horizontal gene transfer, antibiotic resistance genes, host-microbe interactions, cloning vectors, and industrial production. There are several in silico methods to predict plasmid sequences in assembled genomes. However, existing methods have evident shortcomings, such as unbalance in sensitivity and specificity, dependency on species-specific models, and performance reduction in sequences shorter than 10 kb, which has limited their scope of applicability. In this work, we proposed Plasmer, a novel plasmid predictor based on machine-learning of shared k-mers and genomic features. Unlike existing k-mer or genomic-feature based methods, Plasmer employs the random forest algorithm to make predictions using the percent of shared k-mers with plasmid and chromosome databases combined with other genomic features, including alignment E value and replicon distribution scores (RDS). Plasmer can predict on multiple species and has achieved an average the area under the curve (AUC) of 0.996 with accuracy of 98.4%. Compared to existing methods, tests of both sliding sequences and simulated and de novo assemblies have consistently shown that Plasmer has outperforming accuracy and stable performance across long and short contigs above 500 bp, demonstrating its applicability for fragmented assemblies. Plasmer also has excellent and balanced performance on both sensitivity and specificity (both >0.95 above 500 bp) with the highest F1-score, which has eliminated the bias on sensitivity or specificity that was common in existing methods. Plasmer also provides taxonomy classification to help identify the origin of plasmids. IMPORTANCE In this study, we proposed a novel plasmid prediction tool named Plasmer. Technically, unlike existing k-mer or genomic features-based methods, Plasmer is the first tool to combine the advantages of the percent of shared k-mers and the alignment score of genomic features. This has given Plasmer (i) evident improvement in performance compared to other methods, with the best F1-score and accuracy on sliding sequences, simulated contigs, and de novo assemblies; (ii) applicability for contigs above 500 bp with highest accuracy, enabling plasmid prediction in fragmented short-read assemblies; (iii) excellent and balanced performance between sensitivity and specificity (both >0.95 above 500 bp) with the highest F1-score, which eliminated the bias on sensitivity or specificity that commonly existed in other methods; and (iv) no dependency of species-specific training models. We believe that Plasmer provides a more reliable alternative for plasmid prediction in bacterial genome assemblies.
Keywords: bacteria; benchmark; chromosome; genomic features; k-mer; machine learning; plasmid; prediction tool; random forest; shared k-mers.
Conflict of interest statement
The authors declare no conflict of interest.
Figures
Similar articles
-
Classification of bacterial plasmid and chromosome derived sequences using machine learning.PLoS One. 2022 Dec 16;17(12):e0279280. doi: 10.1371/journal.pone.0279280. eCollection 2022. PLoS One. 2022. PMID: 36525447 Free PMC article.
-
Platon: identification and characterization of bacterial plasmid contigs in short-read draft assemblies exploiting protein sequence-based replicon distribution scores.Microb Genom. 2020 Oct;6(10):mgen000398. doi: 10.1099/mgen.0.000398. Microb Genom. 2020. PMID: 32579097 Free PMC article.
-
PlasForest: a homology-based random forest classifier for plasmid detection in genomic datasets.BMC Bioinformatics. 2021 Jun 26;22(1):349. doi: 10.1186/s12859-021-04270-w. BMC Bioinformatics. 2021. PMID: 34174810 Free PMC article.
-
K-mer-based Approaches to Bridging Pangenomics and Population Genetics.Mol Biol Evol. 2025 Mar 5;42(3):msaf047. doi: 10.1093/molbev/msaf047. Mol Biol Evol. 2025. PMID: 40111256 Free PMC article. Review.
-
A survey of k-mer methods and applications in bioinformatics.Comput Struct Biotechnol J. 2024 May 21;23:2289-2303. doi: 10.1016/j.csbj.2024.05.025. eCollection 2024 Dec. Comput Struct Biotechnol J. 2024. PMID: 38840832 Free PMC article. Review.
Cited by
-
Large-scale genomic analysis of Elizabethkingia anophelis.BMC Genomics. 2024 Oct 29;25(1):1015. doi: 10.1186/s12864-024-10921-y. BMC Genomics. 2024. PMID: 39472795 Free PMC article.
-
Genomic epidemiology reveals multiple mechanisms of linezolid resistance in clinical enterococci in China.Ann Clin Microbiol Antimicrob. 2024 May 4;23(1):41. doi: 10.1186/s12941-024-00689-0. Ann Clin Microbiol Antimicrob. 2024. PMID: 38704577 Free PMC article.
-
PIPdb: a comprehensive plasmid sequence resource for tracking the horizontal transfer of pathogenic factors and antimicrobial resistance genes.Nucleic Acids Res. 2025 Jan 6;53(D1):D169-D178. doi: 10.1093/nar/gkae952. Nucleic Acids Res. 2025. PMID: 39460620 Free PMC article.
-
Circling in on plasmids: benchmarking plasmid detection and reconstruction tools for short-read data from diverse species.bioRxiv [Preprint]. 2025 Aug 5:2025.07.28.667252. doi: 10.1101/2025.07.28.667252. bioRxiv. 2025. PMID: 40766476 Free PMC article. Preprint.
-
Genomic Analysis of Antimicrobial Resistance in Pseudomonas aeruginosa from a "One Health" Perspective.Microorganisms. 2024 Aug 27;12(9):1770. doi: 10.3390/microorganisms12091770. Microorganisms. 2024. PMID: 39338445 Free PMC article.
References
-
- Clewell DB, Weaver KE, Dunny GM, Coque TM, Francia MV, Hayes F. 2014. Extrachromosomal and mobile elements in enterococci: transmission, maintenance, and epidemiology. In Gilmore MS, Clewell DB, Ike Y, Shankar N (ed), Enterococci: from commensals to leading causes of drug resistant infection. Massachusetts Eye and Ear Infirmary, Boston, MA. - PubMed
Publication types
MeSH terms
LinkOut - more resources
Full Text Sources
Miscellaneous
