. 2023 Jul 3;155(7):e202213150.
doi: 10.1085/jgp.202213150. Epub 2023 May 16.

Remodeled connexin 43 hemichannels alter cardiac excitability and promote arrhythmias

Affiliations

Remodeled connexin 43 hemichannels alter cardiac excitability and promote arrhythmias

Mauricio A Lillo et al. J Gen Physiol. .

Abstract

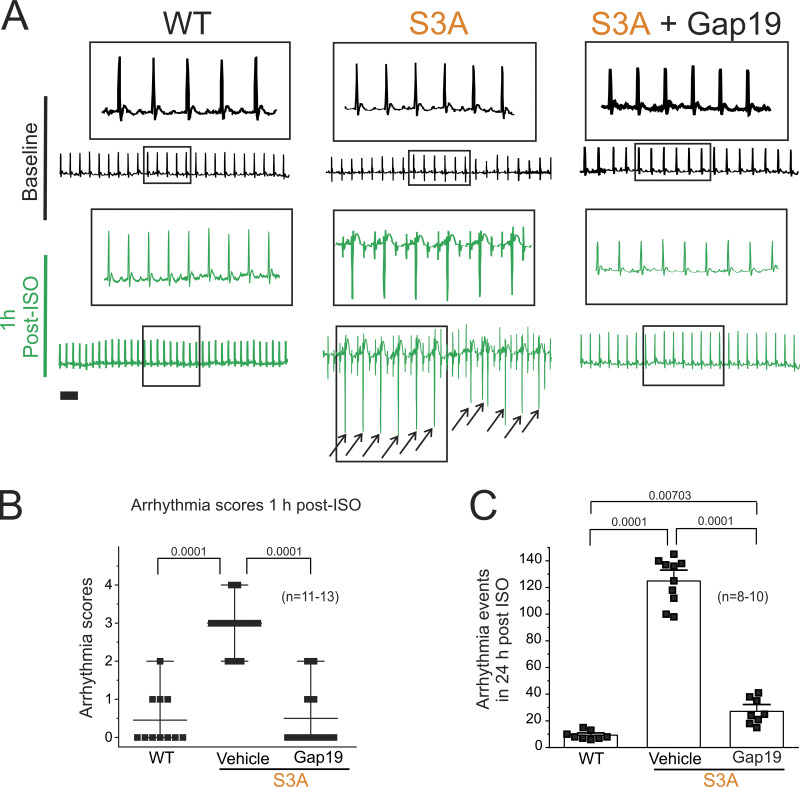
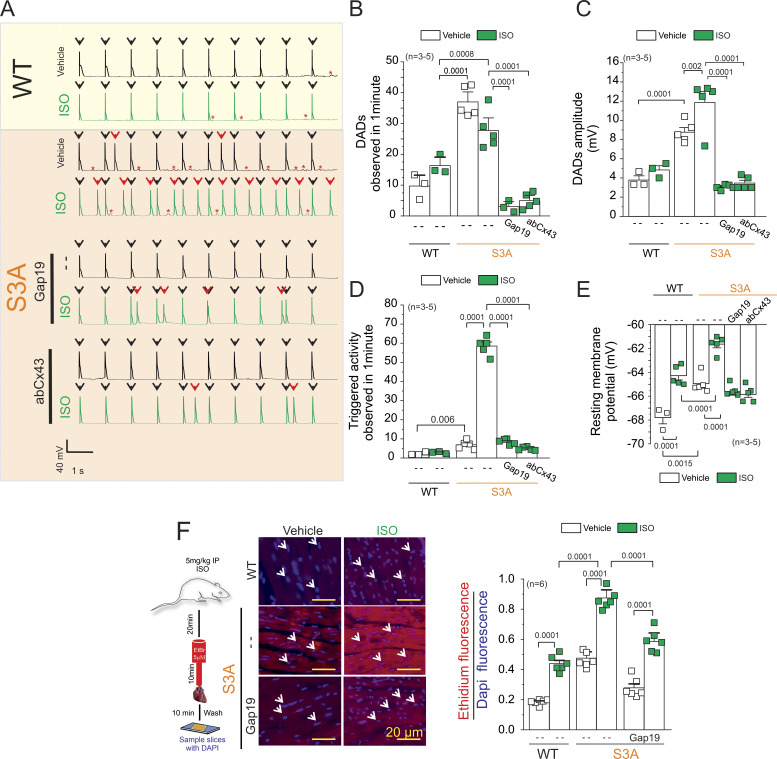
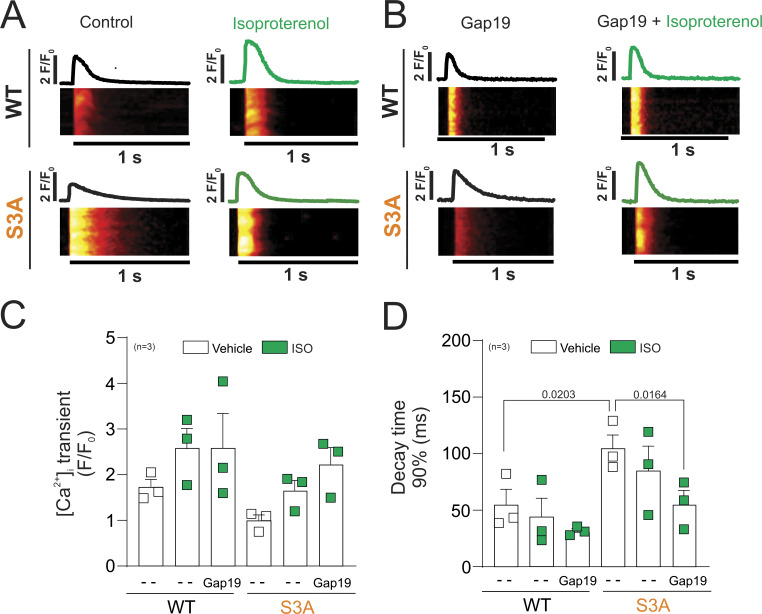
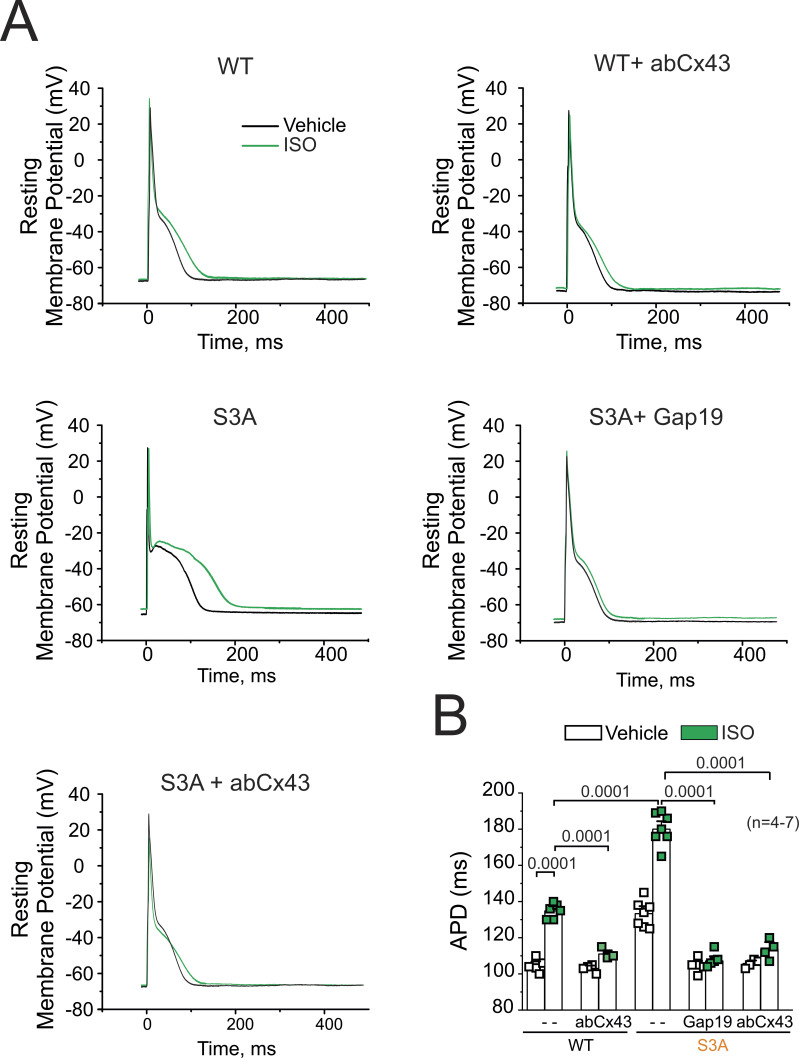
Connexin-43 (Cx43) is the most abundant protein forming gap junction channels (GJCs) in cardiac ventricles. In multiple cardiac pathologies, including hypertrophy and heart failure, Cx43 is found remodeled at the lateral side of the intercalated discs of ventricular cardiomyocytes. Remodeling of Cx43 has been long linked to spontaneous ventricular arrhythmia, yet the mechanisms by which arrhythmias develop are still debated. Using a model of dystrophic cardiomyopathy, we previously showed that remodeled Cx43 function as aberrant hemichannels (non-forming GJCs) that alter cardiomyocyte excitability and, consequently, promote arrhythmias. Here, we aim to evaluate if opening of remodeled Cx43 can serve as a general mechanism to alter cardiac excitability independent of cellular dysfunction associated with a particular cardiomyopathy. To address this issue, we used a genetically modified Cx43 knock-in mouse (S3A) that promotes cardiac remodeling of Cx43 protein without apparent cardiac dysfunction. Importantly, when S3A mice were subjected to cardiac stress using the β-adrenergic agonist isoproterenol (Iso), they displayed acute and severe arrhythmias, which were not observed in WT mice. Pretreatment of S3A mice with the Cx43 hemichannel blocker, Gap19, prevented Iso-induced abnormal electrocardiographic behavior. At the cellular level, when compared with WT, Iso-treated S3A cardiomyocytes showed increased membrane permeability, greater plasma membrane depolarization, and Ca2+ overload, which likely caused prolonged action potentials, delayed after depolarizations, and triggered activity. All these cellular dysfunctions were also prevented by Cx43 hemichannel blockers. Our results support the notion that opening of remodeled Cx43 hemichannels, regardless of the type of cardiomyopathy, is sufficient to mediate cardiac-stress-induced arrhythmogenicity.


Conflict of interest statement

Disclosures: The authors declare no competing interests exist.

Figures

Figure 1.
Figure 1.
Cx43 hemichannels are lateralized in cardiomyocytes of S3A mice. (A) Representative confocal immunofluorescence images of cardiac intercalated discs and lateral regions of cardiomyocytes stained with Cx43 (green) and N-cadherin (red). Yellow and white arrows indicate the intercalated disc and lateral side, respectively. Right: Quantification of Cx43/N-cadherin colocalization in confocal immunofluorescence images. All data points were normalized to the WT group mean. Between three and five images containing 15–20 IDs were analyzed per heart. Each dot represents the mean value for each biological replicate. Comparisons between groups were made using Student’s t test, P = 0.0001 vs. WT. The number in parentheses indicates the n total mice value. (B) Western blot analysis (left) and quantification (right) of Cx43 from biotin-perfused hearts (biotinylation). The bottom row represents Cx43-immunoblotted samples from heart lysates prior to pulldown (total Cx43). Biotinylated Cx43 levels were expressed as fold change relative to total Cx43 protein levels per sample. The number in parentheses indicates the n total mice value. Comparisons between groups were made using Student’s t test, P = 0.0001 vs. WT. Source data are available for this figure: SourceData F1.
Figure 2.
Figure 2.
β-adrenergic cardiac stress promotes arrhythmogenic phenotypes in S3A mice, which are prevented by blocking Cx43 hemichannels. (A) Representative ECG traces obtained from 4–6-mo-old mice using an in vivo telemetry system in WT, S3A, and S3A mice treated with Gap19 via retroorbital injection (10 μg/kg). Scale bar is 100 ms for all traces. Black arrows indicate PVC arrhythmia events. (B) Arrhythmia scores 1-h post-Iso challenge based on a predetermined scale where 0 = no arrhythmias, 1 = single PVCs, 2 = double PVCs, 3 = triple PVCs or non-sustained VT, 4 = sustained VT or AV block, 5 = death. Comparisons between groups were made using two-way ANOVA plus Tukey’s post-hoc test, P = 0.0001 WT vs. S3A; P = 0.0001 S3A vs. S3A + Gap19. The number in parentheses indicates biological replicates. (C) Quantification of arrhythmogenic events (including PVC, double PVC, VT, or AV block) during the 24 h post-Iso challenge in WT, S3A, and S3A mice treated with Gap19 via retroorbital injection (10 μg/kg). P = 0.0001 WT vs. S3A; P = 0.0001 S3A vs. S3A + Gap19; P = 0.00703 WT vs. S3A + Gap19. The number in parentheses indicates biological replicates. Comparisons between groups were made using two-way ANOVA plus Tukey’s post-hoc test.
Figure 3.
Figure 3.
Isoproterenol induces TA in S3A cardiomyocytes via the opening of Cx43 hemichannels. (A) Representative AP traces of WT and S3A isolated cardiomyocytes. Cells were stimulated with 1 µM Iso (green) in the absence or presence of Cx43 blockers contained inside the pipette: Gap19 (232 ng/μl) and Cx43 antibody (abCx43; 2.5 ng/μl). Black arrows indicate electrical stimulation pulse. Red arrows indicate TAs. Red asterisks display DADs. (B) Quantification of DADs observed in A. P = 0.0001 WT + Iso vs. S3A; P = 0.0008 WT + Iso vs. .S3A + Iso; P = 0.0001 S3A + Iso vs. S3A + Iso + Gap19 and S3A + Iso + abCx43. Comparisons between groups were made using nested-ANOVA plus Tukey’s post-hoc test. The number in parentheses indicates biological replicates. We analyzed three to five cells per mouse. (C) Quantification of DADs amplitude observed in A. P = 0.0001 WT vs. S3A; P = 0.002 S3A vs. S3A + Iso; P = 0.0001 S3A + Iso vs. S3A + Iso + Gap19 and S3A + Iso + abCx43. Comparisons between groups were made using nested-ANOVA plus Tukey’s post-hoc test. The number in parentheses indicates biological replicates. We analyzed three to five cells per mouse. (D) Quantification of TA observed in A. Comparisons between groups were made using nested-ANOVA plus Tukey’s post-hoc test. The number in parentheses indicates biological replicates. We analyzed three to five cells per mouse. P = 0.006 WT vs. S3A; P = 0.0001 S3A vs. S3A + Iso; P = 0.0001 S3A + Iso vs. S3A + Iso + Gap19 and S3A + Iso + abCx43. (E) Resting membrane potential of WT and S3A cardiomyocytes. The number in parentheses indicates the n total mice value. We analyzed three to five cells per mouse. P = 0.0001 WT vs. WT + Iso; P = 0.0015 WT vs. S3A; P = 0.0001 WT + Iso vs. S3A + Iso; P = 0.0001 S3A vs. S3A + Iso. Comparisons between groups were made using nested-ANOVA plus Tukey’s post-hoc test. (F) Evaluation of Cx43 hemichannel activity in the whole heart via ethidium uptake. Isolated hearts were perfused with buffer containing 5 μM ethidium after vehicle or Iso (5 mg/kg, IP). The number in parentheses indicates biological replicate. P = 0.0001 WT vs. WT + Iso; P = 0.0001 WT + Iso vs. S3A + Iso; P = 0.0001 S3A vs. S3A + Iso; P = 0.0001 S3A + Iso vs. S3A + Iso + Gap19. Comparisons between groups were made using two-way ANOVA plus Tukey’s post-hoc test.
Figure S1.
Figure S1.
Injection of hyperpolarizing current is sufficient to regulate DAD and TA in isolated S3A cardiomyocytes. (A) Representative APs traces of S3A isolated cardiomyocytes in the absence or presence of 1 μM Iso. Hyperpolarizing currents (20–12 pA) were injected to maintain the resting membrane potential close to −68 mV (value observed in WT cardiomyocytes). Black arrows indicate electrical stimulation pulse. Red arrows indicate TAs. Red asterisks display DADs. (B) Quantification of DADs observed in 1 min. (C) Quantification of DADs amplitude. (D) Quantification of TAs detected in 1 min. The number in parentheses indicates biological replicates. Comparisons between groups were made using nested-ANOVA plus Tukey’s post-hoc test.
Figure 4.
Figure 4.
S3A cardiomyocytes show an increased duration of [Ca2+]i transients compared to WT cardiomyocytes, which was prevented by Cx43 hemichannel blockade. (A and B) Representative line scan images from WT (top) and S3A (bottom) myocytes under field stimulation (1 Hz) in control conditions (A) and after incubation with Gap19 peptide (200 µM; B). The traces above each line scan represent the spatially averaged time curse of [Ca2+]i for each image. The number in parentheses indicates biological replicates. We analyzed three to five cells per mouse. (C and D) Amplitude quantification (C) and decay time 90% (ms) quantification (D). The number in parentheses indicates the n value. P = 0.0012 WT vs. S3A; P = 0.0067 S3A vs. S3A + Gap19. Comparisons between groups were made using nested-ANOVA. The number in parentheses indicates biological replicates. We analyzed three to five cells per mouse.
Figure 5.
Figure 5.
Activation of β-adrenergic signaling decreases the duration of [Ca2+]i transients in S3A cardiomyocytes treated with Gap19. (A) Line scan images from representative WT (top) and S3A (bottom) cardiomyocytes under field stimulation (1 Hz) under control conditions (left) and after isoproterenol stimulation (right). (B) Line scan images from representative cardiomyocytes previously loaded with the Gap19 peptide (200 µM) before (left) and after (right) Iso stimulation (green). The traces above each line scan represent the spatially averaged time curse of [Ca2+]i for each image. The number in parentheses indicates biological replicates. (C and D) We analyzed three to five cells per mouse. C and D show scatter plots of the amplitude and time to 90% decay, respectively. P = 0.0203 WT vs. S3A; P = 0.0164 S3A vs. S3A + Iso + Gap19. The number in parentheses indicates the n value. Comparisons between groups were made using nested-ANOVA. The number in parentheses indicates biological replicate. We analyzed three to five cells per mice.
Figure 6.
Figure 6.
Cx43 hemichannels are involved in APD prolongation in WT and S3A isolated cardiomyocytes. (A) Representative AP traces of WT and S3A isolated cardiomyocytes. Cells were stimulated with 1 µM Iso (green) in the absence or presence of Cx43 blockers contained inside the pipette: Gap19 (232 ng/μl) and Cx43 CT antibody (abCx43; 2.5 ng/μl). (B) Quantification of APD observed in A. P = 0.0001 WT vs. WT + Iso; P = 0.0001 WT + Iso vs. WT + Iso + abCx43, P = 0.0001 WT + Iso vs. S3A + Iso, P = 0.0001 S3A + Iso vs. S3A + Iso + Gap19 and S3A + Iso + abCx43. Comparisons between groups were made using nested-ANOVA. The number in parentheses indicates biological replicate. We analyzed three to five cells per mouse.
Figure 7.
Figure 7.
β-adrenergic cardiac stress evokes triggered activity in S3A cardiac cells via S-nitrosylation of lateralized Cx43 hemichannels. (A) Representative AP traces of S3A isolated cardiomyocytes. Cells were stimulated with 1 μM Iso in the presence of 100 μM L-NAME (NOS blocker) or 1 µM DEENO (NO donor). Arrow indicates electrical stimulation. Black arrows indicate electrical stimulation pulse. Red arrows indicate TAs. Red asterisks display DADs. (B) Quantification of DADs observed in A. P = 0.0001 S3A vs. S3A + L-NAME, P = 0.0001 S3A + Iso vs. S3A + ISO + L-NAME, P = 0.0195 S3A + L-NAME vs. S3A + L-NAME + Iso. Comparisons between groups were made using nested-ANOVA. The number in parentheses indicates biological replicates. We analyzed three to five cells per mouse. (C) Quantification of DADs amplitude observed in A. P = 0.0390 S3A vs. S3A + L-NAME, P = 0.0034 S3A + Iso vs. S3A + L-NAME, P = 0.0001 NO vs. S3A + L-NAME. Comparisons between groups were made using nested-ANOVA. The number in parentheses indicates biological replicates. We analyzed three to five cells per mouse. (D) Quantification of TA observed in A. P = 0.0001 S3A vs. S3A + Iso; P = 0.0001 S3A + Iso vs. S3A + Iso + L-NAME. Comparisons between groups were made using nested-ANOVA. The number in parentheses indicates biological replicates. We analyzed three to five cells per mouse. (E) Resting membrane potential of WT and S3A cardiomyocytes. P = 0.0001 S3A vs. S3A + Iso; P = 0.0001 vs. S3A vs. S3A + NO; P = 0.0001 S3A vs. S3A + L-NAME. Comparisons between groups were made using nested-ANOVA. The number in parentheses indicates biological replicates. We analyzed three to five cells per mouse. (F) Representative current traces before and after application of 10 μM DEENO in a non-injected oocyte or an oocyte expressing Cx43 and Cx43S3A. Oocytes were clamped to −80 mV, and square pulses from −80 mV to +90 mV (in 10 mV steps) were then applied for 2 s. At the end of each pulse, the membrane potential was returned to −80 mV. Intracellular injection of Gap19 (232 ng/μl) or a Cx43 CT antibody (2.5 ng/μl) reduces NO-induced Cx43 hemichannel currents. (G) Normalized currents were obtained from the ratio between recorded currents after and before DEENO treatment. The number in parentheses indicates biological replicate. We analyzed three to five oocytes per frog. P = 0.002 Cx43 vs. Cx43S3A; P = 0.0001 Cx43S3A vs. Cx43S3A + Gap19. Comparisons between groups were made using two-way ANOVA plus Tukey’s post-hoc test. (H) Changes in resting membrane potential in the presence or absence of 10 μM DEENO. Cx43 hemichannel blockers restore normal resting membrane potential. Comparisons between groups were made using two-way ANOVA plus Tukey’s post-hoc test.
Figure 8.
Figure 8.
β-adrenergic cardiac stress evokes S-nitrosylation lateralized Cx43 proteins. (A) Representative images of analysis performed by PLA of the interaction between Cx43 and S-nitrosylation. Plasma membrane stained with wheat germ agglutinin (WGA) and S-nitrosylated Cx43 (Cx43-SNO) are shown in green and red, respectively. Scale bar: 50 μm. (B) Quantification of PLA dots signals observed in A. P = 0.015 WT vs. WT + Iso; P = 0.0001 WT + Iso vs. S3A + Iso; P = 0.0001 S3A vs. S3A + Iso. Comparisons between groups were made using two-way ANOVA plus Tukey’s post-hoc test. The number in parentheses indicates biological replicate. (C) The relative percentage of Cx43-NO dots signal at the lateral side of cardiomyocytes detected in A. Note that S3A-Iso enhanced lateralized signal. P = 0.0001 WT vs. S3A + Iso; P = 0.0001 WT + Iso vs. S3A + Iso; P = 0.0001 S3A vs. S3A + Iso. Comparisons between groups were made using two-way ANOVA plus Tukey’s post-hoc test. The number in parentheses indicates biological replicate. (D) Analysis of cell areas are detected in WT and S3A mice under a vehicle and upon Iso stimulation. (E) Top and middle gels were loaded with S-nitrosylated proteins pulled down using the biotin switch assay. The top gel was then blotted against Cx43. The middle gel is the corresponding ponceau staining. The lower blot was loaded using total cardiac proteins and blotted against Cx43 from heart samples blotted against Cx43. The bottom graph is the quantification for two independent blots using the ratio for SNO-Cx43/total Cx43. P = 0.0270 WT vs. WT + Iso; P = 0.0074 WT + Iso vs. S3A + Iso; P = 0.0002 S3A vs. S3A + Iso. Comparisons between groups were made using two-way ANOVA plus Tukey’s post-hoc test. The number in parentheses indicates biological replicate. Source data are available for this figure: SourceData F8.
Figure S2.
Figure S2.
S3A mice displayed arrhythmogenic behaviors during the dark cycle with and without Iso. (A) Quantification of arrhythmogenic events (including PVC, double PVC, VT, or AV block) from 4–6-mo-old mice during the dark and light cycle without Iso in WT, S3A, and S3A mice treated with Gap19 via retroorbital injection (10 μg/kg). The number in parentheses indicates the n value. Comparisons between groups were made using two-way ANOVA plus Tukey’s post-hoc test. (B) Quantification of arrhythmogenic events (including PVC, double PVC, VT, or AV block) from 4–6-mo-old mice during the dark and light cycle upon Iso stimulation (5 mg/kg, IP) in WT, S3A, and S3A mice treated with Gap19 via retroorbital injection (10 μg/kg). The number in parentheses indicates biological replicate. Comparisons between groups were made using two-way ANOVA plus Tukey’s post-hoc test. (C) Movements were detected using an in vivo telemetry system in WT, S3A, and S3A mice treated with Gap19 via retroorbital injection (10 μg/kg). Arrow indicates Iso stimulation. Comparisons between groups were made using two-way ANOVA plus Tukey’s post-hoc test.

References

    1. Abudara, V., Bechberger J., Freitas-Andrade M., De Bock M., Wang N., Bultynck G., Naus C.C., Leybaert L., and Giaume C.. 2014. The connexin43 mimetic peptide Gap19 inhibits hemichannels without altering gap junctional communication in astrocytes. Front. Cell. Neurosci. 8:306. 10.3389/fncel.2014.00306 - DOI - PMC - PubMed
    1. Bruce, A.F., Rothery S., Dupont E., and Severs N.J.. 2008. Gap junction remodelling in human heart failure is associated with increased interaction of connexin43 with ZO-1. Cardiovasc. Res. 77:757–765. 10.1093/cvr/cvm083 - DOI - PMC - PubMed
    1. Contreras, J.E., Sáez J.C., Bukauskas F.F., and Bennett M.V.. 2003. Gating and regulation of connexin 43 (Cx43) hemichannels. Proc. Natl. Acad. Sci. USA. 100:11388–11393. 10.1073/pnas.1434298100 - DOI - PMC - PubMed
    1. De Smet, M.A., Lissoni A., Nezlobinsky T., Wang N., Dries E., Pérez-Hernández M., Lin X., Amoni M., Vervliet T., Witschas K., et al. . 2021. Cx43 hemichannel microdomain signaling at the intercalated disc enhances cardiac excitability. J. Clin. Invest. 131:131. 10.1172/JCI137752 - DOI - PMC - PubMed
    1. Ebihara, L. 1996. Xenopus connexin38 forms hemi-gap-junctional channels in the nonjunctional plasma membrane of Xenopus oocytes. Biophys. J. 71:742–748. 10.1016/S0006-3495(96)79273-1 - DOI - PMC - PubMed

Publication types