. 2023 Aug 7;220(8):e20221816.
doi: 10.1084/jem.20221816. Epub 2023 May 16.

Dietary protein shapes the profile and repertoire of intestinal CD4+ T cells

Affiliations

Dietary protein shapes the profile and repertoire of intestinal CD4+ T cells

Ainsley Lockhart et al. J Exp Med. .

Abstract

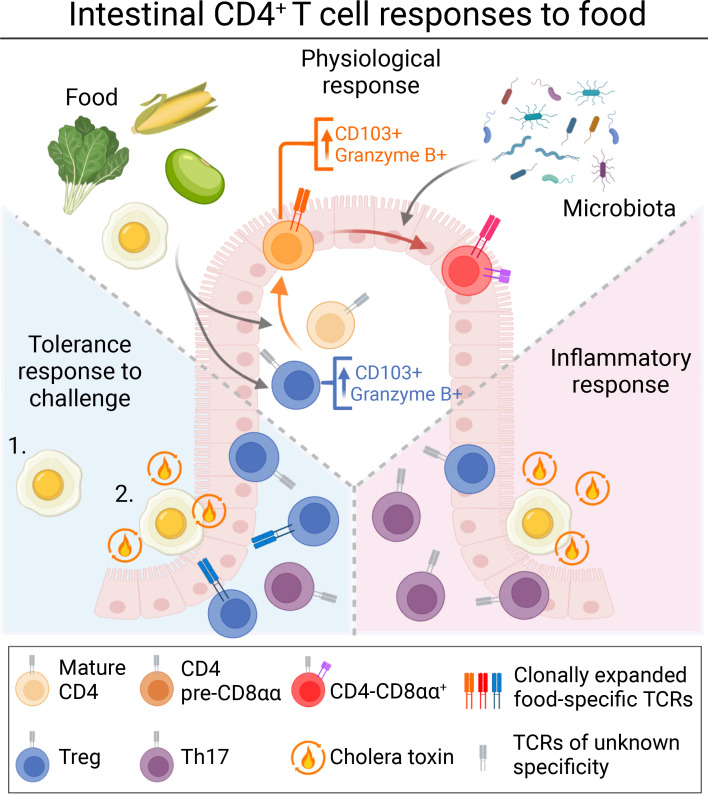
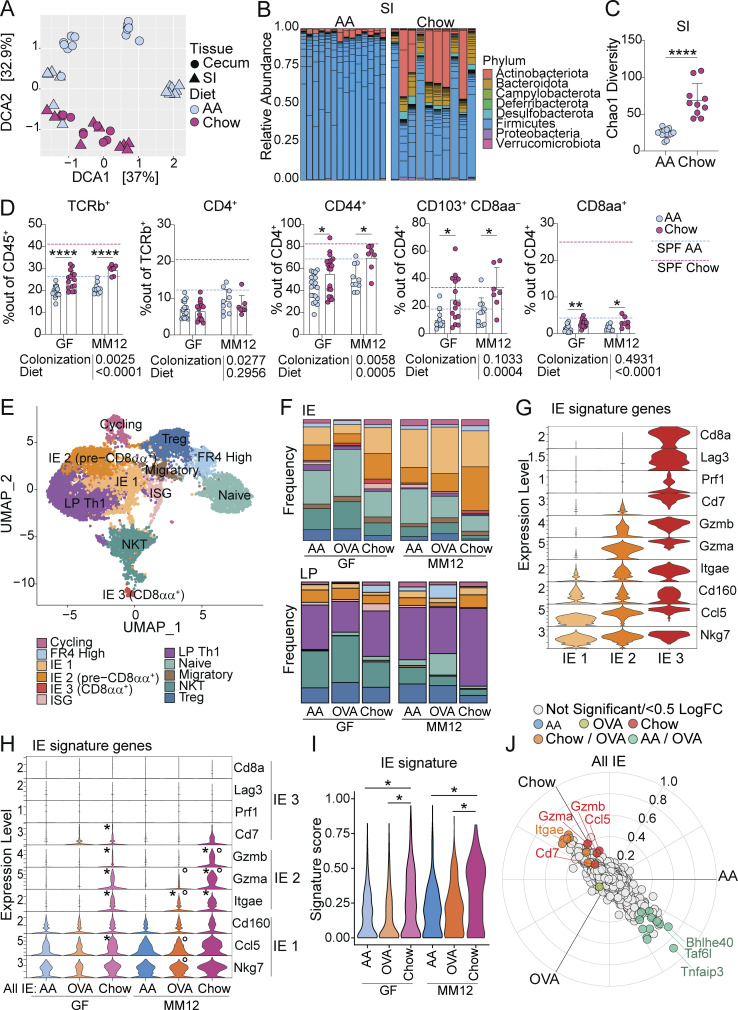
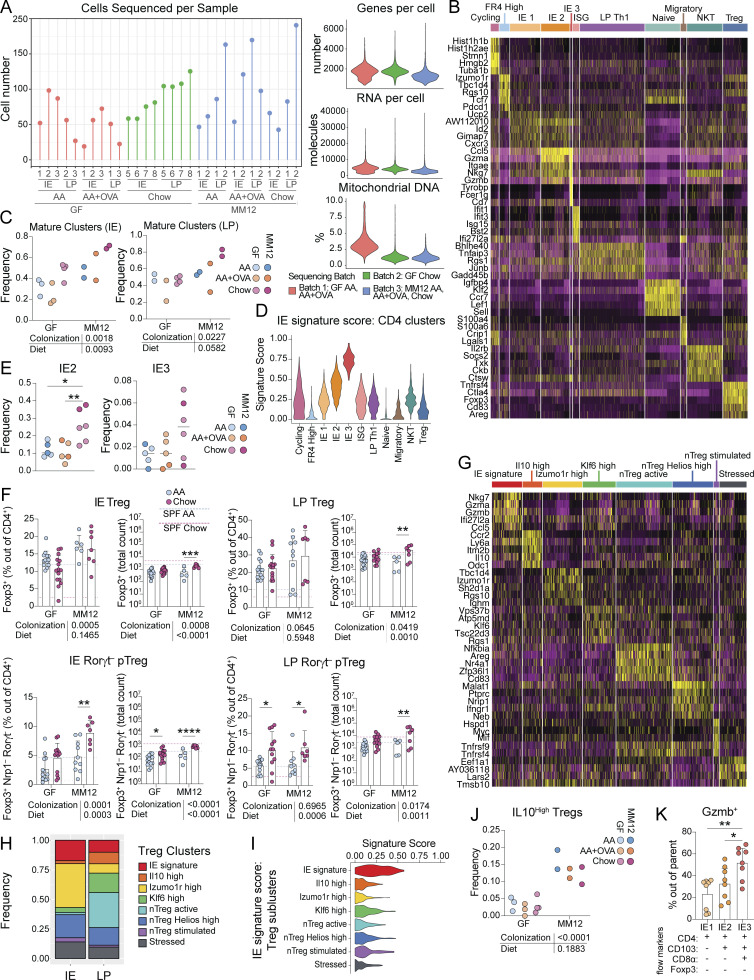
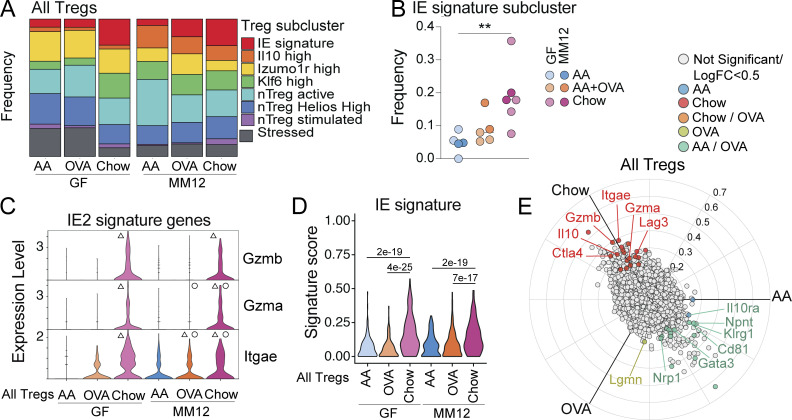
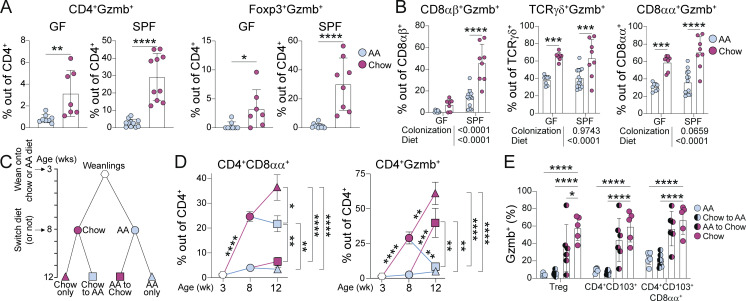
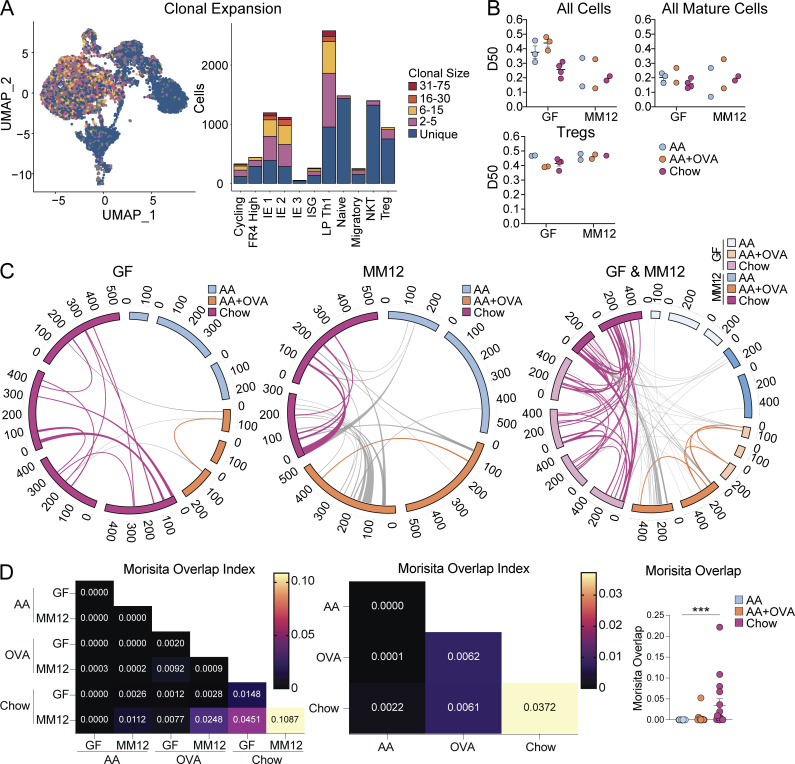
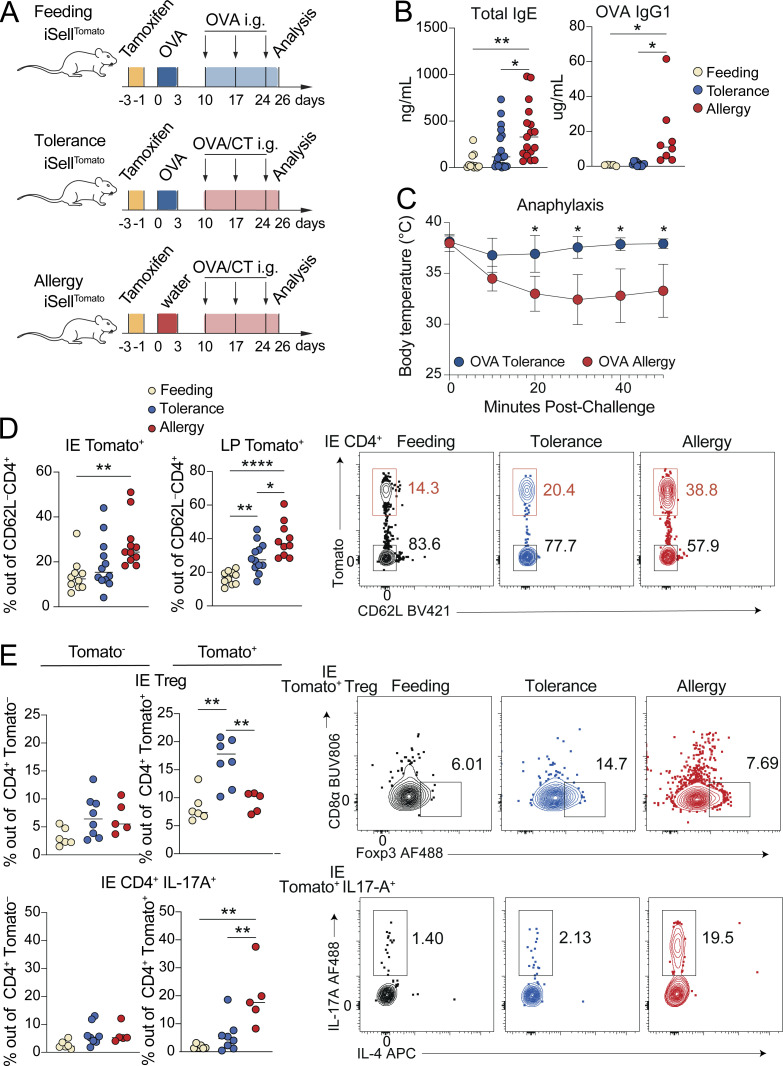
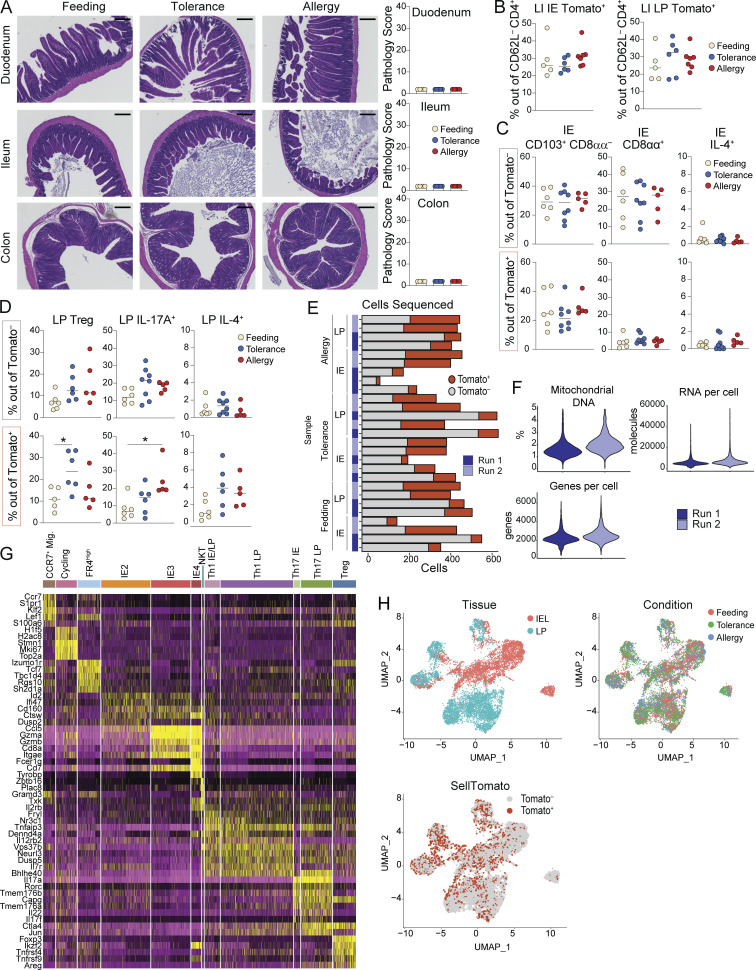
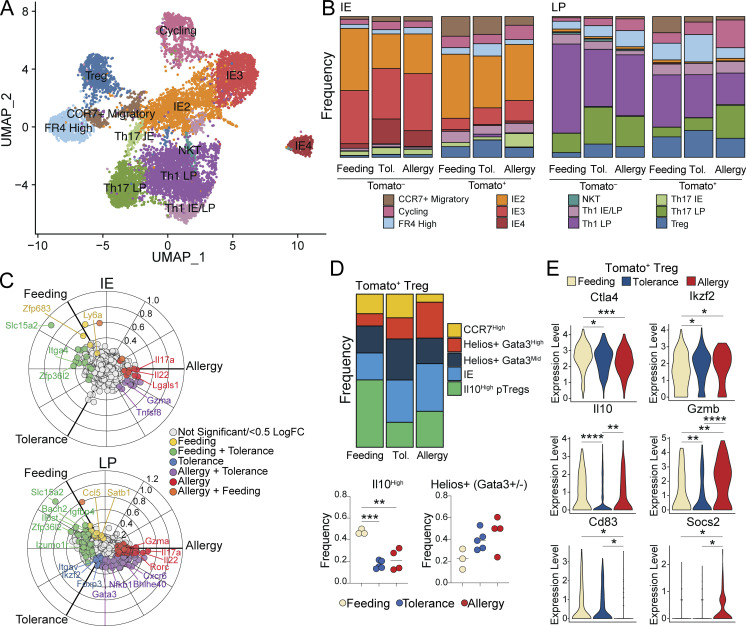
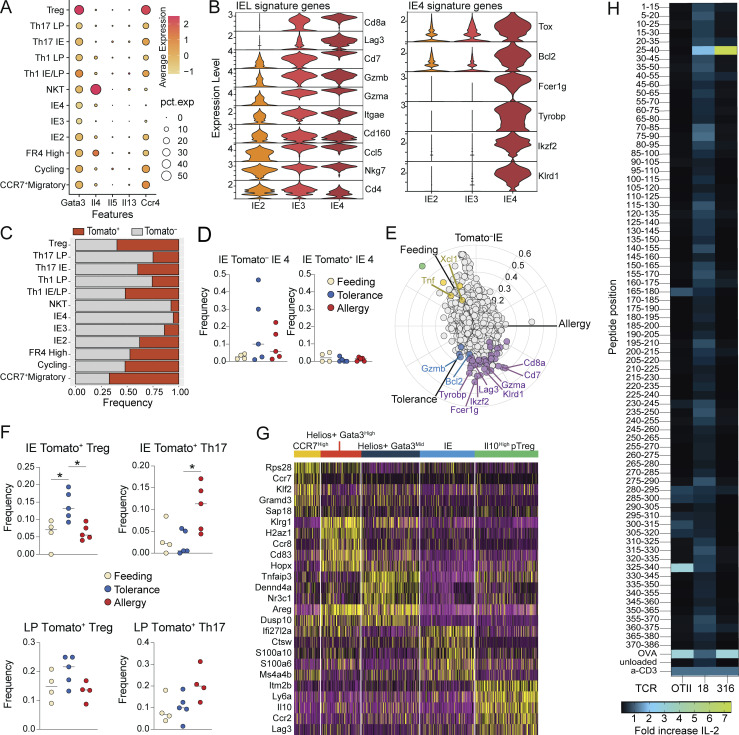
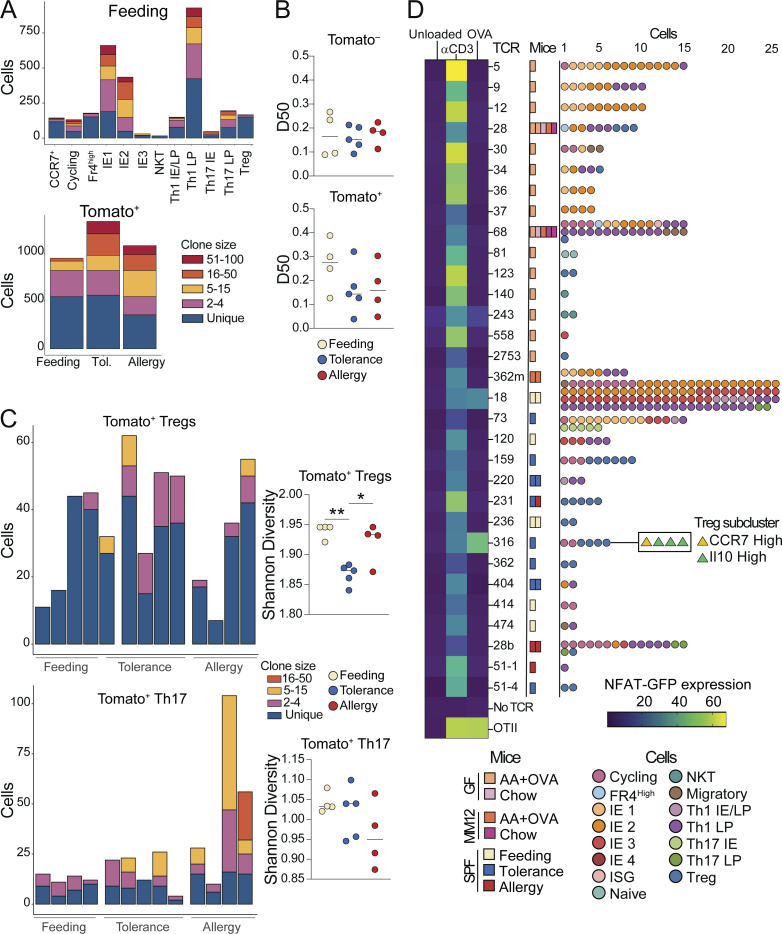
The intestinal immune system must tolerate food antigens to avoid allergy, a process requiring CD4+ T cells. Combining antigenically defined diets with gnotobiotic models, we show that food and microbiota distinctly influence the profile and T cell receptor repertoire of intestinal CD4+ T cells. Independent of the microbiota, dietary proteins contributed to accumulation and clonal selection of antigen-experienced CD4+ T cells at the intestinal epithelium, imprinting a tissue-specialized transcriptional program including cytotoxic genes on both conventional and regulatory CD4+ T cells (Tregs). This steady state CD4+ T cell response to food was disrupted by inflammatory challenge, and protection against food allergy in this context was associated with Treg clonal expansion and decreased proinflammatory gene expression. Finally, we identified both steady-state epithelium-adapted CD4+ T cells and tolerance-induced Tregs that recognize dietary antigens, suggesting that both cell types may be critical for preventing inappropriate immune responses to food.


Conflict of interest statement

Disclosures: The authors declare no competing interests exist.

Figures

None
Graphical abstract
Figure S1.
Figure S1.
AA diet mice are heathy and display no evidence of intestinal damage or inflammation. (A) Percent of original body weight (top) or fecal lipocalin-2 levels measured by ELISA (bottom) from SPF mice at indicated weeks after weaning onto AA or standard chow diet. Mean ± SEM representative of two independent experiments using 19–22 mice per group. Comparisons between diets within timepoints are not significant as calculated by unpaired t test. (B) Serum nutritional biomarkers measured in 8-wk-old SPF mice fed AA or chow diet since weaning. ALP—alkaline phosphatase, AST—aspartate aminotransferase, BUN—blood urea nitrogen, HDL—high density lipoprotein, LDL—low density lipoprotein, LDH—lactose dehydrogenase. Two independent experiments, each point represents pooled serum from four to six mice. (C–F) SPF or GF mice were fed AA or standard chow diet from weaning until analysis at 8 wk old. (C) Small intestine length. (D) Representative H&E histology images with 200 μm scale bar. (E) H&E pathology scores based on one image per tissue per mouse, where 40 is the maximum score (top left), or tissue morphology measures, where each dot represents the average of four measurements per tissue per mouse. (F) Flow cytometry analysis of myeloid cells in the small intestine IE and LP. (C–F) Mean ± SD representative of two independent experiments with six to nine mice per group. Unpaired t tests with Holm-Šidák multiple comparison test, *P < 0.05, **P < 0.01, ***P < 0.001, ****P < 0.0001.
Figure 1.
Figure 1.
Dietary signals promote accumulation and adaptation of intestinal CD4+ T cells in the small intestine epithelium of specific pathogen-free mice. (A–C) Flow cytometry from the IE of SPF mice fed AA or standard chow diet measuring frequency or absolute count of the indicated cell subsets (A–C) or showing representative flow plots pre-gated on CD4+ T cells (B). (A–C) Mean ± SD from three to five independent experiments with 14–18 mice per condition. Unpaired t tests, **P < 0.01, ****P < 0.0001.
Figure S2.
Figure S2.
Dietary signals promote accumulation and adaptation of intestinal CD4+ T cells in the small intestine epithelium. Additional data supporting Figs. 1 and 2. (A–D) Flow cytometry from the small intestine (A–C) or large intestine (D) IE or LP of 8-wk-old SPF mice weaned onto AA or standard chow diet measuring frequency or absolute count of the indicated cell subsets. Mean ± SD representative of three to five independent experiments using 7–18 mice per group. (E) Flow cytometry of transferred OTII CD4+ T cells from the mesenteric lymph nodes (mLN) after 48 h of OVA supplied 1 mg/ml in drinking water as indicated. Data is representative of two independent experiments with three to four mice per group. (F–H) Flow cytometry from the small intestine IE or LP of 8-wk-old SPF mice weaned onto AA diet with or without 1 mg/ml OVA supplied in drinking water (F–G) or AA, casein, or casein–gluten–soy diet (H) measuring frequency or absolute count of the indicated cell subsets. Mean + SD representative of two to three independent experiments using 3–11 mice per group. (I and J) 16S rRNA sequencing of cecum contents of 8-wk-old SPF mice fed AA or standard chow diet represented by relative phyla abundance (I), and SI Chao1 alpha diversity with mean ± SD (J). Data are from four independent experiments using 11–15 mice per condition. (K and L) Flow cytometry from the IE or LP of 8-wk-old GF or Oligo-MM12 mice weaned onto AA or standard chow diet measuring frequency or absolute count of the indicated cell subsets. Dashed lines show mean value from SPF Chow (red) or SPF AA (blue). Bar plots show mean + SD representative of two to three independent experiments using 6–12 mice per group. (A–L) Unpaired t tests (A–D, F, G, and J) or one-way ANOVA with Tukey’s multiple comparison test (E–H), or two-way ANOVA with P values beneath each plot and Holm-Šidák multiple comparison test between diets within each colonization within each plot (K–L), *P < 0.05, **P < 0.01, ***P < 0.001, ****P < 0.0001.
Figure 2.
Figure 2.
Chow diet promotes microbiota-independent epithelial adaptation and cytotoxic transcriptional programming of intestinal CD4+ T cells. (A–C) 16S rRNA sequencing of small intestine (SI) or cecum contents of 8-wk-old SPF mice fed AA or standard chow diet represented by detrended correspondence analysis (DCA; A), relative SI phyla abundance (B), and SI Chao1 alpha diversity with mean ± SD and unpaired t test, ****P < 0.0001 (C). Data is from four independent experiments using 11–15 mice per condition. (D) Flow cytometry from the IE of GF or Oligo-MM12 mice fed AA or standard chow diet measuring frequency of the indicated cell subsets. Dashed lines show mean value from SPF Chow (red) or SPF AA (blue). Mean + SD from three to five independent experiments with 7–16 mice per condition. Two-way ANOVA P values beneath each plot, and Holm-Šidák multiple comparison test between diets within each colonization within each plot, *P < 0.05, **P < 0.01 ****P < 0.0001. (E–J) scRNAseq of 12,139 IE and LP CD4+ T cells from GF or Oligo-MM12 mice fed AA, AA + OVA, or standard chow diet with two to four mice per condition. (E) UMAP visualization of sequenced cells positioned by gene expression similarity and colored by gene expression cluster. (F) Frequency of cells within each cluster from the IE (top) or LP (bottom). (G and H) Expression (Pearson residuals) of IE signature genes within the three IE mature clusters (G) or within all IE CD4+ T cells (H). For H, Wilcoxon rank sum test with Bonferroni correction for multiple comparison, P-adj < 1e−5 were considered statistically significant. Groups labeled with asterisk (*) are significantly higher than AA diet mice within the same colonization group. Groups labeled with a circle (∘) are significantly higher than GF mice from the same dietary group. (I) IE gene signature score grouped by condition. Each data point contributing to the violin plots represents a single sequenced cell. Wilcoxon rank sum test within each colonization group, *P-adj < 1e−5. (J) Three-way volcano plot showing differential gene expression between diets in all sequenced IE CD4+ T cells. Colored genes are differentially expressed (P-adj < 0.05 from FDR-corrected Kruskal–Wallis Test and log2 fold change > 0.5), colored by the diet(s) in which they are upregulated. Select genes of interest are labeled on each plot.
Figure S3.
Figure S3.
Chow diet promotes microbiota-independent epithelial adaptation and cytotoxic transcriptional programming of intestinal CD4+ T cells. Additional data supporting Figs. 2 and 3. (A–E and G–J) CD4+ T cells were sorted from the IE or LP of 8-wk-old GF or Oligo-MM12 mice weaned onto AA, AA + OVA, or standard chow diet and scRNAseq was performed using the 10X Genomics platform, pooling two to four mice per diet/colonization group. The data shown is for all sequenced CD4+ T cells (A–E) or subclustered Tregs (G–J). (A) Number of cells sequenced per indicated sample, colored by sequencing batch (left), and violin plots showing number of detected RNA molecules, number of sequenced genes, or percentage of mitochondrial DNA per cell per sequencing batch (right). (B–G) Top five differentially expressed genes (ranked by fold change) in each UMAP gene expression cluster from total CD4+ T cells (B) or Tregs (G). Wilcoxon rank sum test (P < 0.01). (C–J) Frequency of mature clusters (IE1, IE2, IE3, and Th1 combined; C) or Il10 high Tregs (J). (D–I) IE signature score of total CD4+ T cell (E) or Treg (I) gene expression clusters. (E) Frequency of IE2 or IE3 out of total IE CD4+ T cells. (F) Flow cytometry from the IE or LP of 8-wk-old GF or Oligo-MM12 mice weaned onto AA or standard chow diet measuring frequency or absolute count of the indicated cell subsets. Dashed lines show mean value from SPF Chow (red) or SPF AA (blue). Bar plots show mean + SD representative of two to three independent experiments using three to nine mice per group. (H) Frequency of IE subclusters in IE or LP. (K) Flow cytometry from the IE of 8-wk-old SPF mice weaned onto standard chow diet measuring frequency of Granzyme B out of the indicated cell subsets. Mean + SEM representative of three independent experiments using eight mice per group. (C, E, F, J, and K) Two-way ANOVA with P values beneath each plot and Holm-Šidák multiple comparison test between diets within each colonization within each plot (C, F, and J) or one-way ANOVA with Tukey’s multiple comparison test (E–K), *P < 0.05, **P < 0.01, ***P < 0.001, ****P < 0.0001.
Figure 3.
Figure 3.
Chow diet imprints an epithelial transcriptional signature on intestinal Tregs. scRNAseq of 1,183 IE and LP Tregs from GF or Oligo-MM12 mice fed AA, AA + OVA, or standard chow diet with two to four mice per condition. (A and B) Frequency of cells in each Treg subcluster (A) or in the IE signature subcluster (B). One-way ANOVA displaying with Tukey’s multiple comparisons test, **P < 0.01. (C) Treg expression (Pearson residuals) of IE2 signature genes, grouped by condition. Wilcoxon rank sum test with Bonferroni correction for multiple comparison, P-adj < 1e−5 were considered statistically significant. Groups labeled with a triangle (Δ) are significantly higher than AA diet mice within the same colonization group. Groups labeled with a circle (∘) are significantly higher than GF mice from the same dietary group. (D) Treg IE gene signature score grouped by condition. Each data point contributing to the violin plots represents a single sequenced cell. Wilcoxon rank sum test with P-adj < 1e−5 within each colonization group displayed on the plot. (E) Three-way volcano plot showing differential gene expression between diets in all Tregs. Colored genes are differentially expressed (P-adj < 0.05 from FDR-corrected Kruskal–Wallis Test and log2 fold change > 0.5), colored by the diet(s) in which they are upregulated. Select genes of interest are labeled on each plot.
Figure 4.
Figure 4.
Chow diet induces Granzyme B expression in intestinal T cells. (A and B) Flow cytometry analysis of Granzyme B expression within IE T cell subsets from 8-wk-old SPF or GF mice fed AA or standard chow diet. Mean ± SD from two to three independent experiments with 7–11 mice per condition. Unpaired t tests (A) or two-way ANOVA P values beneath each plot, and P < 0.05 from Holm-Šidák multiple comparison test between diets within each colonization displayed on each plot (B). (C) Schematic of weaning and diet switch experiments. (D) Flow cytometry analysis of 3-, 8-, and 12-wk-old SPF mice fed chow or AA diets according to schematic C. Mean ± SEM from two to five independent experiments with 5–18 mice per condition. One-way ANOVA comparing conditions in 12-wk-old mice displaying P < 0.05 from Tukey’s multiple comparison test to the right of each plot. Unpaired t tests comparing consecutive timepoints between conditions with Holm-Šidák correction for multiple comparisons displayed on plot. (E) Flow cytometry of Granzyme B expression within IE T cell subsets from 12-wk-old SPF mice fed chow or AA diets according to schematic C. Mean ± SD from two independent experiments with five to seven mice per condition. Two-way ANOVA displaying P < 0.05 from Dunnett’s multiple comparison test comparing each group against chow only. (A–E) *P < 0.05, **P < 0.01, ***P < 0.001, ****P < 0.0001.
Figure 5.
Figure 5.
Exposure to dietary protein drives clonal selection of intestinal CD4+ T cells. scTCRseq of 12,139 IE and LP CD4+ T cells from GF or Oligo-MM12 mice fed AA, AA + OVA, or standard chow diet using two to four mice per condition. (A) Clonal expansion (by TCR nucleotide sequence) of cells visualized by UMAP (left) and bar plot of gene expression clusters (right). (B) D50 in which repertoires are scored from 0 (least diverse) to 0.5 (most diverse) within all cells (top left), mature clusters IE1, IE2, IE3, and LP Th1 combined (top right), and Tregs (bottom left). (C and D) Clonal sharing between mice defined by paired TCRα and TCRβ CDR3 amino acid sequence. NKT cells were discarded from analysis. (C) Circos plots in which each segment represents a mouse, colored by diet and sized by cell count. Links between segments represent public clones which are colored by diet if shared between mice of the same diet or uncolored if shared between mice of different diets. (D) Morisita overlap index heatmaps where each square represents the mean overlap between each mouse in the indicated conditions (left and center) or scatter plot where each dot represents overlap between mice in the same diet (right). Kruskal–Wallis test with Dunn’s multiple comparisons, ***P < 0.001.
Figure 6.
Figure 6.
Tracking intestinal CD4+ T cell responses during OVA feeding, tolerance, or allergy. iSellTomato mice were analyzed on day 26 after treatment with tamoxifen to permanently label naïve T cells and then exposure to OVA in the context of feeding, tolerance, or allergy. (A) Schematic of experimental protocol. (B) Total serum IgE (left) or OVA specific IgG1 (right) as measured by ELISA. One-way ANOVA displaying P < 0.05 from Tukey multiple comparison test. Data is representative of two–three independent experiments with 4–13 mice per group. (C) Anaphylaxis as measured by body temperature of mice at the indicated times after intraperitoneal OVA injection, following four weekly doses of OVA/CT. Mean ± SEM representative of two independent experiments with five to six mice per group. Unpaired t tests with Holm-Šidák multiple comparison test. (D and E) Flow cytometry measuring frequency of Tomato+ out of total CD4+ T cells in the IE or LP (D) or of the indicated CD4+ T cell subsets out of Tomato+ or Tomato CD4+ T cells in the IE (E) with representative flow cytometry plots shown on the right. Mean from four (D) or two (E) independent experiments with 10–12 (D) or 5–8 (E) mice per group. One-way ANOVA with Tukey’s multiple comparison test, showing P values < 0.05. (B−E) *P < 0.05, **P < 0.01, ****P < 0.0001.
Figure S4.
Figure S4.
Intestinal CD4+ T cell responses during OVA feeding, tolerance, or allergy. Additional data supporting Figs. 6 and 7. iSellTomato mice were analyzed on day 26 after treatment with tamoxifen to permanently label naïve T cells and then exposure to OVA in the context of feeding, tolerance, or allergy. (A) Representative H&E histology images with 200 μm scale bar (left) and pathology scores based on one image per tissue per mouse, where 40 is the maximum score (right). Mean + SD representative of two independent experiments using four to five mice per group. (B–D) Flow cytometry measuring frequency of Tomato+ CD4+ T cells in the large intestine (B) or of the indicated CD4+ T cell subsets out of Tomato+ or Tomato CD4+ T cells in the IE (C) or LP (D). Data are representative of two independent experiments with five to eight mice per group. (E–I) scRNAseq of 11,217 Tomato+ and Tomato CD4+ T cells from the IE and LP using four to five mice per condition pooled across two independent experiments and sequencing runs. (E) Captured cells per sample in 10X sequencing experiment with Tomato+ or Tomato assignments. (F) Violin plots showing number of detected RNA molecules, number of sequenced genes, or percent mitochondrial DNA per cell per sequencing run. (G) Top five differentially expressed genes (ranked by fold change) in each UMAP gene expression cluster from total CD4+ T cells. Wilcoxon rank sum test (P < 0.01). (H) UMAP visualization of sequenced cells positioned by gene expression similarity and colored by tissue (top left) or treatment group (top right) or Tomato assignment (bottom left). (A–D) One-way ANOVA with Tukey’s multiple comparison test, *P < 0.05.
Figure 7.
Figure 7.
Distinct intestinal CD4+ T cell responses to OVA feeding, tolerance, and allergy. scRNAseq of 11,217 Tomato+ and Tomato CD4+ T cells from the IE and LP of mice on day 26 of OVA feeding, tolerance, or allergy protocols using four to five mice per condition pooled across two independent experiments. (A) UMAP visualization of sequenced cells positioned by gene expression similarity and colored by gene expression cluster. (B) Frequency of cells within each cluster from the IE (left) or LP (right) within each sample group. (C) Three-way volcano plots showing differential gene expression between conditions in Tomato+ CD4+ T cells from the IE (top) or LP (bottom). Colored genes are differentially expressed (P-adj < 0.05 from FDR-corrected Kruskal–Wallis Test and log2 fold change > 0.5), colored by the condition(s) in which they are upregulated. Select genes of interest are labeled on each plot. (D) Analysis of Treg subclusters among Tomato+ Tregs (496 total cells) showing frequency of all subclusters (above) or Il10+ or pooled Helios+ subsets (below). (E) Differentially expressed Treg functional genes between Tomato+ Tregs (496 total cells) in different conditions. (D and E) One-way ANOVA with Tukey’s multiple comparison test (D) or Wilcoxon rank sum test corrected with FDR (E), *P < 0.05, **P < 0.01, ***P < 0.001, ****P < 0.0001.
Figure S5.
Figure S5.
Intestinal CD4+ T cell responses and antigen specificity during OVA feeding, tolerance, or allergy. Additional data supporting Figs. 7 and 8. (A–G) scRNAseq of 11,217 Tomato+ and Tomato CD4+ T cells from the IE and LP of mice on day 26 of OVA feeding, tolerance, or allergy protocols using four to five mice per condition pooled across two independent experiments and sequencing runs. (A and B) Expression (Pearson residuals) of hallmark Th2 genes (A) or IE or IE4 signature genes (B) in the indicated cell clusters. (C) Frequency of Tomato labeling within each gene expression cluster. (D−F) Frequency of the indicated cell subsets within each group. (E) Three-way volcano plot showing differential gene expression between conditions in Tomato CD4+ T cells from the IE. Colored genes are differentially expressed (P-adj < 0.05 from FDR-corrected Kruskal–Wallis Test and log2 fold change > 0.5), colored by the condition(s) in which they are upregulated. Select genes of interest are labeled on each plot. (G) Top five differentially expressed genes (ranked by fold change) in each Treg subcluster. Wilcoxon rank sum test (P < 0.01). (H) Overlapping OVA peptide library to determine epitope specificity of OVA-responsive TCRs. A library of 15 aa OVA peptides with 10 aa overlap and 5 aa shifts covering the full length of OVA were tested for TCR response in NFAT hybridomas expressing candidate TCRs. Response was measured with an IL-2 ELISA and data is represented as fold increase in IL-2 production compared to the positive control (a-CD3). (D–F) One-way ANOVA with Tukey multiple comparison test, *P < 0.05.
Figure 8.
Figure 8.
Clonal dynamics and antigen-specificity of tolerogenic and inflammatory CD4+ T cell responses to food. (A–C) scTCRseq of 11,217 Tomato+ and Tomato CD4+ T cells from the IE and LP of mice on day 26 of OVA feeding, tolerance, or allergy protocols using four to five mice per condition pooled across two independent experiments. (A) Clonal expansion size (by TCR nucleotide sequence) plotted by gene expression cluster within all OVA feeding cells (top), and by mouse within all Tomato+ cells (bottom). (B) D50 in which repertoires are scored from 0 (least diverse) to 0.5 (completely diverse) within Tomato or Tomato+ cells from each mouse. (C) Clonal expansion size (by TCR nucleotide sequence) among Tomato+ Tregs (above) or Th17 (below) with corresponding Shannon diversity scores to the right. (D) NFAT-GFP assay to determine TCR recognition of OVA relative to a-CD3 (positive control) or unloaded DCs (negative control). Heatmap indicates percent NFAT-GFP expression out of TCR + NFAT hybridoma cells. Mouse experimental group and scRNAseq cluster of cells from which each TCR was identified are indicated to the right. (B and C) One-way ANOVA with Tukey’s multiple comparison test, *P < 0.05, **P < 0.01.

Update of

References

    1. Abadie, V., Discepolo V., and Jabri B.. 2012. Intraepithelial lymphocytes in celiac disease immunopathology. Semin. Immunopathol. 34:551–566. 10.1007/s00281-012-0316-x - DOI - PubMed
    1. Abadie, V., Kim S.M., Lejeune T., Palanski B.A., Ernest J.D., Tastet O., Voisine J., Discepolo V., Marietta E.V., Hawash M.B.F., et al. . 2020. IL-15, gluten and HLA-DQ8 drive tissue destruction in coeliac disease. Nature. 578:600–604. 10.1038/s41586-020-2003-8 - DOI - PMC - PubMed
    1. Andreatta, M., and Carmona S.J.. 2021. UCell: Robust and scalable single-cell gene signature scoring. Comput. Struct. Biotechnol. J. 19:3796–3798. 10.1016/j.csbj.2021.06.043 - DOI - PMC - PubMed
    1. Atarashi, K., Tanoue T., Shima T., Imaoka A., Kuwahara T., Momose Y., Cheng G., Yamasaki S., Saito T., Ohba Y., et al. . 2011. Induction of colonic regulatory T cells by indigenous Clostridium species. Science. 331:337–341. 10.1126/science.1198469 - DOI - PMC - PubMed
    1. Basu, J., Reis B.S., Peri S., Zha J., Hua X., Ge L., Ferchen K., Nicolas E., Czyzewicz P., Cai K.Q., et al. . 2021. Essential role of a ThPOK autoregulatory loop in the maintenance of mature CD4+ T cell identity and function. Nat. Immunol. 22:969–982. 10.1038/s41590-021-00980-8 - DOI - PMC - PubMed

Publication types