Basal forebrain cholinergic neurons are vulnerable in a mouse model of Down syndrome and their molecular fingerprint is rescued by maternal choline supplementation
- PMID: 37191946
- PMCID: PMC10292934
- DOI: 10.1096/fj.202202111RR
Basal forebrain cholinergic neurons are vulnerable in a mouse model of Down syndrome and their molecular fingerprint is rescued by maternal choline supplementation
Abstract
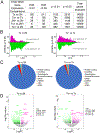
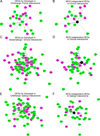
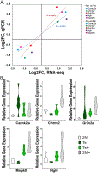
Basal forebrain cholinergic neuron (BFCN) degeneration is a hallmark of Down syndrome (DS) and Alzheimer's disease (AD). Current therapeutics in these disorders have been unsuccessful in slowing disease progression, likely due to poorly understood complex pathological interactions and dysregulated pathways. The Ts65Dn trisomic mouse model recapitulates both cognitive and morphological deficits of DS and AD, including BFCN degeneration and has shown lifelong behavioral changes due to maternal choline supplementation (MCS). To test the impact of MCS on trisomic BFCNs, we performed laser capture microdissection to individually isolate choline acetyltransferase-immunopositive neurons in Ts65Dn and disomic littermates, in conjunction with MCS at the onset of BFCN degeneration. We utilized single population RNA sequencing (RNA-seq) to interrogate transcriptomic changes within medial septal nucleus (MSN) BFCNs. Leveraging multiple bioinformatic analysis programs on differentially expressed genes (DEGs) by genotype and diet, we identified key canonical pathways and altered physiological functions within Ts65Dn MSN BFCNs, which were attenuated by MCS in trisomic offspring, including the cholinergic, glutamatergic and GABAergic pathways. We linked differential gene expression bioinformatically to multiple neurological functions, including motor dysfunction/movement disorder, early onset neurological disease, ataxia and cognitive impairment via Ingenuity Pathway Analysis. DEGs within these identified pathways may underlie aberrant behavior in the DS mice, with MCS attenuating the underlying gene expression changes. We propose MCS ameliorates aberrant BFCN gene expression within the septohippocampal circuit of trisomic mice through normalization of principally the cholinergic, glutamatergic, and GABAergic signaling pathways, resulting in attenuation of underlying neurological disease functions.
Keywords: Alzheimer's disease; Down syndrome; RNA-seq; bioinformatics; laser capture microdissection; maternal choline supplementation; medial septum; selective vulnerability; trisomy.
© 2023 Federation of American Societies for Experimental Biology.
Conflict of interest statement
Conflict of Interest Statement
The authors reported no biomedical financial interests or potential conflicts of interest.
Figures


Similar articles
-
Profiling Basal Forebrain Cholinergic Neurons Reveals a Molecular Basis for Vulnerability Within the Ts65Dn Model of Down Syndrome and Alzheimer's Disease.Mol Neurobiol. 2021 Oct;58(10):5141-5162. doi: 10.1007/s12035-021-02453-3. Epub 2021 Jul 14. Mol Neurobiol. 2021. PMID: 34263425 Free PMC article.
-
Benefits of Maternal Choline Supplementation on Aged Basal Forebrain Cholinergic Neurons (BFCNs) in a Mouse Model of Down Syndrome and Alzheimer's Disease.Biomolecules. 2025 Aug 5;15(8):1131. doi: 10.3390/biom15081131. Biomolecules. 2025. PMID: 40867575 Free PMC article.
-
Maternal choline supplementation protects against age-associated cholinergic and GABAergic basal forebrain neuron degeneration in the Ts65Dn mouse model of Down syndrome and Alzheimer's disease.Neurobiol Dis. 2023 Nov;188:106332. doi: 10.1016/j.nbd.2023.106332. Epub 2023 Oct 26. Neurobiol Dis. 2023. PMID: 37890559 Free PMC article.
-
Basal forebrain cholinergic system in the dementias: Vulnerability, resilience, and resistance.J Neurochem. 2021 Sep;158(6):1394-1411. doi: 10.1111/jnc.15471. Epub 2021 Aug 6. J Neurochem. 2021. PMID: 34272732 Free PMC article. Review.
-
Effect of Estradiol on Neurotrophin Receptors in Basal Forebrain Cholinergic Neurons: Relevance for Alzheimer's Disease.Int J Mol Sci. 2016 Dec 17;17(12):2122. doi: 10.3390/ijms17122122. Int J Mol Sci. 2016. PMID: 27999310 Free PMC article. Review.
Cited by
-
Hippocampal CA1 Pyramidal Neurons Display Sublayer and Circuitry Dependent Degenerative Expression Profiles in Aged Female Down Syndrome Mice.J Alzheimers Dis. 2024;100(s1):S341-S362. doi: 10.3233/JAD-240622. J Alzheimers Dis. 2024. PMID: 39031371 Free PMC article.
-
Profiling hippocampal neuronal populations reveals unique gene expression mosaics reflective of connectivity-based degeneration in the Ts65Dn mouse model of Down syndrome and Alzheimer's disease.Front Mol Neurosci. 2025 Feb 26;18:1546375. doi: 10.3389/fnmol.2025.1546375. eCollection 2025. Front Mol Neurosci. 2025. PMID: 40078964 Free PMC article.
-
Choline supplementation in early life improves and low levels of choline can impair outcomes in a mouse model of Alzheimer's disease.Elife. 2024 Jun 21;12:RP89889. doi: 10.7554/eLife.89889. Elife. 2024. PMID: 38904658 Free PMC article.
-
Cholinergic System Structure and Function Changes in Individuals with Down Syndrome During the Development of Alzheimer's Disease.Curr Top Behav Neurosci. 2025;69:49-78. doi: 10.1007/7854_2024_523. Curr Top Behav Neurosci. 2025. PMID: 39485646 Review.
-
Maternal choline supplementation rescues early endosome pathology in basal forebrain cholinergic neurons in the Ts65Dn mouse model of Down syndrome and Alzheimer's disease.Neurobiol Aging. 2024 Dec;144:30-42. doi: 10.1016/j.neurobiolaging.2024.09.002. Epub 2024 Sep 6. Neurobiol Aging. 2024. PMID: 39265450
References
-
- Parker SE, Mai CT, Canfield MA, Rickard R, Wang Y, Meyer RE, Anderson P, Mason CA, Collins JS, Kirby RS, and Correa A (2010) Updated National Birth Prevalence estimates for selected birth defects in the United States, 2004–2006. Birth Defects Res A Clin Mol Teratol 88, 1008–1016 - PubMed
-
- Mann DM, Yates PO, and Marcyniuk B (1984) Alzheimer’s presenile dementia, senile dementia of Alzheimer type and Down’s syndrome in middle age form an age related continuum of pathological changes. Neuropathol Appl Neurobiol 10, 185–207 - PubMed
-
- Coyle J ML O-G;Reeves RH; Gearhart JD (1988) Down syndrome, Alzheimer’s disease and the trisomy16 mouse. Trends Neurosci. 11, 390–394 - PubMed
-
- Hook EB (1989) Issues pertaining to the impact and etiology of trisomy 21 and other aneuploidy in humans; a consideration of evolutionary implications, maternal age mechanisms, and other matters. Prog Clin Biol Res 311, 1–27 - PubMed
Publication types
MeSH terms
Substances
Grants and funding
LinkOut - more resources
Full Text Sources
Medical
Molecular Biology Databases
Research Materials
Miscellaneous

