. 2023 Jun 22;8(12):e160652.
doi: 10.1172/jci.insight.160652.

An immunosuppressed microenvironment distinguishes lateral ventricle-contacting glioblastomas

Affiliations

An immunosuppressed microenvironment distinguishes lateral ventricle-contacting glioblastomas

Todd Bartkowiak et al. JCI Insight. .

Abstract

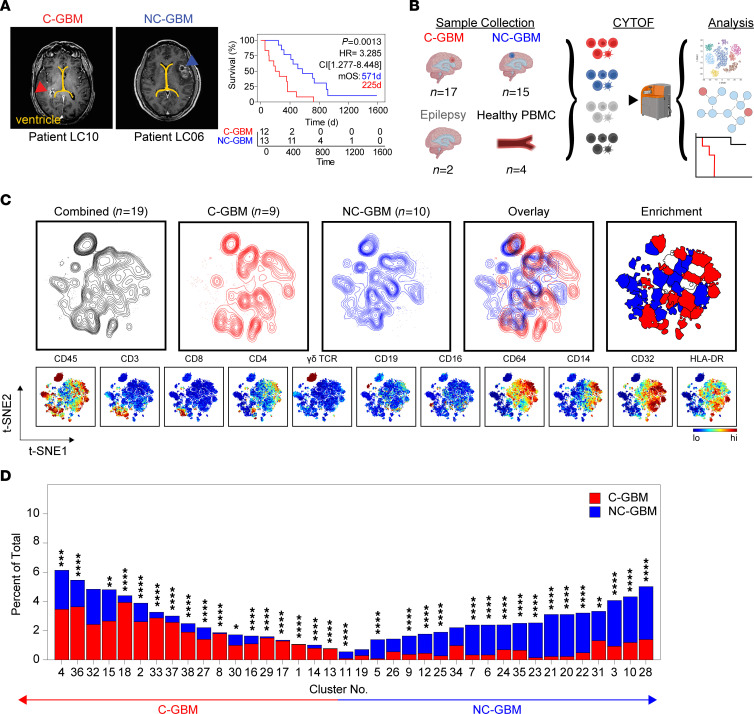
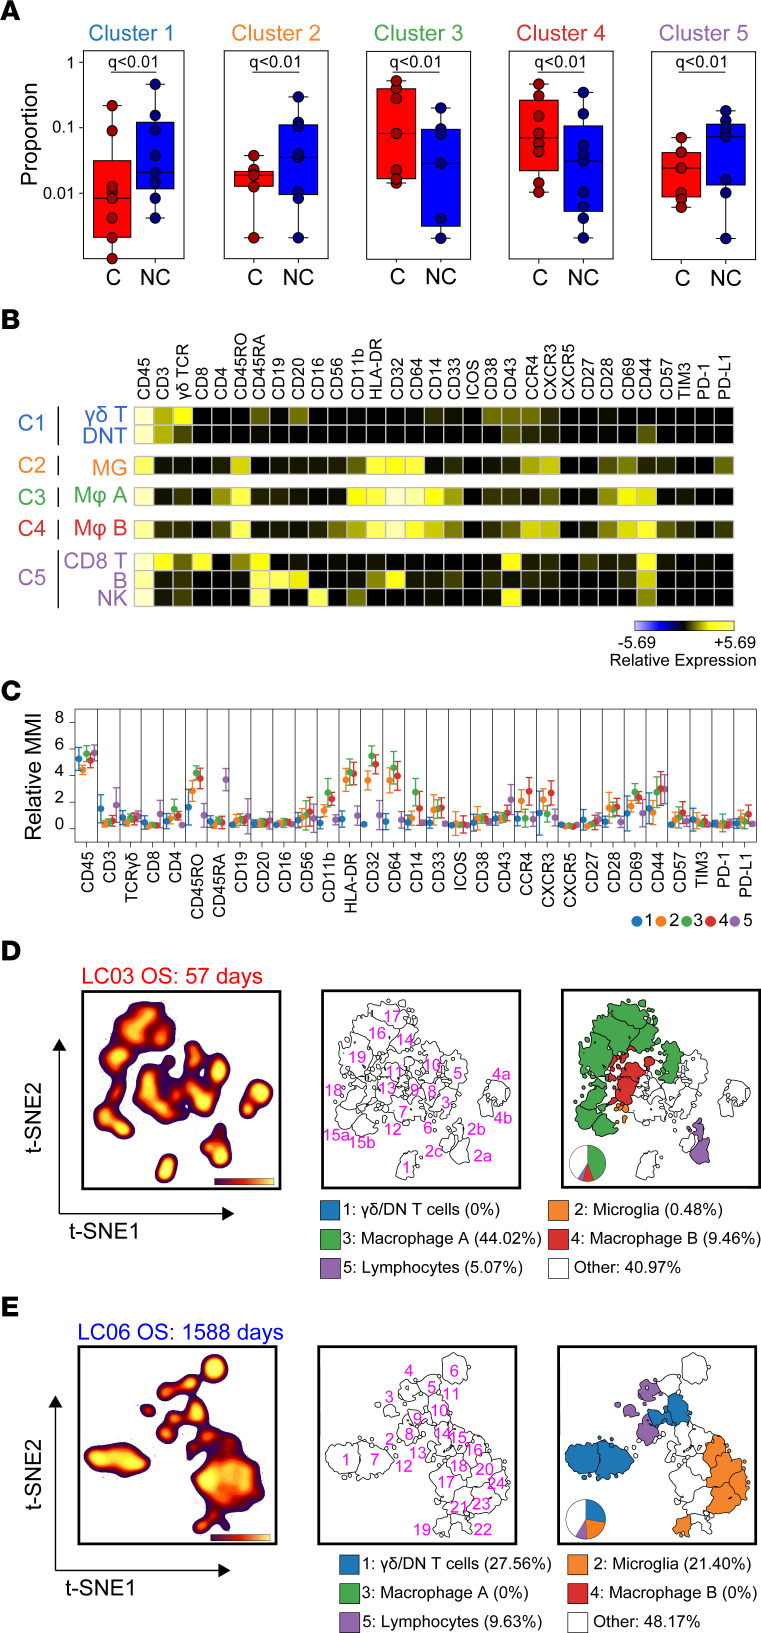
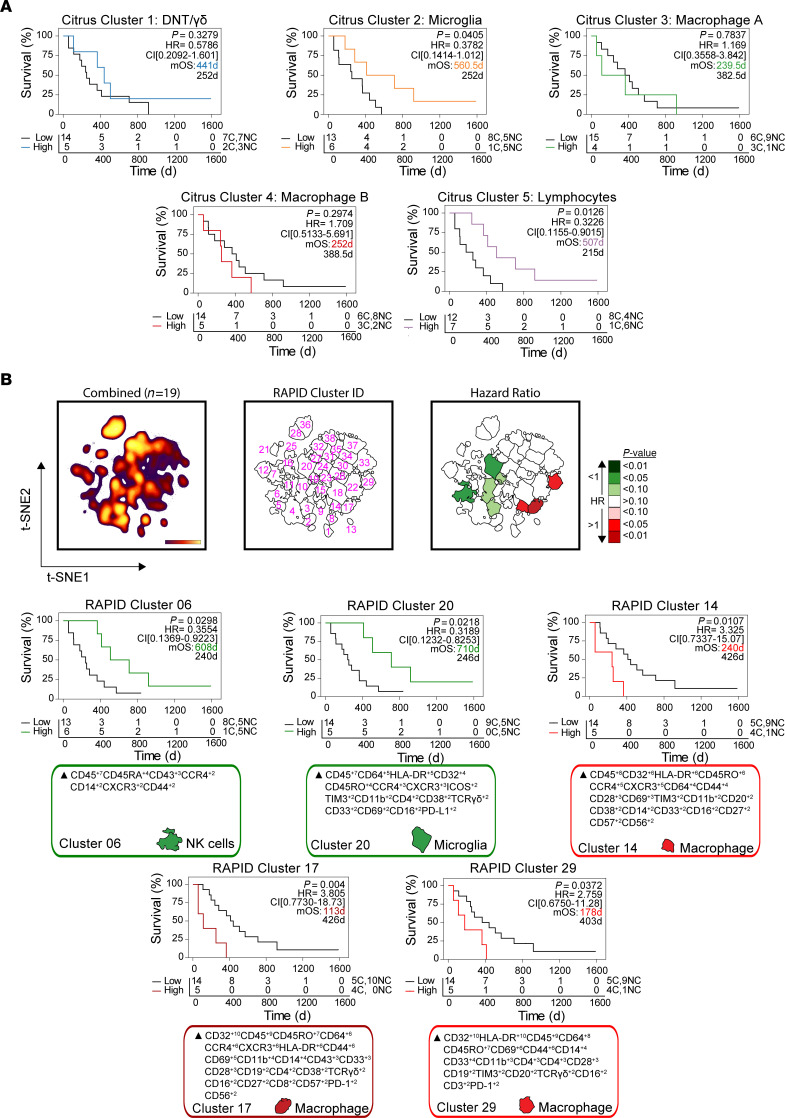
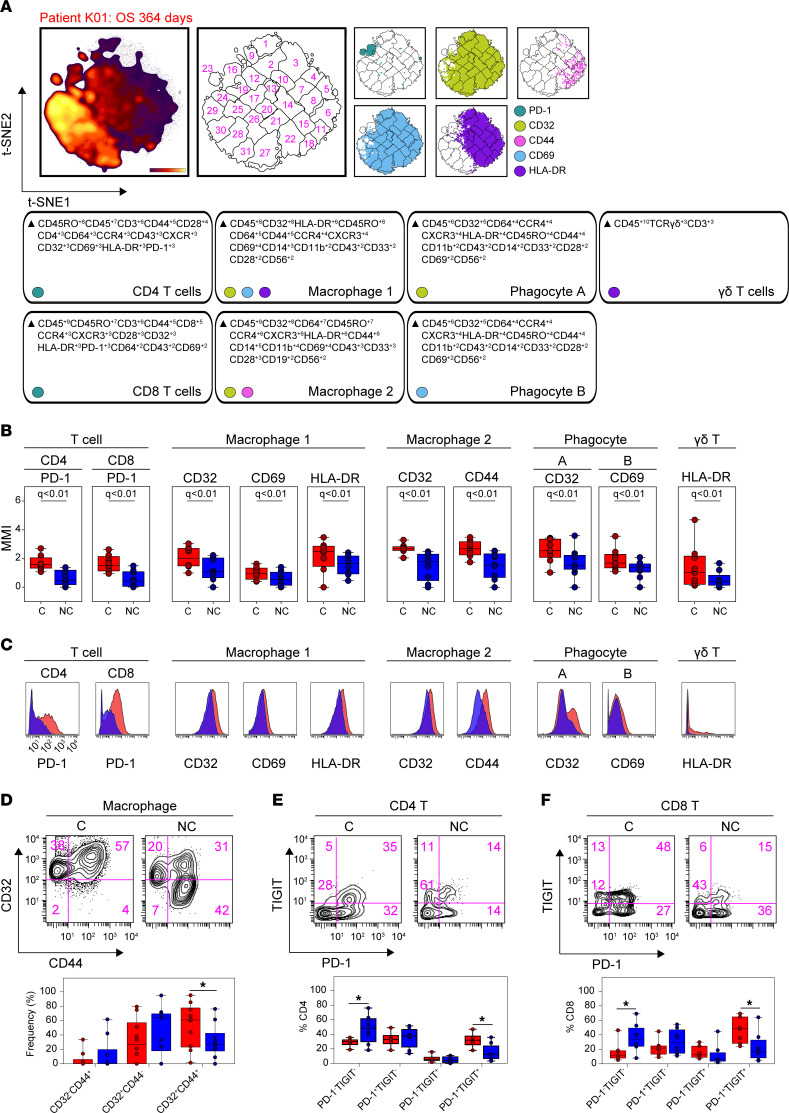
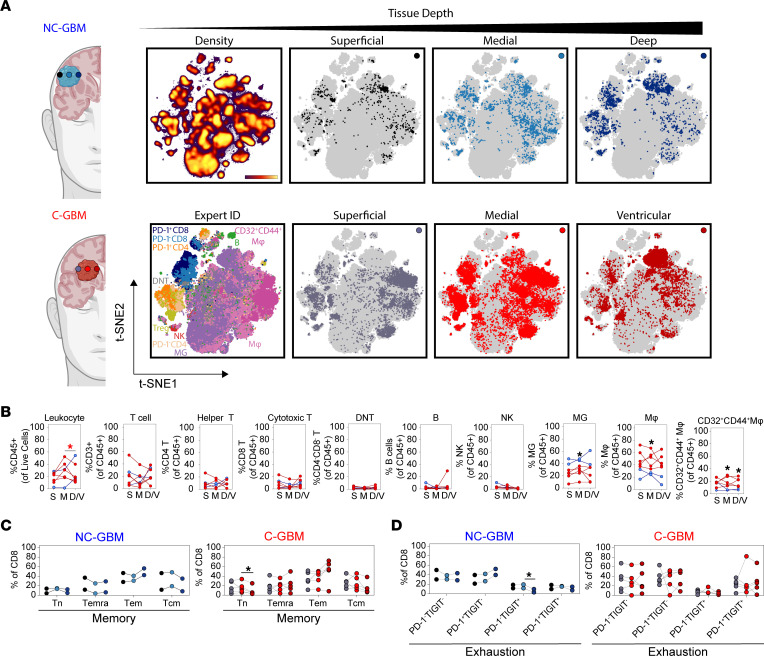
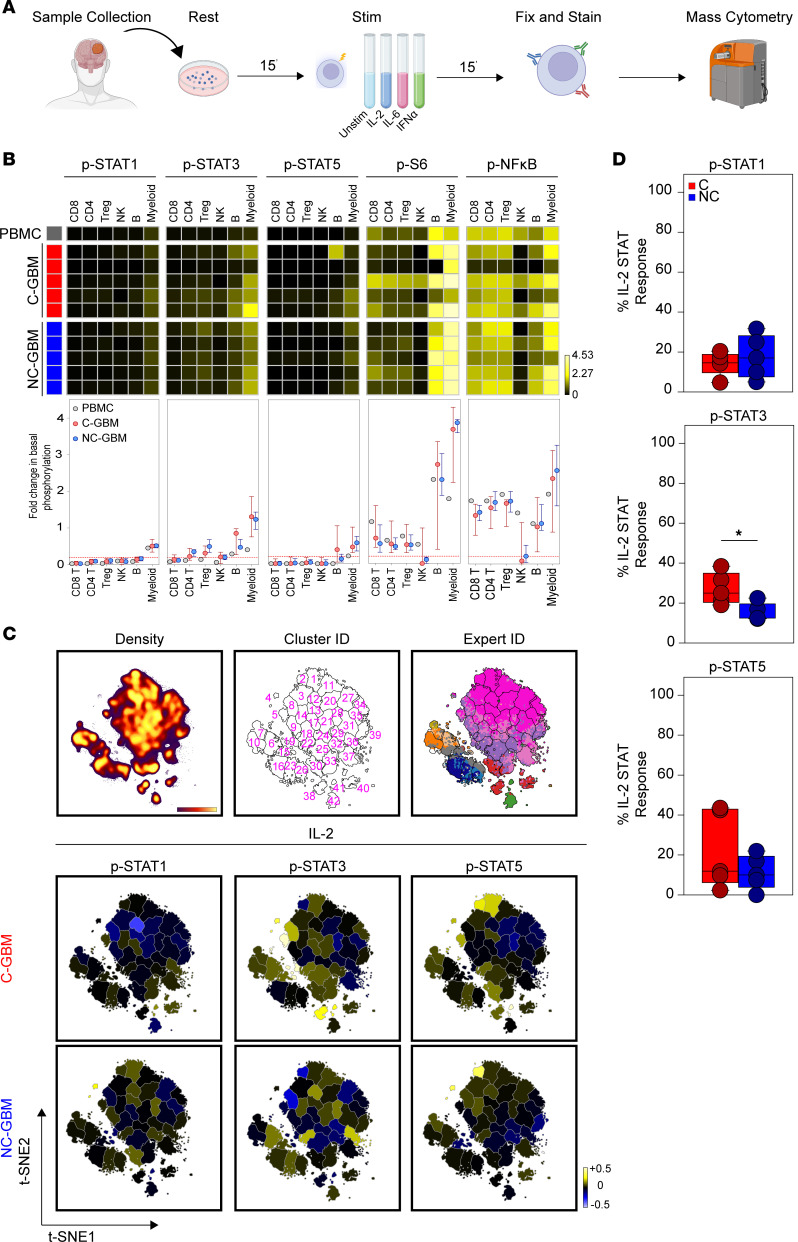
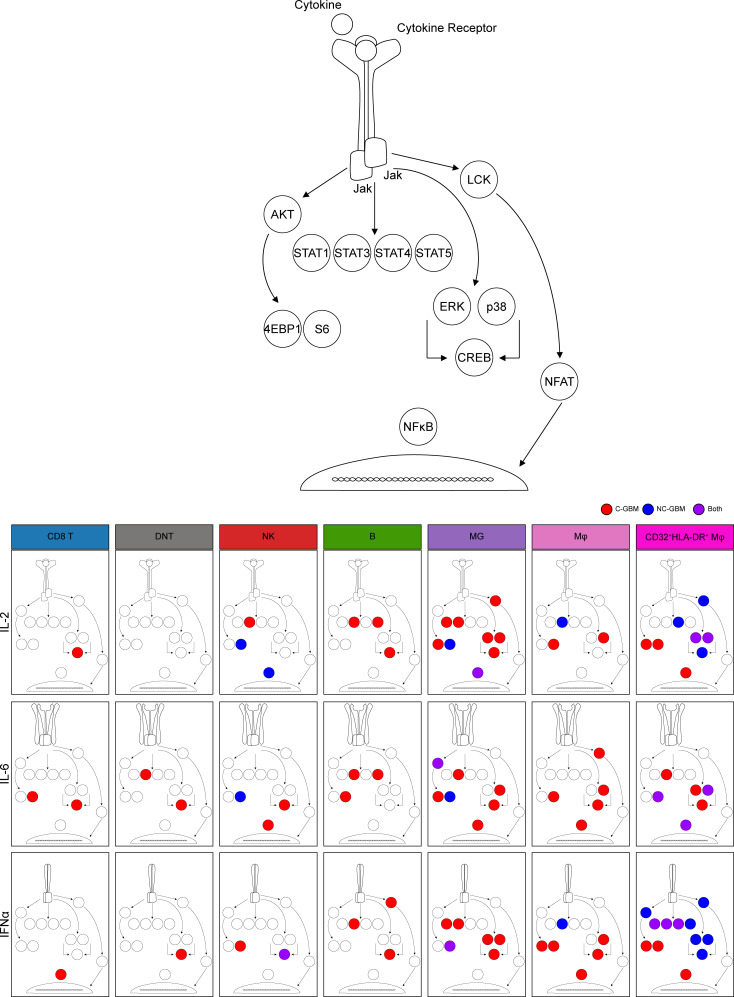
Radiographic contact of glioblastoma (GBM) tumors with the lateral ventricle and adjacent stem cell niche correlates with poor patient prognosis, but the cellular basis of this difference is unclear. Here, we reveal and functionally characterize distinct immune microenvironments that predominate in subtypes of GBM distinguished by proximity to the lateral ventricle. Mass cytometry analysis of isocitrate dehydrogenase wild-type human tumors identified elevated T cell checkpoint receptor expression and greater abundance of a specific CD32+CD44+HLA-DRhi macrophage population in ventricle-contacting GBM. Multiple computational analysis approaches, phospho-specific cytometry, and focal resection of GBMs validated and extended these findings. Phospho-flow quantified cytokine-induced immune cell signaling in ventricle-contacting GBM, revealing differential signaling between GBM subtypes. Subregion analysis within a given tumor supported initial findings and revealed intratumor compartmentalization of T cell memory and exhaustion phenotypes within GBM subtypes. Collectively, these results characterize immunotherapeutically targetable features of macrophages and suppressed lymphocytes in GBMs defined by MRI-detectable lateral ventricle contact.

Keywords: Bioinformatics; Brain cancer; Immunology; Oncology; T cells.


Conflict of interest statement

Conflict of interest: The authors have declared that no conflict of interest exists.

Figures

Figure 1
Figure 1. LV-contacting and -noncontacting GBMs are enriched in distinct immune subsets.
(A) Representative MRI radiographs of GBM tumors with confirmed contact with either of the LVs (left, C-GBM) or lacking ventricular involvement (right, NC-GBM). Yellow line indicates the LV. Arrows indicate the tumor mass. Kaplan-Meier curve indicates the survival proportion in patients with C-GBM (n = 12) and NC-GBM (n = 13). (B) Schematic of experimental workflow. (C) Live CD45+ cells were combined from all patients (black contour, n = 19), C-GBM tumors only (red contour, n = 9), or NC-GBM tumors only (blue contour, n = 10). Overlaid t-SNE plots indicate areas of immune infiltration unique to patients with tumor subtype. Enrichment indicates which computationally gated immune populations were statistically enriched in C-GBM or NC-GBM. Heatmaps displayed for chosen markers indicate major immune subsets. (D) Bar graphs demonstrating the frequency of immune cells found within each computational cluster as a percentage of total CD45+ leukocytes. Statistical significance was calculated using a χ2 test. * = P < 0.05, ** = P < 0.01, *** = P < 0.001, **** = P < 0.0001.
Figure 2
Figure 2. Differential enrichment of 5 immune phenotypes distinguish ventricle-contacting and -noncontacting GBM.
(A) Citrus clustering of live CD45+ leukocytes in the tumor microenvironment of C-GBM and NC-GBM tumors revealed differential enrichment of 5 immune subsets. (B) Heatmaps of each phenotypic marker used to classify each immune subset reveal the expression levels of each immune receptor. (C) Quantification of the arcsinh-transformed expression level of each immune marker within each subset. MMI, median mass intensity. Representative t-SNE plot of all CD45+ leukocytes infiltrating a C-GBM tumor (D) or NC-GBM tumor (E). Cell density (left), FlowSOM clustering on the t-SNE axes (middle), and Citrus overlay and quantification (right) determined the relative frequency of each immune cell subset within each patient sample. In A, a regularized regression model in the Citrus analysis identified stratifying clusters (19 patients: 9 C-GBM, 10 NC-GBM). Predictive analysis of microarrays–stratified (PAM-stratified) immune clusters. An FDR < 1% (q) determined significance in all instances.
Figure 3
Figure 3. Immune subset frequencies correlate with patient outcome.
(A) Kaplan-Meier curves indicating overall survival (OS) in GBM patients (n = 19) with high versus low frequencies of Citrus-identified immune populations. (B) Kaplan-Meier curves for OS in immune subsets stratifying patient outcome identified by RAPID analysis. T-SNE plots indicate the cell density (left), cluster number (middle), and P value of the HR associated with the frequency of each cluster in the entire cohort. Calculated MEM labels identified key features of stratifying immune subsets. P < 0.05 was considered significant.
Figure 4
Figure 4. Immunosuppressive checkpoint receptors are enriched in ventricle-contacting GBMs.
(A) Representative t-SNE plot (n = 19) indicating the density of all CD45+ leukocytes, FlowSOM clusters on the t-SNE axes, and overlaid immune populations with enriched expression of indicated immune markers. MEM labels indicate the cellular phenotype in which the indicated markers were differentially expressed. (B) Box-and-whisker plots indicating the arcsinh-transformed median expression values of indicated immune receptors within Citrus-identified populations (n = 19 patients). (C) Histograms of pooled patient Citrus clusters from C-GBM (red, n = 9) and NC-GBM patients (blue, n = 10). (D) Representative plots indicating the frequency of CD32+CD44+ macrophages identified by Citrus. (E and F) Representative plots demonstrating the frequency of TIGIT and PD-1 coexpression in CD4+ T cells (E) and CD8+ T cells (F) infiltrating GBM tumors. In A, a regularized regression model in the Citrus analysis identified stratifying clusters (n = 19 patients). PAM-stratified immune clusters. An FDR of 1% (q) determined significance. A 2-way ANOVA determined significance in DF from n = 20 total patients. Bars indicate median ± IQR. * = P < 0.05.
Figure 5
Figure 5. Enrichment of CD32+CD44+ macrophages proximal to the LV.
(A) Representative t-SNE plots indicating the CD45+ leukocyte fraction infiltrating focal subregions biopsied from the bulk tumor mass of patients with NC-GBM (n = 2) or C-GBM (n = 5). Paired biopsies were collected from 1) superficial (black/gray), 2) medial (light blue/light red), or 3) deepest region available to safe surgical resection (dark blue/dark red). (B) The frequency of each indicated immune subset was calculated as a fraction of the total cell fraction in the biopsy (leukocytes) or as a fraction of the total leukocyte pool in each sample. S, superficial tumor tissue; M, medial tumor tissue; D/V, deep/ventricular tumor tissue. (C) Frequency of memory CD8+ T cell populations within subregions from NC-GBM (blue) or C-GBM (red). Tn, naive T; Temra, effector memory CD45RA+; Tem, effector memory; Tcm, central memory. (D) Frequency of exhausted CD8+ T cell populations within tumor subregions. Each line in BD represents 1 paired patient sample. One-way ANOVA with Tukey’s multiple comparisons test calculated statistical significance. * = P < 0.05.
Figure 6
Figure 6. Immune cells infiltrating GBM tumors are functional and responsive to cytokine stimulation.
(A) Schema of cytokine stimulation and phospho-protein readouts. (B) Heatmaps indicating the arcsinh fold-transformed median intensity values of each indicated phospho-protein within each manually gated immune subset in healthy donor PBMCs (gray, n = 1), C-GBM tumors (red, n = 5), or NC-GBM tumors (blue, n = 5). Graphs below the heatmaps indicate the median ± IQR for each indicated immune population and phospho-protein readout. (C) Representative t-SNE plot indicating the density of CD45+ leukocytes (left), enumerated FlowSOM clusters (middle), and overlay of expert-gated immune populations onto the clustered t-SNE axes (right) pooled from n = 10 patients. Representative heatmaps on the t-SNE axes indicate the cluster-specific median arcsinh fold-change of the indicated phospho-protein under IL-2 stimulation conditions compared with basal phosphorylation. (D) Box-and-whisker plots indicating the proportion of clusters in C-GBM or NC-GBM immune infiltrates surpassing the phospho-signaling threshold (>0.2 arcsinh fold-change) in response to IL-2 stimulation. Box-and-whisker plots indicate the median ± IQR.
Figure 7
Figure 7. Model of cell signaling networks in GBM immune infiltrates.
Graphical representation of immune cell signaling networks. For each cytokine stimulation condition implemented (rows) and each cell population of interest (columns), an aggregate signaling diagram was generated. Signaling nodes in red indicate active signaling responses to the indicated cytokine stimuli in C-GBM tumors, and blue nodes indicate active signaling responses in NC-GBM. Purple nodes indicate protein phosphorylation in response to stimuli in both patient cohorts.

References

    1. Davis FG, et al. Glioblastoma incidence rate trends in Canada and the United States compared with England, 1995-2015. Neuro Oncol. 2020;22(2):301–302. doi: 10.1093/neuonc/noz203. - DOI - PMC - PubMed
    1. Ostrom QT, et al. Epidemiology of brain and other CNS tumors. Curr Neurol Neurosci Rep. 2021;21(12):68. doi: 10.1007/s11910-021-01152-9. - DOI - PMC - PubMed
    1. Stupp R, et al. Effect of tumor-treating fields plus maintenance temozolomide vs maintenance temozolomide alone on survival in patients with glioblastoma: a randomized clinical trial. JAMA. 2017;318(23):2306–2316. doi: 10.1001/jama.2017.18718. - DOI - PMC - PubMed
    1. Liau LM, et al. Association of autologous tumor lysate-loaded dendritic cell vaccination with extension of survival among patients with newly diagnosed and recurrent glioblastoma: a phase 3 prospective externally controlled cohort trial. JAMA Oncol. 2023;9(1):112–121. doi: 10.1001/jamaoncol.2022.5370. - DOI - PMC - PubMed
    1. Yang P, et al. IDH mutation and MGMT promoter methylation in glioblastoma: results of a prospective registry. Oncotarget. 2015;6(38):40896–40906. doi: 10.18632/oncotarget.5683. - DOI - PMC - PubMed

Publication types