. 2023 May 23;120(21):e2217826120.
doi: 10.1073/pnas.2217826120. Epub 2023 May 16.

PHGDH preserves one-carbon cycle to confer metabolic plasticity in chemoresistant gastric cancer during nutrient stress

Affiliations

PHGDH preserves one-carbon cycle to confer metabolic plasticity in chemoresistant gastric cancer during nutrient stress

Bo Kyung Yoon et al. Proc Natl Acad Sci U S A. .

Abstract

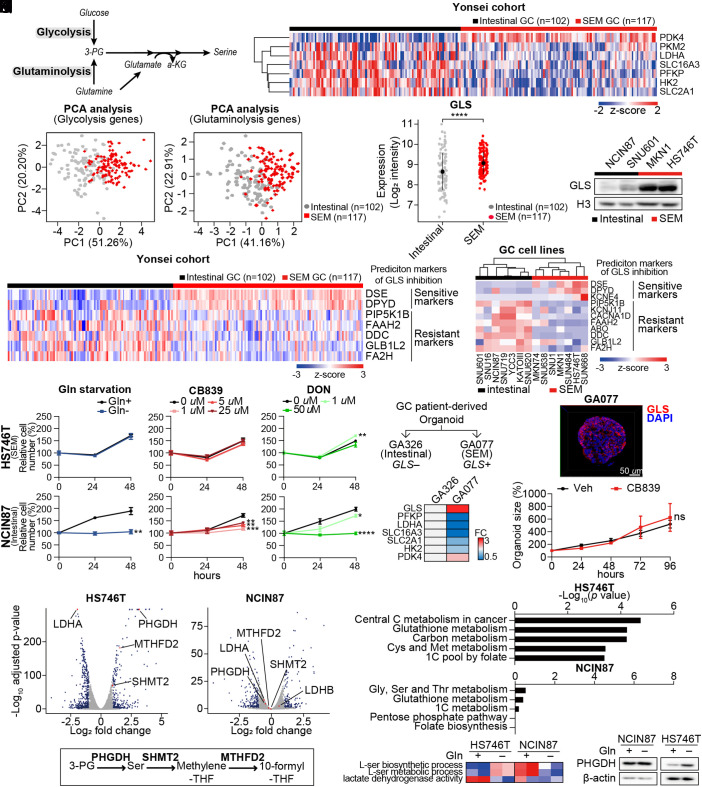
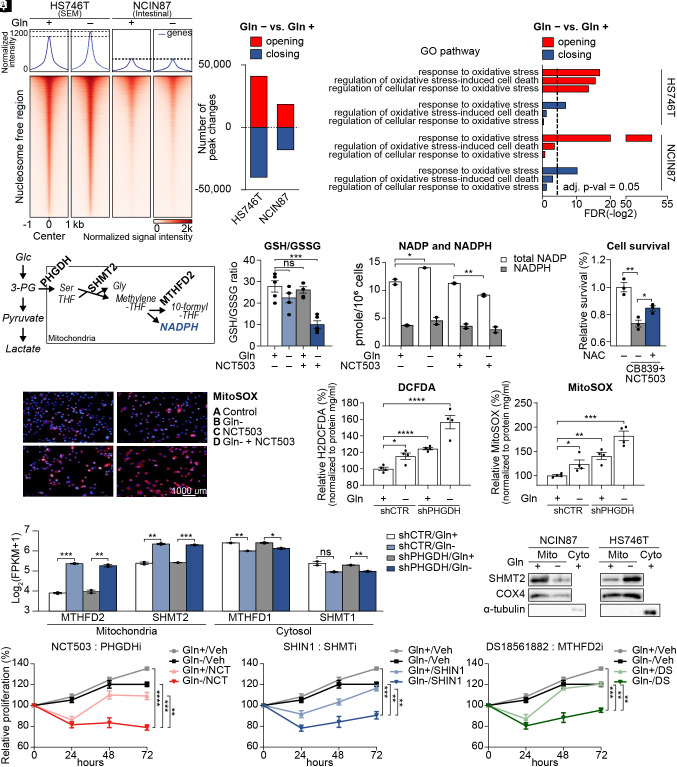
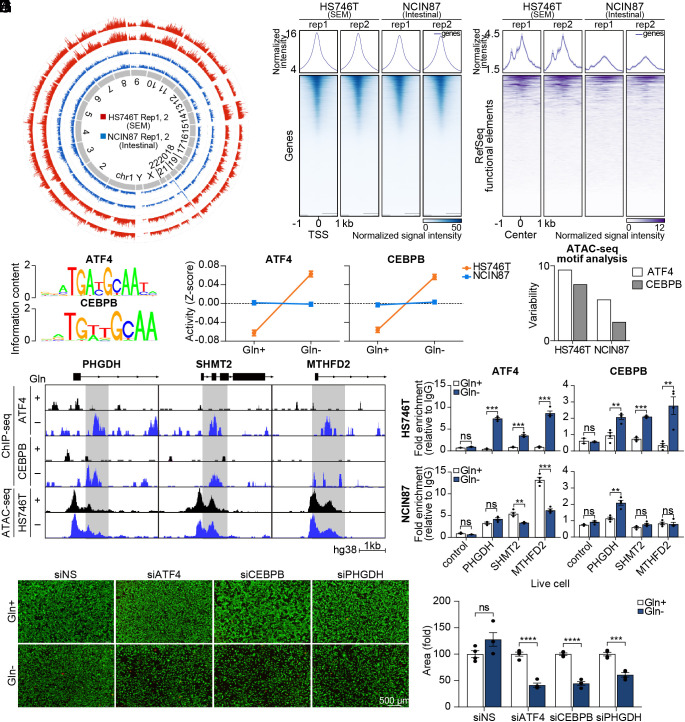
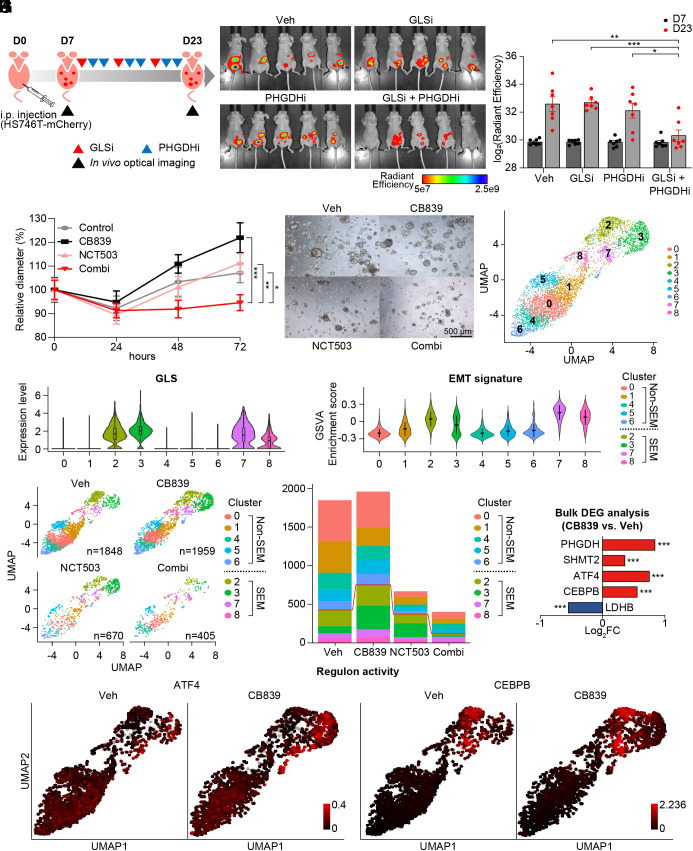
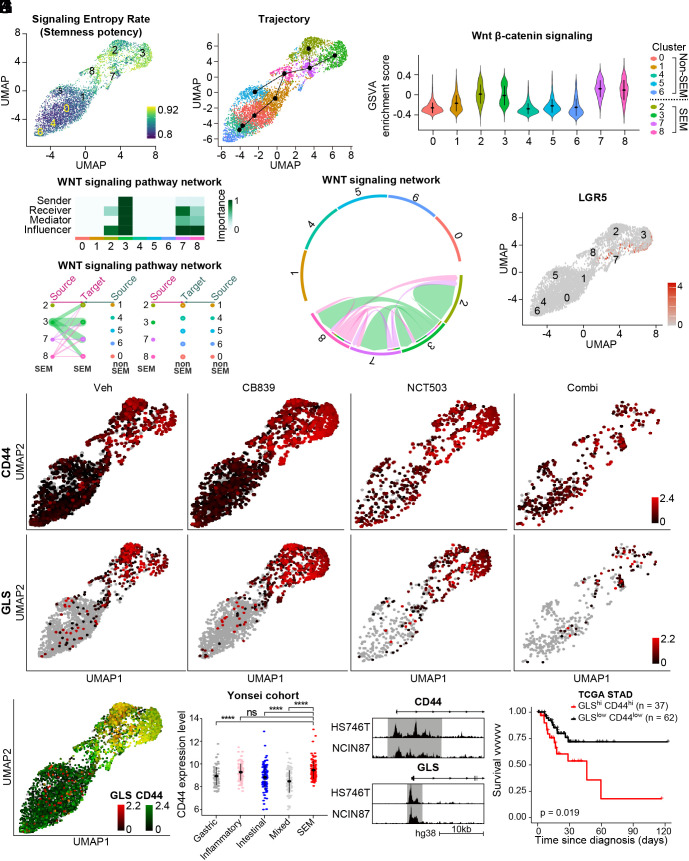
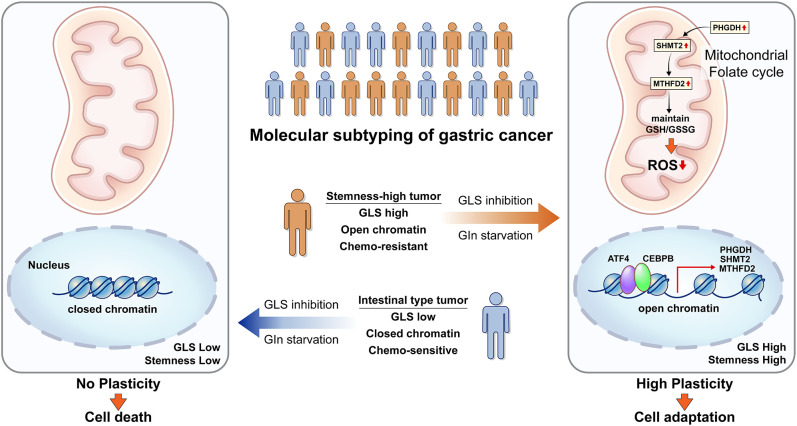
Molecular classification of gastric cancer (GC) identified a subgroup of patients showing chemoresistance and poor prognosis, termed SEM (Stem-like/Epithelial-to-mesenchymal transition/Mesenchymal) type in this study. Here, we show that SEM-type GC exhibits a distinct metabolic profile characterized by high glutaminase (GLS) levels. Unexpectedly, SEM-type GC cells are resistant to glutaminolysis inhibition. We show that under glutamine starvation, SEM-type GC cells up-regulate the 3 phosphoglycerate dehydrogenase (PHGDH)-mediated mitochondrial folate cycle pathway to produce NADPH as a reactive oxygen species scavenger for survival. This metabolic plasticity is associated with globally open chromatin structure in SEM-type GC cells, with ATF4/CEBPB identified as transcriptional drivers of the PHGDH-driven salvage pathway. Single-nucleus transcriptome analysis of patient-derived SEM-type GC organoids revealed intratumoral heterogeneity, with stemness-high subpopulations displaying high GLS expression, a resistance to GLS inhibition, and ATF4/CEBPB activation. Notably, coinhibition of GLS and PHGDH successfully eliminated stemness-high cancer cells. Together, these results provide insight into the metabolic plasticity of aggressive GC cells and suggest a treatment strategy for chemoresistant GC patients.

Keywords: 3 phosphoglycerate dehydrogenase; gastric cancer; glutaminase; metabolic plasticity.


Conflict of interest statement

The authors declare no competing interest.

Figures

Fig. 1.
Fig. 1.
GLS-high SEM-type GC cells are resistant to GLS inhibition via upregulation of 1C metabolic pathway. (A) Schematic of glycolysis and glutaminolysis. (B) Analyses of transcriptomic profiles of tumors of GC patients in the Yonsei cohort. The expression levels of glycolysis-related genes were compared according to the subtypes: SEM (n = 117) and intestinal (n = 102). (C) PCA of GC patients in the Yonsei cohort with glycolysis-related genes introduced in B. (D) PCA of GC patients in the Yonsei cohort with glutaminolysis-related genes introduced in 1B. (E) Expression levels of GLS compared between SEM-type (n = 117) and intestinal subtype GC patients (n = 102) in the Yonsei cohort. (F) Immunoblotting of GLS in gastric cell lines. Histone H3 was used as the loading control. (G and H) Heatmap displaying the expression levels of sensitive markers (DSE, DPYD, and KCNE4) and resistance markers (PIP5K1B, KCNJ11, CACNA1D, FAAH2, ABO, DDC, GLB1L2, and FA2H) for GLS inhibition in the Yonsei cohort and GC cell lines (SRP078289). (I and J) Proliferation assays were performed for 48 h in HS746T and NCIN87 cells under glutamine-deficient and drug-treated conditions. CB839, GLS inhibitor; DON, glutamine antagonist. (K and L) Diagram describes selection of tumors for generation of patient-derived cancer organoids. Heatmap shows fold change in GLS and glycolysis-associated genes. (M) Immunocytochemistry image of GLS in GA077 stained with DAPI. (Scale bar: 50 μm.) (N) Sizes of patient-derived cancer organoid GA077 with or without 5 μM CB839 were measured. Organoid size measured by averaging short and long diameters (Right). n ≥ 5 (O) Transcriptomic profiles of glutamine starvation in HS746T and NCIN87 were analyzed via RNA sequencing analysis. Genes with fold change greater than 1.5 or less than −1.5 with adjusted P-values smaller than 0.05 are marked in blue. PHGDH, MTHFD2, SHMT2, and LDHA genes are marked in red. (P) Schematic of 1C metabolic pathway. (Q) KEGG analysis of differentially expressed genes. The P-values are less than 0.05. (R) GSVA was performed with pathways from MsigDB v7.4. Gene set enrichment score represented as a heatmap. (S) Immunoblot showing the protein levels of PHGDH upon glutamine starvation in HS746T and NCIN87. β-actin was used as a loading control. ns, no significance, *P < 0.05, **P < 0.01, ***P < 0.001, ****P < 0.0001, Wilcox test for 1E and two-tailed Student’s t test for I, J, and N.
Fig. 2.
Fig. 2.
PHGDH-driven salvage pathway inhibits mitochondrial ROS production. (A) Chromatin accessibility heatmap of HS746T and NCIN87 with or without glutamine. Color intensity represents chromatin accessibility. (B) Numbers of peak changes after glutamine starvation were compared (adjusted P < 0.05). (C) Pathway analysis of the most variable peaks introduced in B associated with glutamine starvation. Dotted line indicates adjusted P-value = 0.05. (D) Diagram explaining the mitochondrial folate cycle using PHGDH, SHMT2, and MTHFD2 as a mediating enzymes. (E) GSH/GSSG ratio was measured with glutamine starvation and NCT503 treatment. (F) Total intracellular NADPH and NADP levels in glutamine starvation or NCT503-treated HS746T, normalized to cell number. (G) Cell survival with CB839 and NCT503 treatments in combination with N-acetyl-L-cysteine(NAC) (H) Mitochondrial superoxide visualized with MitoSOX with or without glutamine starvation and NCT503 treatment in HS746T cells. (I) Cellular ROS was measured via fluorescence assay using H2DCFDA in HS746T stable cell lines with or without glutamine. (J) Mitochondrial ROS was measured via fluorescence assay using MitoSOX in HS746T stable cell lines with or without glutamine. (K) RNA sequencing was performed on shControl or shPHGDH-stable HS746T cells with or without glutamine. Expression levels of mitochondrial folate cycle-related genes (MTHFD2 and SHMT2) and cytosolic folate cycle-related genes (MTHFD1and SHMT1) with or without glutamine were marked as log2(FPKM+1). (L) Immunoblot showing the mitochondrial protein level of SHMT2 upon glutamine starvation in HS746T and NCIN87 cells after mitochondrial isolation. (M–O) Proliferation assays for 72 h in HS746T cells. NCT503, PHGDH inhibitor; SHIN1, SHMT1 and SHMT2 inhibitor; DS18561882, MTHFD2 inhibitor. ns, no significance, *P < 0.05, **P < 0.01, ***P < 0.001, ****P < 0.0001, Benjamini–Hochberg adjusted P-value for 2K and two-tailed Student’s t test for E–GI, J, and M–O.
Fig. 3.
Fig. 3.
The landscape of chromatin accessibility shows ATF4 and CEBPB as transcriptional drivers of PHGDH-driven salvage pathway. (A) Circular plot showing genome-wide chromatin accessibility. (B) Heatmap of ATAC-Seq peaks in promoter regions. Color intensity represents chromatin accessibility. The peaks are aligned with the transcription start site (TSS) as the center. (C) Heatmap of ATAC-Seq peaks in RefSeq functional element regions. (D) Oligonucleotide sequence of ATF4- and CEBPB-binding site. (E) ISMARA with RNA sequencing data was performed. Motif activity is shown as a z-score. (F) Variability of motif activity upon glutamine starvation was computed with chromVAR. (G) ATF4 and CEBPB ChIP sequencing analysis were performed. The genome browser shows ChIP-seq profiles within the PHGDH, SHMT2, and MTHFD2 loci. (H) ChIP assay of the MTHFD2, PHGDH, and SHMT2 promoters using ATF4 and CEBPB antibodies in glutamine-deprived HS746T and NCIN87 cells. Data are represented as fold-change. (n = 4) (I) Microscopy images of HS746T cells with or without glutamine along with ATF4, CEBPB, or PHGDH knockdown. Live cells are shown with green color and dead cells are shown with red color. (Scale bar; 500 µm.) (J) The number of live cells was counted. (n = 4) ns, no significance, **P < 0.01, ***P < 0.001, ****P < 0.0001, two-tailed Student’s t test for H and J.
Fig. 4.
Fig. 4.
GLS inhibition activates ATF4/CEBPB-mediated transcriptional network in EMT signature-enriched clusters in patient-derived cancer organoids. (A) Diagram to explain the process in vivo experiment with vehicle, BPTES (12.5 mg/kg), NCT503 (40 mg/kg), or combination of BPTES and NCT503. (B) Representative picture of mice (n = 5) with tumor volume measured via in vivo optical imaging system. Total radiant efficiency (p/sec/cm2/sr/μW/cm2) was measured in peritoneal area. (C) Total radiant efficiency was compared in every group (n =7) before (D7) and after (D23) three cycles of BPTES/NCT503 injection. (D) Patient-derived cancer organoids GA077 were treated with 5 μM CB839, 50 μM NCT503, or both. The size was measured as the average of the short and long diameters (n ≥ 18). (E) Representative microscopy images of the organoid GA077 after different drug treatments. (F) Single-nucleus RNA sequencing was performed on GA077 with vehicle, CB839 (5 μM), NCT503 (50 μM) or both. Uniform manifold approximation projection (UMAP) visualization of cells is shown after integration. (G) The expression level of GLS is shown as a violin plot in the identified cell clusters. (H) GSVA was performed to calculate enrichment score with GO pathway “HALLMARK_ EPITHELIAL_MESENCHYMAL_TRANSITION” from MSigDB v7.4. (I) UMAP visualization of cells under different conditions: vehicle, CB839 (5 μM), NCT503 (50 μM) or both. (J) Fraction of cells from each sample for each cluster. (K) Gene expression level was compared as a bulk tumor. (L) Regulon activity (ATF4 and CEBPB) is marked as a color on the corresponding UMAP. *P < 0.05, **P < 0.01, ***P < 0.001, two-tailed Student’s t test for C and D and Benjamini–Hochberg adjusted P-value for K.
Fig. 5.
Fig. 5.
Coinhibition of GLS and PHGDH shows high efficacy in targeting stemness-high cell clusters. (A) Single-cell entropy (SCENT) analysis. Signaling entropy at the single-cell level was estimated across a population of cells and colored corresponding to the score in the UMAP plot. (B) Inferred cell lineage with Slingshot (C) GSVA was performed with WNT β-catenin signaling pathway from MsigDB v7.4. (D) A heatmap showing the relative importance of each cell cluster based on the computed four network centrality measures of the WNT signaling network. (E) Hierarchical plot showing the inferred intracellular network for the WNT signaling pathway. The color of the circles differs among clusters, and the edge width indicates the communication probability. (F) Inferred WNT signaling network with edge width representing the communication probability. (G) The expression level of LGR5 was plotted on the corresponding UMAP. (H) The expression levels of CD44 and GLS were plotted on the corresponding UMAP. (I) CD44 and GLS were coplotted on the corresponding UMAP with color intensity corresponding to the expression level. (J) The expression level of CD44 is compared according to the subtype in the Yonsei cohort: mixed (n = 99), gastric (n = 89), SEM (n = 117), intestinal (n = 102), and inflammatory (n = 90). (K) The genome browser shows ATAC-seq profiles in the promoter region of CD44 and GLS in HS746T and NCIN87, respectively. (L) Kaplan–Meier plot for CD44high/GLShigh (n = 37) and CD44low/GLSlow group (n = 62) in TCGA stomach adenocarcinoma cohort. One hundred and fifty tumor samples with highest or lowest gene expression were marked as high or low, resulting in the CD44high/GLShigh and CD44low/GLSlow group. Logrank P = 0.019. ns, no significance, ****P < 0.0001, Wilcox test for J.
Fig. 6.
Fig. 6.
The proposed model of how SEM-type GC cells survive in glutamine starvation or GLS inhibition.

References

    1. Cancer Genome Atlas Research, Comprehensive molecular characterization of gastric adenocarcinoma. Nature 513, 202–209 (2014). - PMC - PubMed
    1. Cristescu R., et al. , Molecular analysis of gastric cancer identifies subtypes associated with distinct clinical outcomes. Nat. Med. 21, 449–456 (2015). - PubMed
    1. Sohn B. H., et al. , Clinical significance of four molecular subtypes of gastric cancer identified by the cancer genome atlas project. Clin. Cancer Res. 23, 4441–4449 (2017), 10.1158/1078-0432.CCR-16-2211. - DOI - PMC - PubMed
    1. Cheong J. H., et al. , Predictive test for chemotherapy response in resectable gastric cancer: A multi-cohort, retrospective analysis. Lancet Oncol. 19, 629–638 (2018). - PubMed
    1. Wise D. R., Thompson C. B., Glutamine addiction: A new therapeutic target in cancer. Trends Biochem. Sci. 35, 427–433 (2010). - PMC - PubMed

Publication types