. 2023 May 23;120(21):e2214936120.
doi: 10.1073/pnas.2214936120. Epub 2023 May 16.

Influenza A virus exploits transferrin receptor recycling to enter host cells

Affiliations

Influenza A virus exploits transferrin receptor recycling to enter host cells

Beryl Mazel-Sanchez et al. Proc Natl Acad Sci U S A. .

Abstract

Influenza A virus (IAV) enters host cells mostly through clathrin-dependent receptor-mediated endocytosis. A single bona fide entry receptor protein supporting this entry mechanism remains elusive. Here we performed proximity ligation of biotin to host cell surface proteins in the vicinity of attached trimeric hemagglutinin-HRP and characterized biotinylated targets using mass spectrometry. This approach identified transferrin receptor 1 (TfR1) as a candidate entry protein. Genetic gain-of-function and loss-of-function experiments, as well as in vitro and in vivo chemical inhibition, confirmed the functional involvement of TfR1 in IAV entry. Recycling deficient mutants of TfR1 do not support entry, indicating that TfR1 recycling is essential for this function. The binding of virions to TfR1 via sialic acids confirmed its role as a directly acting entry factor, but unexpectedly even headless TfR1 promoted IAV particle uptake in trans. TIRF microscopy localized the entering virus-like particles in the vicinity of TfR1. Our data identify TfR1 recycling as a revolving door mechanism exploited by IAV to enter host cells.

Keywords: antiviral; endocytosis; influenza A virus; recycling; transferrin receptor 1.


Conflict of interest statement

The authors declare no competing interest.

Figures

Fig. 1.
Fig. 1.
TFRC deficiency hampers IAV entry. (A) TfR1 levels in A549 (n = 3) and primary human tracheobronchial epithelial cells (HTBE, n = 2) as determined by western blot. Beta actin served as a loading control. (B) Single A549 cell clones transfected with a Cas9 expression plasmid only (1 to 4) or a Cas9 expression plasmid containing the cds for a TFRC targeting guide RNA (1.4, 2.3, 2.4 and 3.6) were infected for 4 h with 10 multiplicity of infection (MOI) of PR8. Total cell lysates were separated by SDS-PAGE and analyzed by western blot for NP and TfR1 levels. Beta actin served as a loading control. A representative blot from four independent experiments is shown. (C) Quantification of four independent infection experiments as shown in B. Each symbol refers to one independent experiment performed with one A549 CTRL and one A549 TFRC KO clone, respectively. Statistical significance was determined by a Mann–Whitney test. P values are indicated. (D) Complementation of A549 TFRC KO with lentiviral expression of TfR1 increases early IAV replication. Western Blot of total cell lysates from A549 TFRC KO transduced with empty pLVX IRES puro or pLVX TFRC IRES puro. Cells were selected with puromycin and infected with the indicated MOI of PR8 for 3 h. Total cell lysates were separated by SDS-PAGE and analyzed by western blot for NP and TfR1 levels. Equal loading was confirmed by probing for beta actin. A representative blot of four independent experiments is shown. (E) A549 CTRL and TFRC KO were infected with 5 MOI of VSV-GFP. Total cell lysates (8 hpi) were separated by SDS-PAGE and analyzed by western blot for VSV-G and TfR1 levels. Equal loading was confirmed by probing for beta actin. A representative blot of two independent experiments is shown. (F) Quantification of the VSV-.G signal displayed in panel G. Statistical significance was determined by a paired t test. P values are indicated. (G) A549 CTRL and TFRC KO were infected with 0.01 MOI of VSV-GFP. Supernatant were collected after the indicated time points and analyzed by standard plaque assay on MDCK cells. Median titers in pfu/mL are indicated from four independent biological samples in two independent experiments. Statistical significance was determined with multiple t tests. P values are indicated. (H) 293T CTRL (black symbols) and 293T TFRC KO (gray symbols) were infected with Bla-M1 VLPs displaying the HA and NA of WSN or no envelope. Ammonium chloride was used to inhibit endosomal entry. Only cells with substrate conversion (BlaM1 positive) are depicted. Each symbol refers to one independent experiment (n = 3). Statistical significance was determined by a two way ANOVA. Adjusted P values are indicated.
Fig. 2.
Fig. 2.
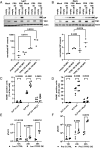
TfR1 expression increases susceptibility of CHO cell clones for IAV entry. CHO Lec1 and CHO Pro5 were transduced with empty pLVX IRES puro (empty) or pLVX TFRC IRES puro (TFRC). CHO Lec1 (A) and CHO Pro5 (B) infected with indicated MOI of PR8 for 5 h. Total cell lysates were separated by SDS-PAGE and analyzed by western blot for NP and TfR1 levels. Equal loading was confirmed by probing for beta actin. A representative blot of three independent experiments is shown. Quantifications of the NP signal are depicted below. Statistical significance was determined by one-way ANOVA. P values are indicated. CHO Lec1 (C) and CHO Pro5 (D) were infected with BlaM1-VLPs displaying the HA and NA of WSN or no envelope. Ammonium chloride was used as a blocker of endosomal entry. Only cells with substrate conversion (BlaM1 positive) are depicted. (n = 3). Statistical significance was determined by two way ANOVA. Adjusted P values are indicated. CHO Lec1 (E) and CHO Pro5 (F) were infected with PR8 and with MOI of 1 and 0.1 respectively for the indicated time points. Infectious viral particles were quantified by standard plaque assay on MDCK cells. Two independent experiments with biological duplicates were analyzed. Statistical significance was determined by multiple unpaired t test. P values are indicated.
Fig. 3.
Fig. 3.
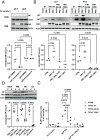
TfR1 recycling is required for IAV entry. (A) A549 cells were treated for 4 h with 50 µM of ferristatin II or an equivalent volume of DMSO. Cells were infected with 10 MOI or 20 MOI of PR8 on ice, and were pulsed with pH7 or pH5 medium, respectively. Total cell lysates were separated by SDS-PAGE and analyzed by western blot for NP levels. Equal loading was confirmed by probing for beta actin. A representative blot of three independent experiments is shown. Quantifications of the NP signal are depicted below. Statistical significance was determined by one-way ANOVA. P values are indicated. (B) CHO Lec1 (Upper) or CHO Pro5 (Lower) expressing TfR1 wt, TfR1Δ3-28, or TfR1 Y20C. Cells were infected with 5 MOI of PR8 for 4 h. Total cell lysates were separated by SDS-PAGE and analyzed by western blot for NP and TfR1 levels. Equal loading was confirmed by probing for beta actin. A representative blot of three independent experiments is shown. Quantifications of the NP signal are depicted below. Statistical significance was determined by one way ANOVA. P values are indicated. (C) CHO Pro5 expressing TfR1 wt, TfR1Δ3-28 or TfR1 Y20C were infected with BlaM1-VLPs displaying the HA and NA of WSN or no envelope. Ammonium chloride was used to inhibit endosomal entry. Only cells with substrate conversion (BlaM1 positive) are depicted (n = 3). Statistical significance was determined by two-way ANOVA. Adjusted P values are indicated. (D) Control and patient skin fibroblasts (homozygous for TFRC Y20H substitution) were infected with 5 MOI of the indicated viruses for 4 h. Total cell lysates were separated by SDS-PAGE and analyzed by western blot for NP and TfR1 levels. Equal loading was confirmed by probing for beta actin. A representative blot of two independent experiments is shown. Quantification of the NP signal is depicted on the right hand side. Statistical significance was determined by one way ANOVA. P values are indicated.
Fig. 4.
Fig. 4.
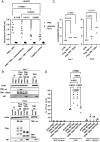
TfR1 supports IAV uptake in cis and trans. (A) Two-step ELLA assay. TfR1 coated wells and control wells were incubated with 5 × 10⁸ pfu of PR8. PNGase pretreated TfR1 was used to evaluate the involvement of sialic acids in IAV TfR1 interaction. Attached viruses were incubated with fetuin. Cleaved fetuin was transferred to a new well, incubated over night and probed with peroxidase conjugated lectin from Arachis hypogaea. Absorbance at 450 nm for three independent experiments with technical triplicates is shown. Statistical significance was determined by two-way ANOVA. Adjusted P values are indicated. (B) CHO Lec1 or (C) CHO Pro5 expressing Flag-TfR1wt or headless Flag-TfR1 120aa. Cells were infected with five MOI of PR8 for 4 h (n = 3). Total cell lysates were separated by SDS-PAGE and analyzed by western blot for NP and TfR1 levels. Equal loading was confirmed by probing for beta actin. Quantification of the NP signal for panel B and C is depicted below. Statistical significance was determined by one way ANOVA. P values are indicated. (D) CHO Pro5 expressing Flag-TfR1wt or headless Flag-TfR1 120aa or headless Flag-TfR1 120aa with a Y20C substitution. Cells were infected with BlaM1-VLPs displaying the HA and NA of WSN or no envelope. Ammonium chloride was used to inhibit endosomal entry. Only cells with substrate conversion (BlaM1 positive) are depicted (n = 3). Statistical significance was determined by multiple t test. P values are indicated.
Fig. 5.
Fig. 5.
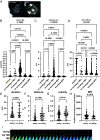
TfR1 colocalizes with entering IAV. CHO Pro5 TfR1 BFP or CHO Pro5 BFP were incubated with mNeonGreenM1 VLP and monitored for 30 min with a TIRF microscope. (A) Visualization of tracks recorded with HA/NA enveloped VLP or non enveloped VLP. Representative cells are shown. Detected VLP is indicated with a white circle. Tracks are color-coded for the starting time point (blue: beginning of Movie S1, red: end of it). (BD) Comparison of track duration in min (B), track distance in µm (C), and mean VLP velocity in µm/min (D) for control tracks (HA/NA enveloped VLPs outside of the cell surface area, n = 269), tracks of non enveloped VLP (lacking HA/NA, n = 15) on the cell surface of TfR1 expressing cells, tracks of HA/NA enveloped VLP on the cell surface of TfR1 expressing cells (n = 371), tracks of non enveloped VLP (lacking HA/NA, n = 254) on the cell surface of BFP expressing cells and tracks of HA/NA enveloped VLP on the cell surface of BFP expressing cells (n = 66). Each dot represents a single track. Control tracks and enveloped VLP tracks on cell surfaces were recorded from three cells in three independent experiments, tracks from nonenveloped viruses were recorded from three cells in one experiment. Median values are indicated by a line, P values were calculated with one way ANOVA. (EG) Tracks from enveloped VLPs on cells organized into entering VLPs (TIRF signal lost before frame 30, n = 199) and non entering VLPs (TIRF signal remains until frame 30, n = 113). Track duration (E), track distance (F) and VLP velocity (G) are indicated as for BD, with the respective median indicated by a line. P values were calculated by t test. (H) Median fluorescence intensity of TfR1-BFP along the tracks of VLPs that enter or do not enter until frame 30. Each dot represents a single data point of individual tracks. Only tracks of six or more frames were considered. (I) Example of an enveloped VLP entering the host cell. The VLP is tracked in TIRF and epifluorescence mode (Upper rows). TfR1-BFP was solely monitored in TIRF mode.

Comment in

Similar articles

Cited by

References

    1. Jolly C. L., Sattentau Q. J., Attachment factors. Adv. Exp. Med. Biol. 790, 1–23 (2013). - PubMed
    1. Yamauchi Y., Helenius A., Virus entry at a glance. J. Cell Sci. 126, 1289–1295 (2013). - PubMed
    1. Sempere Borau M., Stertz S., Entry of influenza A virus into host cells–Recent progress and remaining challenges. Curr. Opin. Virol. 48, 23–29 (2021). - PubMed
    1. Siegers J. Y., et al. , Viral factors important for efficient replication of influenza A viruses in cells of the central nervous system. J. Virol. 93, e02273-18 (2019). - PMC - PubMed
    1. Freymuth F., et al. , Replication of respiratory viruses, particularly influenza virus, rhinovirus, and coronavirus in HuH7 hepatocarcinoma cell line. J. Med. Virol. 77, 295–301 (2005). - PMC - PubMed

Publication types

MeSH terms

LinkOut - more resources