. 2023 May 23;120(21):e2209124120.
doi: 10.1073/pnas.2209124120. Epub 2023 May 16.

An empirical Bayes method for differential expression analysis of single cells with deep generative models

Affiliations

An empirical Bayes method for differential expression analysis of single cells with deep generative models

Pierre Boyeau et al. Proc Natl Acad Sci U S A. .

Abstract

Detecting differentially expressed genes is important for characterizing subpopulations of cells. In scRNA-seq data, however, nuisance variation due to technical factors like sequencing depth and RNA capture efficiency obscures the underlying biological signal. Deep generative models have been extensively applied to scRNA-seq data, with a special focus on embedding cells into a low-dimensional latent space and correcting for batch effects. However, little attention has been paid to the problem of utilizing the uncertainty from the deep generative model for differential expression (DE). Furthermore, the existing approaches do not allow for controlling for effect size or the false discovery rate (FDR). Here, we present lvm-DE, a generic Bayesian approach for performing DE predictions from a fitted deep generative model, while controlling the FDR. We apply the lvm-DE framework to scVI and scSphere, two deep generative models. The resulting approaches outperform state-of-the-art methods at estimating the log fold change in gene expression levels as well as detecting differentially expressed genes between subpopulations of cells.

Keywords: deep generative modeling; differential expression; scRNA-seq.


Conflict of interest statement

N.Y. is an advisor and/or has equity in Cellarity, Celsius Therapeutics, and Rheos Medicine.

Figures
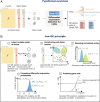
Fig. 1.
Fig. 1.
Differential expression model for deep generative models. (A) lvm-DE takes annotated data (from clustering, metadata, or transfer learning), a latent variable model, and a target FDR level as inputs and returns LFC estimates as well as calibrated DE predictions. (B) lvm-DE works as follows. 1) A preliminary step consists in fitting the latent variable model of choice of the data from the collection of available scRNA-seq data. 2) lvm-DE uses existing cell states annotations to approximate the distributions of c conditioned on the cell states. 3) These distributions help determine the normalized expression level distributions of the compared populations. 4) The associated LFC distribution helps to determine posterior DE probabilities that correspond to the model in which the LFC is higher than a given threshold. 5) To tag DE genes of interpretable interest, we estimate the maximum number of genes for which the posterior expected FDR is below the desired FDR level.
Fig. 2.
Fig. 2.
SymSim results. (A) Dataset presentation. Top: SymSim is a simulation framework modeling biological and technical effects to provide realistic simulations. Bottom: We consider a two-cell-type DE analysis scenario. We subsample population A to compare the different algorithms for rare cell-type detection. For this subpanel and all the experiments, we refit the models for each scenario such that all of the algorithms use the same number of observations from A and B for model fitting and DE. (B) LFC point estimation error when comparing two populations of A = B = 200 cells. For Bayesian techniques, we summarize the posterior LFC distribution by its median. For this figure and in the remainder of the article, boxplots represent medians (line), interquartile range (box), and distribution range (whiskers) estimates. (C) TPR (dots) and FDR (crosses) changes for an increasing number of external cells for the different latent variable models. (D) FDR and TPR of decisions for the detection of DE genes when comparing varying A ∈ {25, 50, 100, 150} cells to B = 500 cells (for C = 2, 000) (We refit each model for each configuration such that all algorithms use the same data). Squares, circles, and diamonds correspond to decisions controlling FDR at targets 0.05, 0.1, and 0.2, respectively. For scVI’s original DE procedure, we reject the null when Bayes factors are greater than three in absolute value.
Fig. 3.
Fig. 3.
PBMCs results. (A) UMAP from scVI’s embedding (B) Negative controls (among B cells), corresponding to LFC range study for the different methods. For this experiment, the lvm-DE outlier removal procedure was not employed. (C) Positive controls. Distribution of Pearson correlation between the reference LFC (bulk-RNA) and estimated LFC for pairwise comparisons of B cells, mDC, pDC, and monocytes. Each point in these graphs corresponds to one of the six possible cell-type comparisons. For lvm-DE, we use the custom LFC median estimator. Individual scatter plots can be found in the annex. (D) Distribution of Spearman correlations between the reference P values (bulk-RNA) and estimated significance scores for pairwise comparisons of B cells, mDC, pDC, and monocytes. GLMs and lvm-DE, respectively, used P values and posterior DE probabilities as significance scores. Stars represent significant differences with all the GLMs at various significant levels (*, **, and *** denote, respectively, significance levels < 0.05, 0.01, 0.005), under a two-sample F test for the negative control and a one-sided two-sample t-test for the positive control experiments.
Fig. 4.
Fig. 4.
Batch harmonization on PbmcBench. Pooled information from several batches improves the match of the prediction with bulk for scPhere and scVI-lvm. Left: Pearson correlation of the predicted and the reference LFCs (from bulk-RNA) for two cell-type pairs. Right: Spearman correlation of the predicted significance scores (posterior DE probabilities for scPhere and scVI-lvm, P values for other algorithms) and the reference P values (from bulk-RNA) for two cell-type pairs. In both graphs, points correspond to a given training on a subset of PbmcBench containing a varying number of batches (color). As GLMs struggled to scale to large sample sizes, these algorithms used a maximum of 500 cells per dataset.
Fig. 5.
Fig. 5.
SARS-CoV2 dataset results. (A) Dataset presentation. UMAP from scVI’s embeddings colored by cell type (Left) and batch (Right). Counts were obtained from six healthy donors (H1 to H6) and seven SARS-CoV-2-infected patients (C1 to C7). (B) Negative controls (among DC cells), corresponding to the study of the range of the LFC parameter (LFC) for the different methods. (C) Positive controls for inter-cell-type analysis. Left: Distribution of Pearson correlations between the reference and estimated LFC for pairwise comparisons of B cells, mDC, pDC, and monocytes. Right: Distribution of Spearman correlations between the reference P values and estimated significance scores for pairwise comparisons. Each point in these graphs corresponds to one of the six possible cell-type comparisons. (D) Positive controls for within-cell-type analysis. Distribution for different cell types of Pearson correlations between the reference and estimated LFC. The reference corresponds to cell-type-specific cytokine signature genes’ LFC independently computed on microarray, but that unfortunately did not contain significance assessments. The considered cell types are dendritic cells, NK, neutrophils, gd T, B, CD4T, and CD8T cells.

References

    1. Wagner A., Regev A., Yosef N., Revealing the vectors of cellular identity with single-cell genomics. Nat. Biotechnol. 34, 1145–1160 (2016). - PMC - PubMed
    1. Finak G., et al. , MAST: A flexible statistical framework for assessing transcriptional changes and characterizing heterogeneity in single-cell RNA sequencing data. Genome Biol. 16, 1–13 (2015). - PMC - PubMed
    1. Kharchenko P. V., Silberstein L., Scadden D. T., Bayesian approach to single-cell differential expression analysis. Nat. Methods 11, 740–742 (2014). - PMC - PubMed
    1. Satija R., Farrell J. A., Gennert D., Schier A. F., Regev A., Spatial reconstruction of single-cell gene expression data. Nat. Biotechnol. 33, 495–502 (2015). - PMC - PubMed
    1. Love M. I., Huber W., Anders S., Moderated estimation of fold change and dispersion for RNA-seq data with DESeq2. Genome Biol. 15, 1–21 (2014). - PMC - PubMed

Publication types

LinkOut - more resources