. 2023 Aug 10;142(6):574-588.
doi: 10.1182/blood.2022018196.

Metabolic adaptation to tyrosine kinase inhibition in leukemia stem cells

Affiliations

Metabolic adaptation to tyrosine kinase inhibition in leukemia stem cells

Shaowei Qiu et al. Blood. .

Abstract

Tyrosine kinase inhibitors (TKIs) are very effective in treating chronic myelogenous leukemia (CML), but primitive, quiescent leukemia stem cells persist as a barrier to the cure. We performed a comprehensive evaluation of metabolic adaptation to TKI treatment and its role in CML hematopoietic stem and progenitor cell persistence. Using a CML mouse model, we found that glycolysis, glutaminolysis, the tricarboxylic acid cycle, and oxidative phosphorylation (OXPHOS) were initially inhibited by TKI treatment in CML-committed progenitors but were restored with continued treatment, reflecting both selection and metabolic reprogramming of specific subpopulations. TKI treatment selectively enriched primitive CML stem cells with reduced metabolic gene expression. Persistent CML stem cells also showed metabolic adaptation to TKI treatment through altered substrate use and mitochondrial respiration maintenance. Evaluation of transcription factors underlying these changes helped detect increased HIF-1 protein levels and activity in TKI-treated stem cells. Treatment with an HIF-1 inhibitor in combination with TKI treatment depleted murine and human CML stem cells. HIF-1 inhibition increased mitochondrial activity and reactive oxygen species (ROS) levels, reduced quiescence, increased cycling, and reduced the self-renewal and regenerating potential of dormant CML stem cells. We, therefore, identified the HIF-1-mediated inhibition of OXPHOS and ROS and maintenance of CML stem cell dormancy and repopulating potential as a key mechanism of CML stem cell adaptation to TKI treatment. Our results identify a key metabolic dependency in CML stem cells persisting after TKI treatment that can be targeted to enhance their elimination.


Conflict of interest statement

Conflict-of-interest disclosure: The authors declare no competing financial interests.

Figures

None
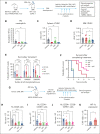
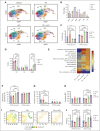
Graphical abstract
Figure 1.
Figure 1.
TKI treatment leads to dynamic alterations in glycolysis and OXPHOS in CML progenitors. (A) Overall experimental strategy. BM cells (2 × 106) from BCR-ABL transgenic mice (CD45.1/2) in which leukemia had been induced by tetracycline withdrawal were transplanted into CD45.1 recipient mice. Once mice had developed leukemia 6 or 8 weeks after transplantation, they were treated with nilotinib (TKI) or vehicle for 2 days or 2 weeks. BM c-Kit+ cells and LSK cells were selected and studied as shown. (B-C) Extracellular flux analysis of OCR (B) and ECAR (C) in CML BM c-Kit+ cells after 2 days of nilotinib treatment (n = 4 mice each). (D-E) Extracellular flux analysis of OCR (D) and ECAR (E) in CML BM c-kit+ cells after 2 weeks of nilotinib treatment (n = 5-6 mice each). Significance values: ∗P < .05; ∗∗P < .01; ∗∗∗P < .001. Results represent the mean ± standard error of mean (SEM) of multiple replicates.
Figure 2.
Figure 2.
TKI treatment leads to dynamic alterations in energy metabolism in CML progenitors. Mice with CML were treated with nilotinib or vehicle for 2 days or 2 weeks, and BM c-Kit+ cells were selected and metabolomic profiling was performed. (A) The relative abundance of glycolytic intermediates after 2 days of nilotinib treatment is shown (n = 3-4). (B) The relative abundance of TCA cycle intermediates after 2 days of nilotinib treatment is shown (n = 3-4). (C) The ratio of ATP/ADP and GTP/GDP after 2 days of nilotinib treatment is shown (n = 3-4). (D) The relative abundance of glycolytic intermediates after 2 weeks of nilotinib treatment is shown (n =3). (E) The relative abundance of TCA cycle intermediates after 2 weeks of nilotinib treatment is shown (n = 3). (F) The ratio of ATP/ADP and GTP/GDP after 2 weeks of nilotinib treatment is shown (n = 3). (G) BM c-Kit+ cells were labeled with [U-13C6]glucose in vitro (n = 3). The percent labeling fraction of glycolytic end products (pyruvate, lactate, and alanine) and citric acid cycle intermediates (citrate/isocitrate, α-ketoglutarate, and malate) after 2 days and after 2 weeks of vehicle (Veh) or nilotinib (NIL) treatment is shown. The labeling fractions are corrected for 13C natural abundance. Significance values: ∗P < .05; ∗∗P < .01; ∗∗∗P < .001. Results represent mean ± SEM of multiple replicates. 3PG/2PG, 3-phosphoglyceric acid/2-phosphoglyceric acid; ADP, adenosine diphosphate; a-KG, α-ketoglutarate; F-1,6-BP, fructose 1,6-bisphosphate; G6P/F6P, glucose 6-phosphate/fructose 6-phosphate; GDP, guanosine diphosphate; GSH, glutathione; GTP, guanosine triphosphate; ns, not significant; PEP, phosphoenolpyruvic acid.
Figure 3.
Figure 3.
TKI treatment leads to metabolic reprogramming and selection of CML progenitor subpopulations. (A) Overview of the SCENITH assay performed using the BM of CML mice treated with vehicle or nilotinib (TKI) for 2 days and 2 weeks. The SCENITH assay uses flow cytometry to measure changes in the level of translation in response to inhibitors as a measurement for cellular metabolism. BM cells were divided and separately treated with 2-deoxyglucose (DG), oligomycin (O), and DG + O, together with controls (Cos) incubated without inhibitors, and labeled with puromycin (Puro). After cell surface labeling and intracellular labeling for Puro, different subpopulations were analyzed via flow cytometry for Puro-MFI response to the various inhibitors. Calculations of metabolic dependencies and capacities based on Puro-MFI are shown. (B-C) GMP, common myeloid progenitor (CMP), MEP, and LSK cell frequency within CML c-Kit+ cells (n = 5-6), as assessed via flow cytometry, after treatment with TKI for 2 days (B) or 2 weeks (C). (D-E) Protein synthesis (Puro-MFI) within committed progenitors (GMPs, CMPs, and MEPs) after 2 days (D) and 14 days (E) of TKI treatment. (F-I) Mitochondrial dependence and glycolytic capacity within GMPs, CMPs, and MEPs after 2 days (F,H) and 14 days (G,I) of TKI treatment. Significance values: ∗P < .05; ∗∗P < .01; ∗∗∗P < .001; and ∗∗∗∗P < .0001. Results represent mean ± SEM of multiple replicates. AAO, amino acid oxidation; MFI, mean fluorescence intensity.
Figure 4.
Figure 4.
Enrichment of primitive CML stem cell subpopulations after TKI treatment. LSK cells were isolated from the BM of CML mice treated with vehicle or nilotinib (Nil) for 2 days or 2 weeks, and scRNA sequencing was performed using the 10x Genomics platform. Cluster identification was based on gene profiles. Clusters are color coded. (A) Uniform manifold approximation and projection (uMAP) display of scRNA sequencing from CML LSK cells treated with vehicle (n = 42 238 single cells, 4 samples), nilotinib for 2 days (n = 15 911 single cells; 2 samples), or nilotinib for 2 weeks (n = 11 449 single cells; 2 samples). (B) The percent of indicated clusters within CML LSK after treatment with vehicle, NIL for 2 days, or NIL for 2 weeks. (C) Gene set enrichment analysis subpopulations of gene sets (FDR < 0.05) comparing TKI-persistent with TKI-depleted clusters. Net enrichment score (NES), and statistical significance (FDR) are represented by color and size, respectively. (D-G) The SCENITH assay was performed on BM cells from CML mice treated with vehicle or NIL (TKI) for 2 days and 14 days (n = 5-6). (D) LTHSC, short-term HSC (STHSC), MPP-GM, and MPP-MKE frequency within CML LSK cells, assessed via flow cytometry, after treatment with TKI for 2 days (left) and 14 days (right). (E) Protein synthesis (Puro-MFI) within LSK subpopulations after 2 days (top) and 14 days (bottom) of TKI treatment. (F-G) Glucose dependence (F) and FAO/AAO capacity (G) within LSK subpopulations after 2 days (top) and 14 days (bottom) of TKI treatment. Significance values: ∗P < .05; ∗∗P < .01; ∗∗∗P < .001; and ∗∗∗∗P < .0001. Results represent mean ± SEM of multiple replicates. FDR, false discovery rate; MK, megakaryocytic progenitors; TNF, tumor necrosis factor.
Figure 5.
Figure 5.
Alterations in metabolic gene signatures in primitive quiescent leukemia stem cells in response to TKI treatment. (A-B) Dot plots showing enrichment of metabolism-related gene sets (A) and hallmark gene sets (B) in the qHSC cluster, comparing cells treated with nilotinib for 2 days (Nil 2d) with vehicle (Veh) (left), with nilotinib for 2 weeks (Nil 2w) vs vehicle (middle), or with nilotinib for 2 weeks vs 2 days (right). NES and statistical significance (FDR) are represented by color and size, respectively. (C) Dot plot showing expression of genes within metabolic pathways in CML qHSC, treated with Veh, Nil 2d, and Nil 2w. The statistical significance (FDR) and fraction of cells expressing the gene are represented by color and size, respectively. (D) uMAP showing the expression of Hk1, Hk2, Pdk1, and Slc2a3 in CML LSK cells treated with vehicle, Nil 2d, or Nil 2w. (E) Enrichment of the HIF-1 regulon in CML qHSC treated with Nil 2d or Nil 2w compared with Veh, based on pySCENIC analysis. (F) The percentage of HIF-1α–expressing normal LTHSCs, CML LTHSCs treated with vehicle, and CML LTHSCs treated with Nil (TKI) for 2 weeks in normoxic or hypoxic conditions (n = 3-4). Significance values: ∗P < .05. Results represent mean ± SEM of multiple replicates.
Figure 6.
Figure 6.
HIF-1 inhibition depletes CML stem cells in combination with TKI treatment. (A) Experimental strategy. BM cells (2 × 106) from BCR-ABL transgenic mice (CD45.1/2) in which leukemia had been induced via tetracycline withdrawal were transplanted into CD45.1 recipient mice. Once mice had developed leukemia 6 or 8 weeks after transplantation, they were treated with vehicle, nilotinib (TKI, 50 mg/kg per day by oral gavage), HIFi (echinomycin 10 mg/kg, intraperitoneal for 5 consecutive days, with 2 days off times, 2 cycles), or the combination for 14 days. Mice were euthanized, and PB, the BM, and the spleen were harvested for analysis (n = 6-10). (B) Total neutrophils (based on differential count) in the PB are shown. (C) Total number of LTHSCs in the spleen are shown. (D) Total number of LTHSCs per 2 femurs and 2 tibiae (4 bones) are shown. (E) BM cells from CML mice treated with vehicle, nilotinib, HIFi, or combination for 2 weeks were transplanted in limiting-dilution transplantation (500 000 cells per mouse, n = 8; 1 000 000 cells per mouse, n = 6; and 2 000 000 cells per mouse, n = 6 each) into CD45.1 recipient mice together with competing normal CD45.2 cells (100 000 cells per mouse). Donor cell engraftment in the PB was evaluated after 16 weeks. (F) Kaplan-Meier plots of CML mice treated with vehicle, TKI, HIFi, or combination for 2 weeks and then followed-up for survival (n = 10 each). Log-rank test indicated significantly increased survival for combination- vs TKI-treated mice (P = .012). (G) Irradiated NRGS mice (400 cGy) received transplantation with human CML CD34+ BM cells (0.5×10⁶ cells per mouse). After successful human cell engraftment was confirmed after 6 to 8 weeks, mice were treated with vehicle, nilotinib, HIFi, or combination for 14 days. Mice were euthanized and the BM was harvested for analysis (n = 6-8). (H-K) The absolute number of human CD45+ cells (H), human CD34+CD38+ cells (I), and human CD34+CD38CD90+ cells (J) are shown. (K) The percent of human CD34+CD38CD90+ cells expressing HIF-1α after vehicle and nilotinib treatment for 2 weeks are shown. Results represent mean ± SEM of multiple replicates. Significance values: ∗P < .05; ∗∗P < .01; ∗∗∗P < .001; and ∗∗∗∗ P < .0001. Hu, human; WT, wild-type.
Figure 7.
Figure 7.
HIF-1 inhibition enhances mitochondrial activity, ROS, and cell cycling in TKI-treated CML stem cells. scRNA sequencing analysis was performed on LSK cells from CML mice treated with vehicle, nilotinib (TKI), echinomycin (HIFi), or the combination (TKI + HIFi). (A) uMAP display of CML LSK cells treated with vehicle (n = 12 368 single cells; 4 samples), TKI (n = 19 866 single cells; 2 samples), HIFi (n = 18 686 single cells; 4 samples), or the combination (n = 19 836 single cells; 4 samples). (B) The percentage of cells within individual clusters after treatment, as indicated. (C) Flow cytometry analysis of dormant LTHSCs (CD34) and cycling LTHSCs (CD34+) after treatment, as indicated. (D) Cell cycle analysis of LTHSCs from CML mice treated with vehicle, TKI, HIFi, or the combination (n = 6 each) using Ki67-DAPI labeling. (E) NES of hallmark gene sets (FDR < 0.05) comparing combination-, TKI-, and vehicle-treated qHSCs. (F-H) Results of SCENITH analysis showing changes in protein synthesis (metabolic activity) (F), mitochondrial dependence (G), and glycolytic capacity (H) in cycling and dormant LTHSCs from mice receiving the indicated treatments (n = 5-6). (I) t-distributed stochastic neighbor embedding plot showing TMRM fluorescence in dormant LTHSCs from mice receiving the indicated treatments (n = 6, concatenated). (J) Mitochondrial ROS levels measured using Mitosox in dormant and cycling LTHSCs from mice receiving the indicated treatments (n = 6 each). Results represent mean ± SEM of multiple replicates. Significance values: ∗P < .05; ∗∗P < .01; ∗∗∗P < .001; ∗∗∗∗P < .0001.

Comment in

  • Food for thought (and CML survival).
    Sezaki M, Huang G. Sezaki M, et al. Blood. 2023 Aug 10;142(6):502-504. doi: 10.1182/blood.2023021051. Blood. 2023. PMID: 37561542 No abstract available.

References

    1. Chu S, McDonald T, Lin A, et al. Persistence of leukemia stem cells in chronic myelogenous leukemia patients in prolonged remission with imatinib treatment. Blood. 2011;118(20):5565–5572. - PMC - PubMed
    1. Agarwal P, Isringhausen S, Li H, et al. Mesenchymal niche-specific expression of Cxcl12 controls quiescence of treatment-resistant leukemia stem cells. Cell Stem Cell. 2019;24(5):769–784.e6. - PMC - PubMed
    1. Zhang B, Ho YW, Huang Q, et al. Altered microenvironmental regulation of leukemic and normal stem cells in chronic myelogenous leukemia. Cancer Cell. 2012;21(4):577–592. - PMC - PubMed
    1. Zhang B, Li M, McDonald T, et al. Microenvironmental protection of CML stem and progenitor cells from tyrosine kinase inhibitors through N-cadherin and Wnt-beta-catenin signaling. Blood. 2013;121(10):1824–1838. - PMC - PubMed
    1. Agarwal P, Zhang B, Ho Y, et al. Enhanced targeting of CML stem and progenitor cells by inhibition of porcupine acyltransferase in combination with TKI. Blood. 2017;129(8):1008–1020. - PMC - PubMed

Publication types

MeSH terms

Substances