. 2023 May 25;186(11):2361-2379.e25.
doi: 10.1016/j.cell.2023.04.026. Epub 2023 May 15.

Systematic identification of anticancer drug targets reveals a nucleus-to-mitochondria ROS-sensing pathway

Affiliations

Systematic identification of anticancer drug targets reveals a nucleus-to-mitochondria ROS-sensing pathway

Junbing Zhang et al. Cell. .

Abstract

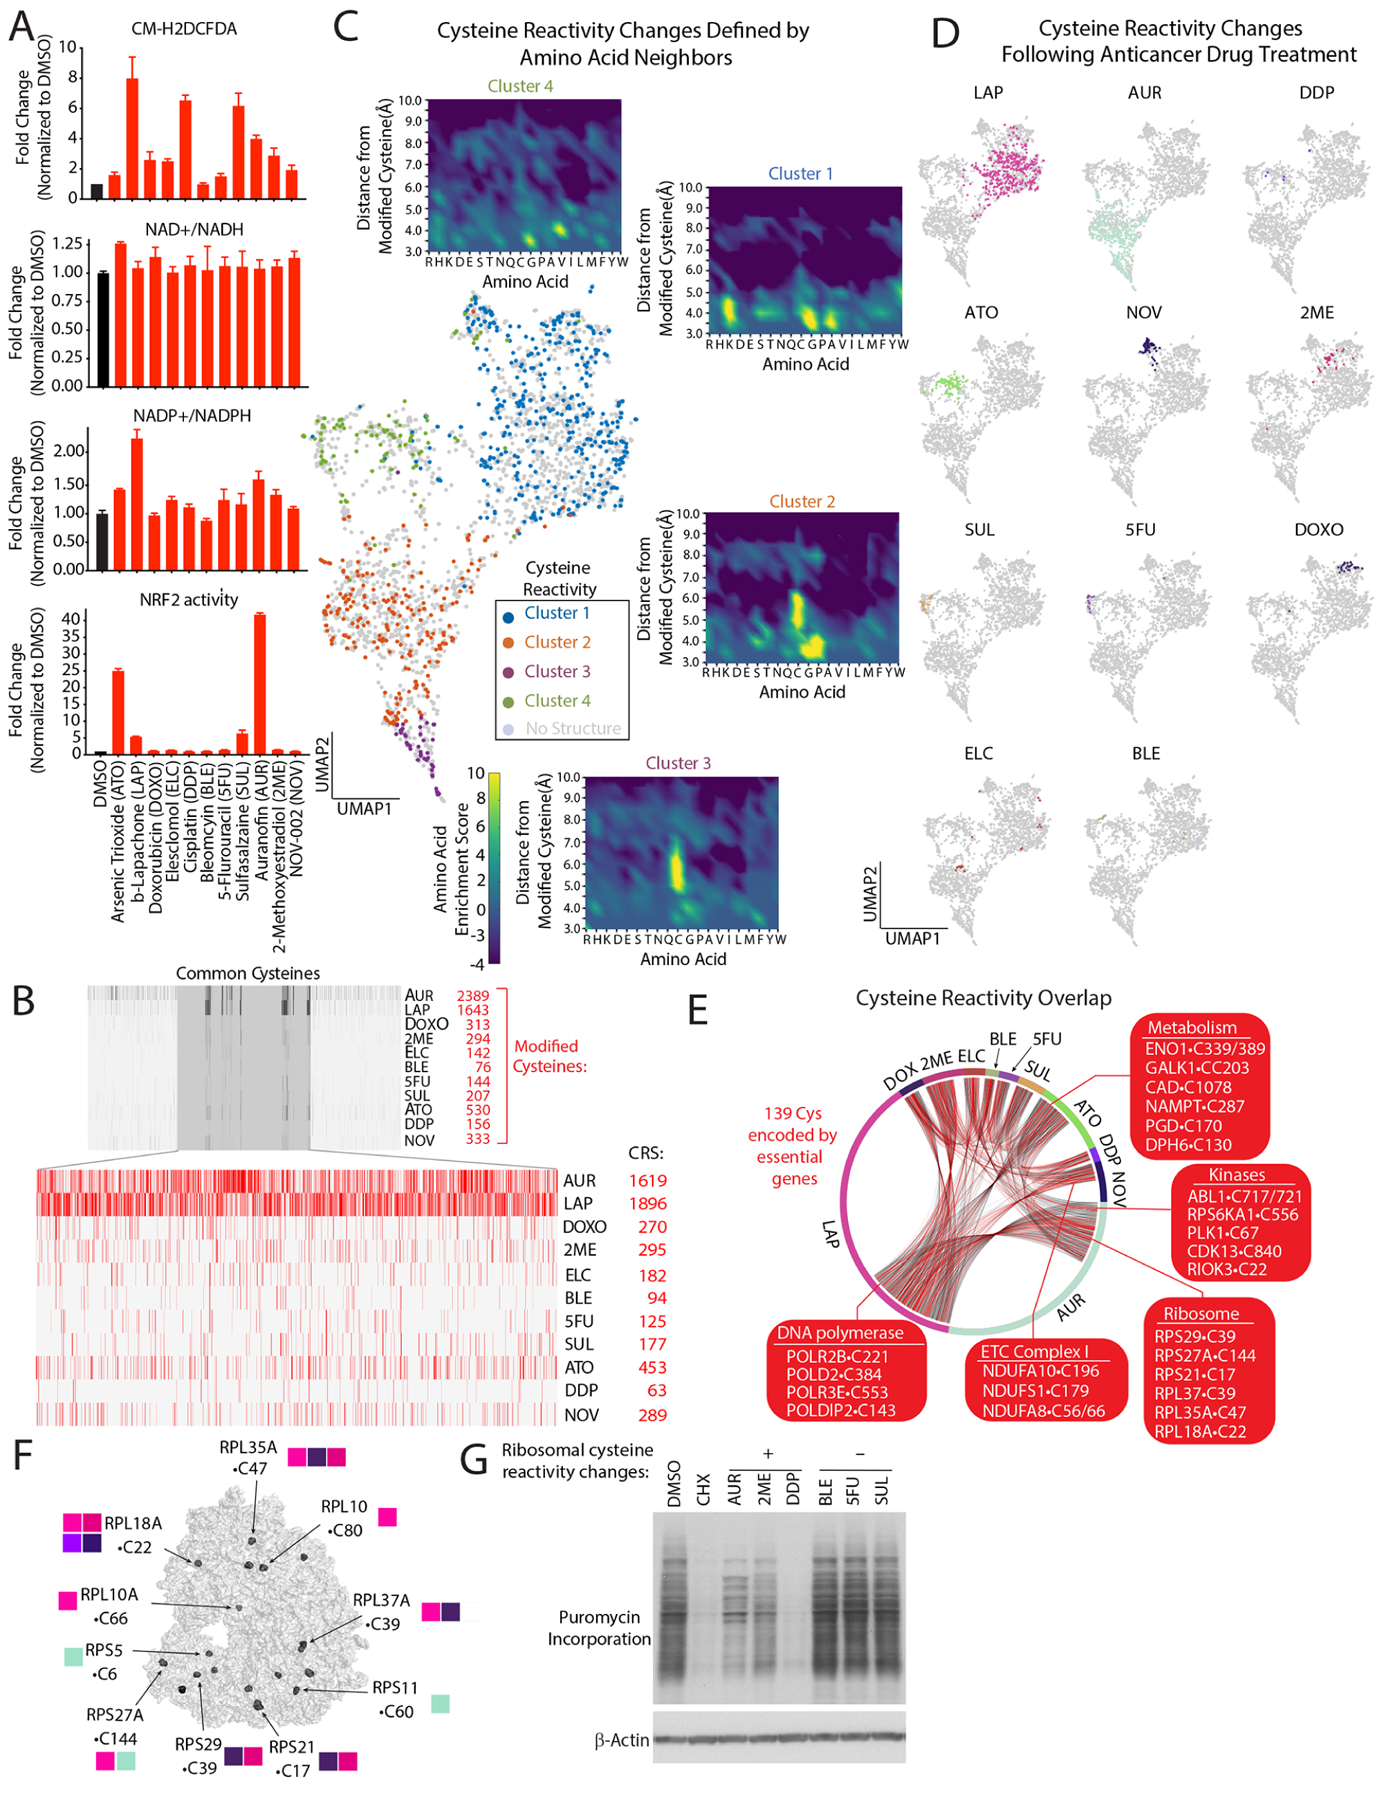
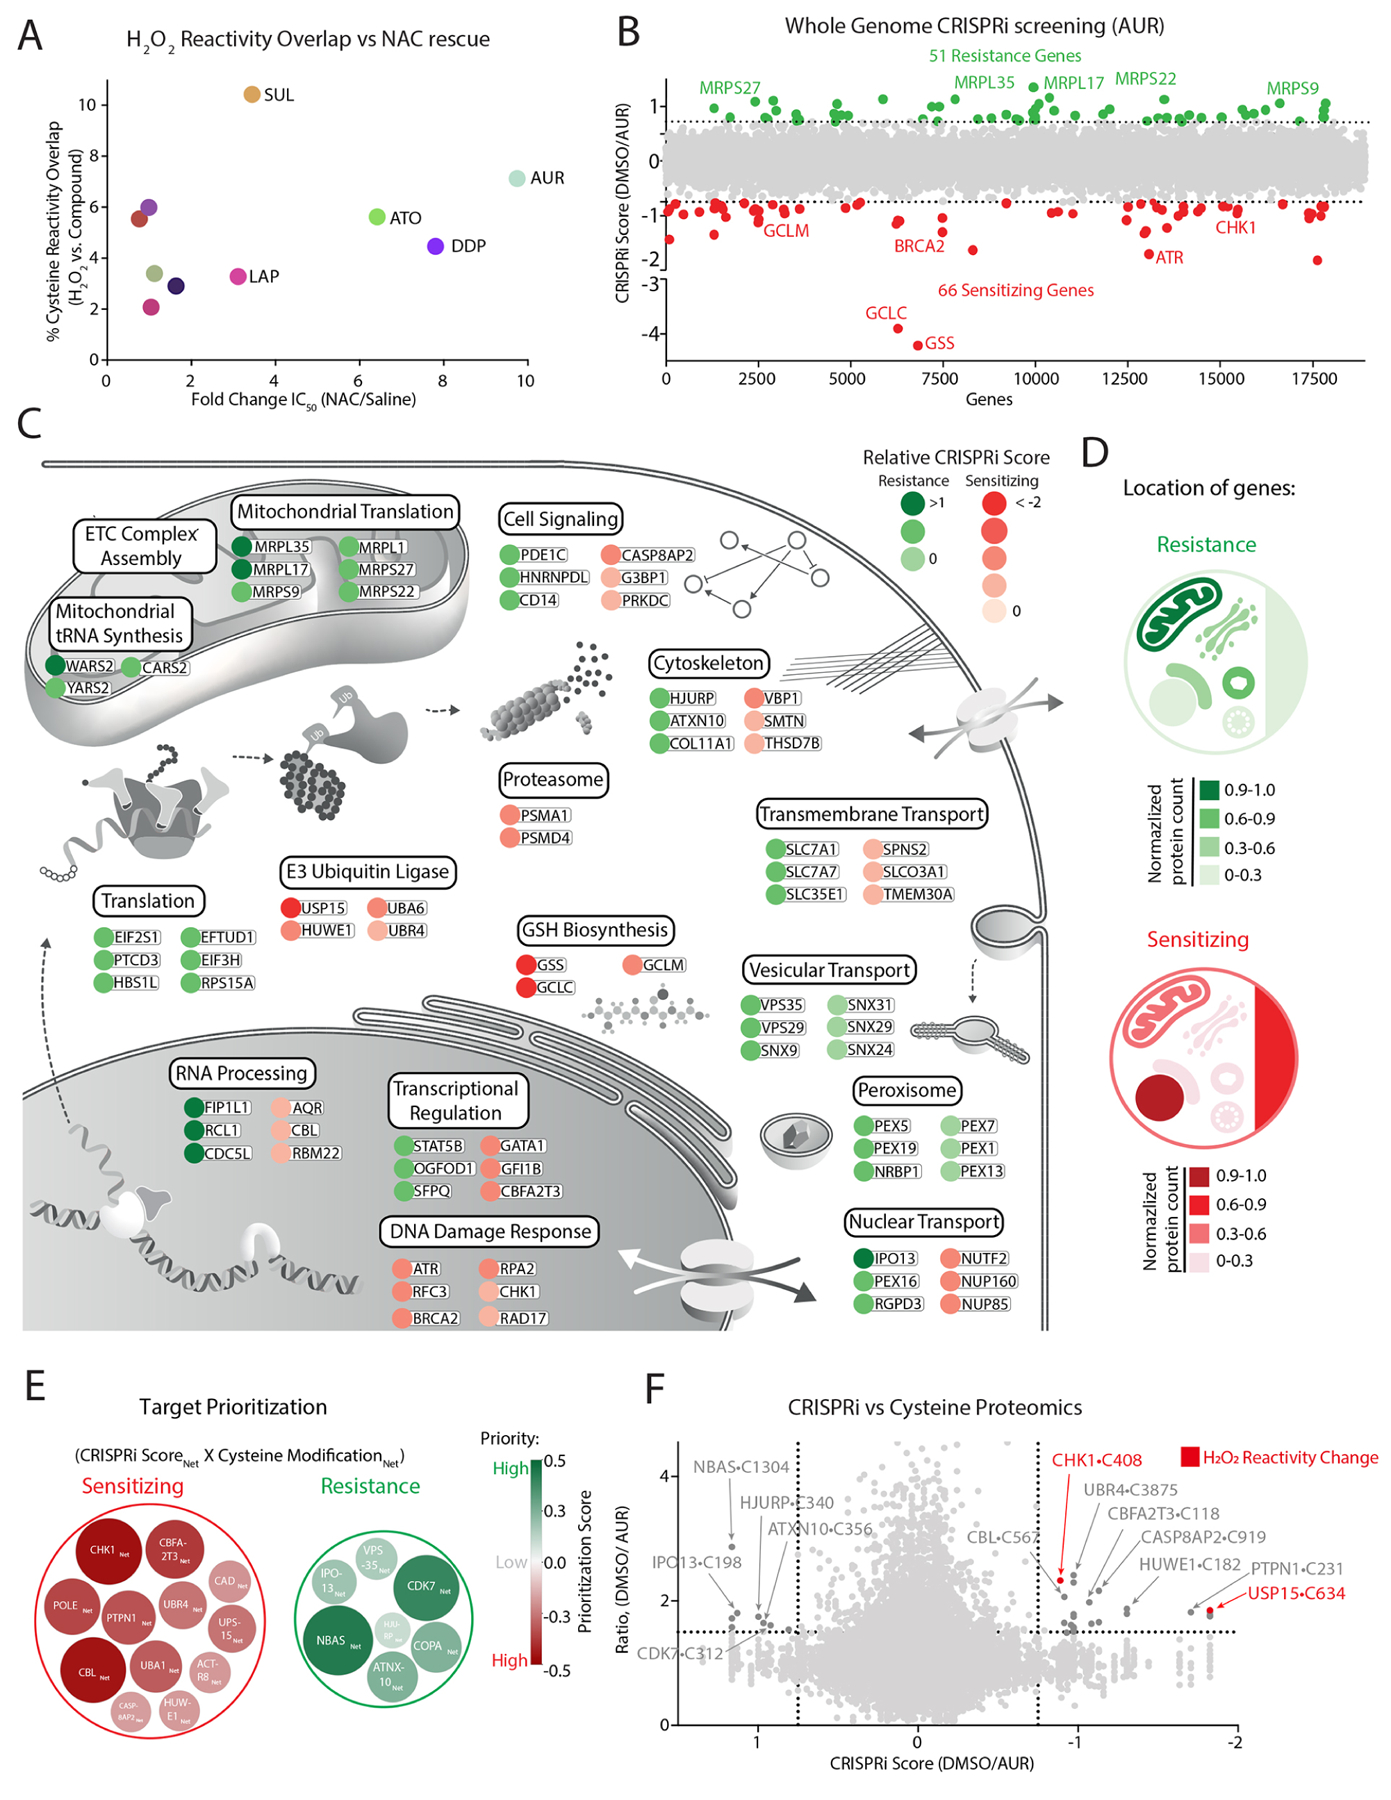
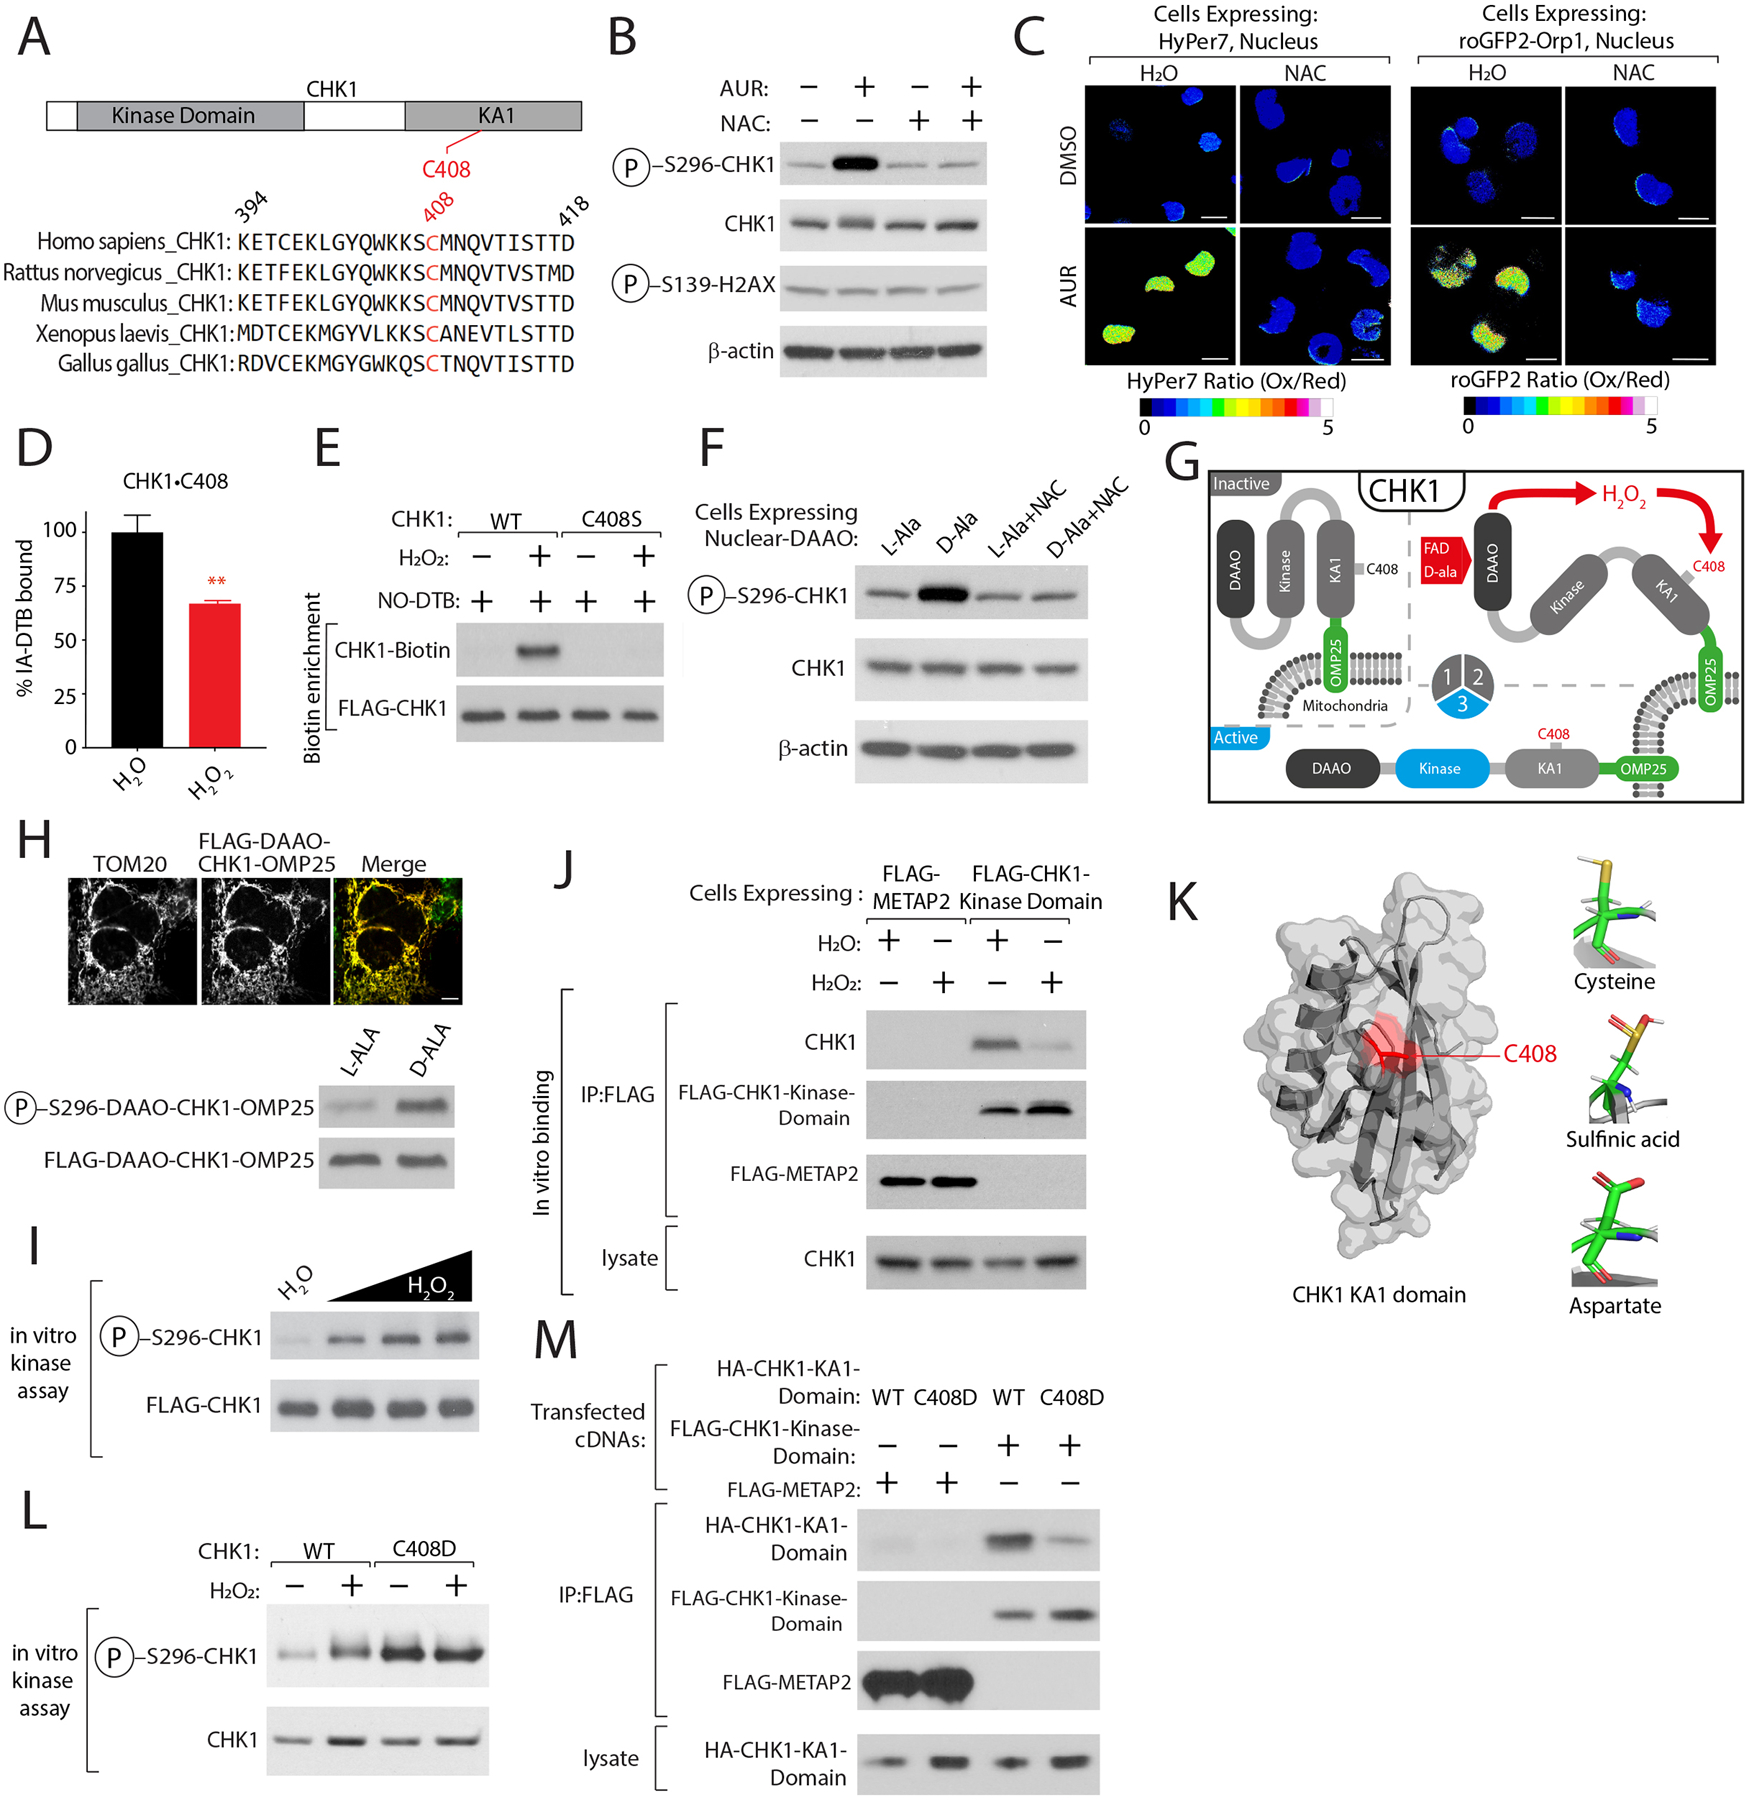
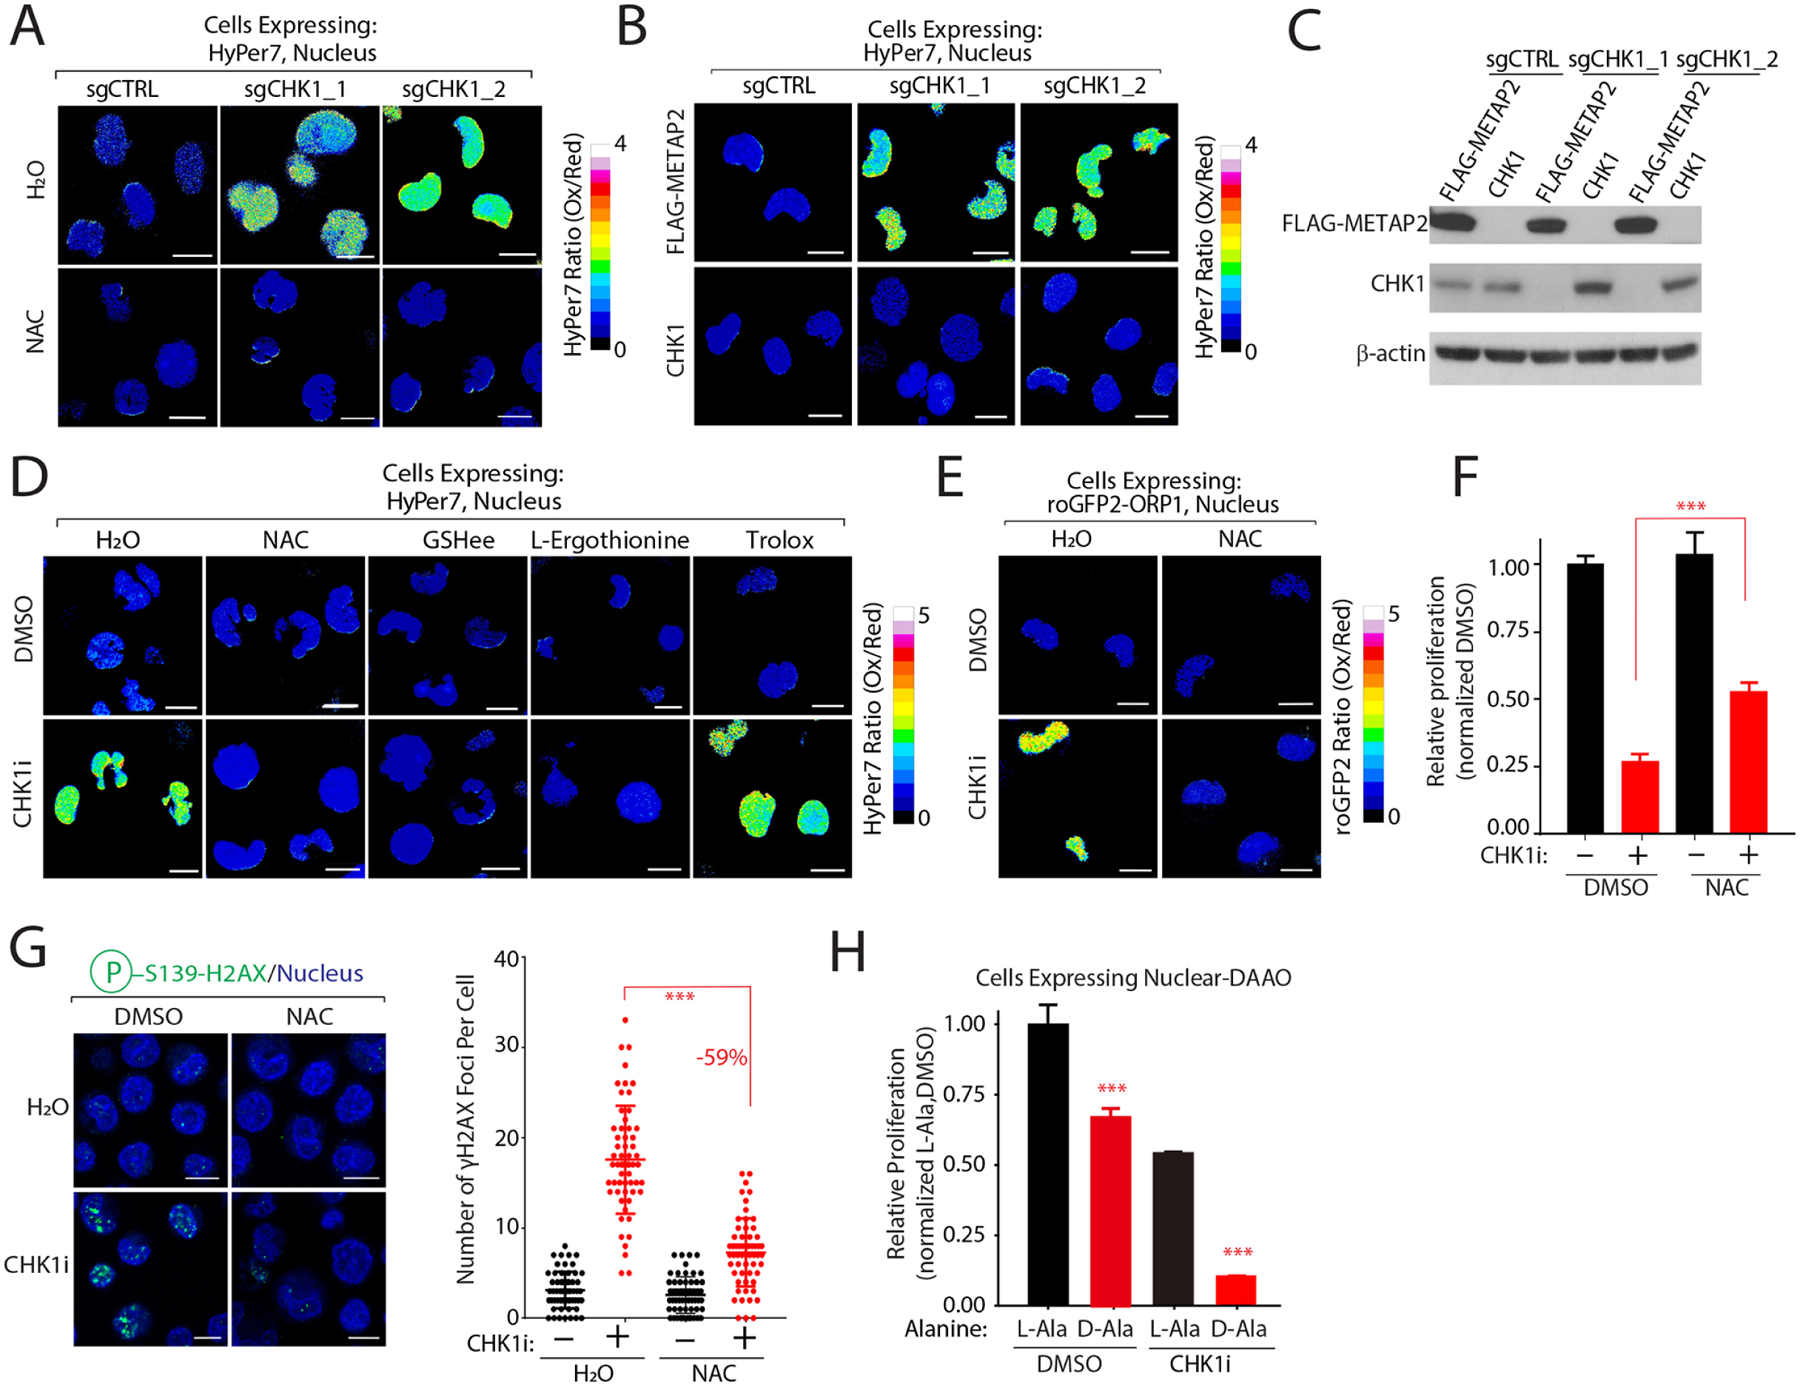
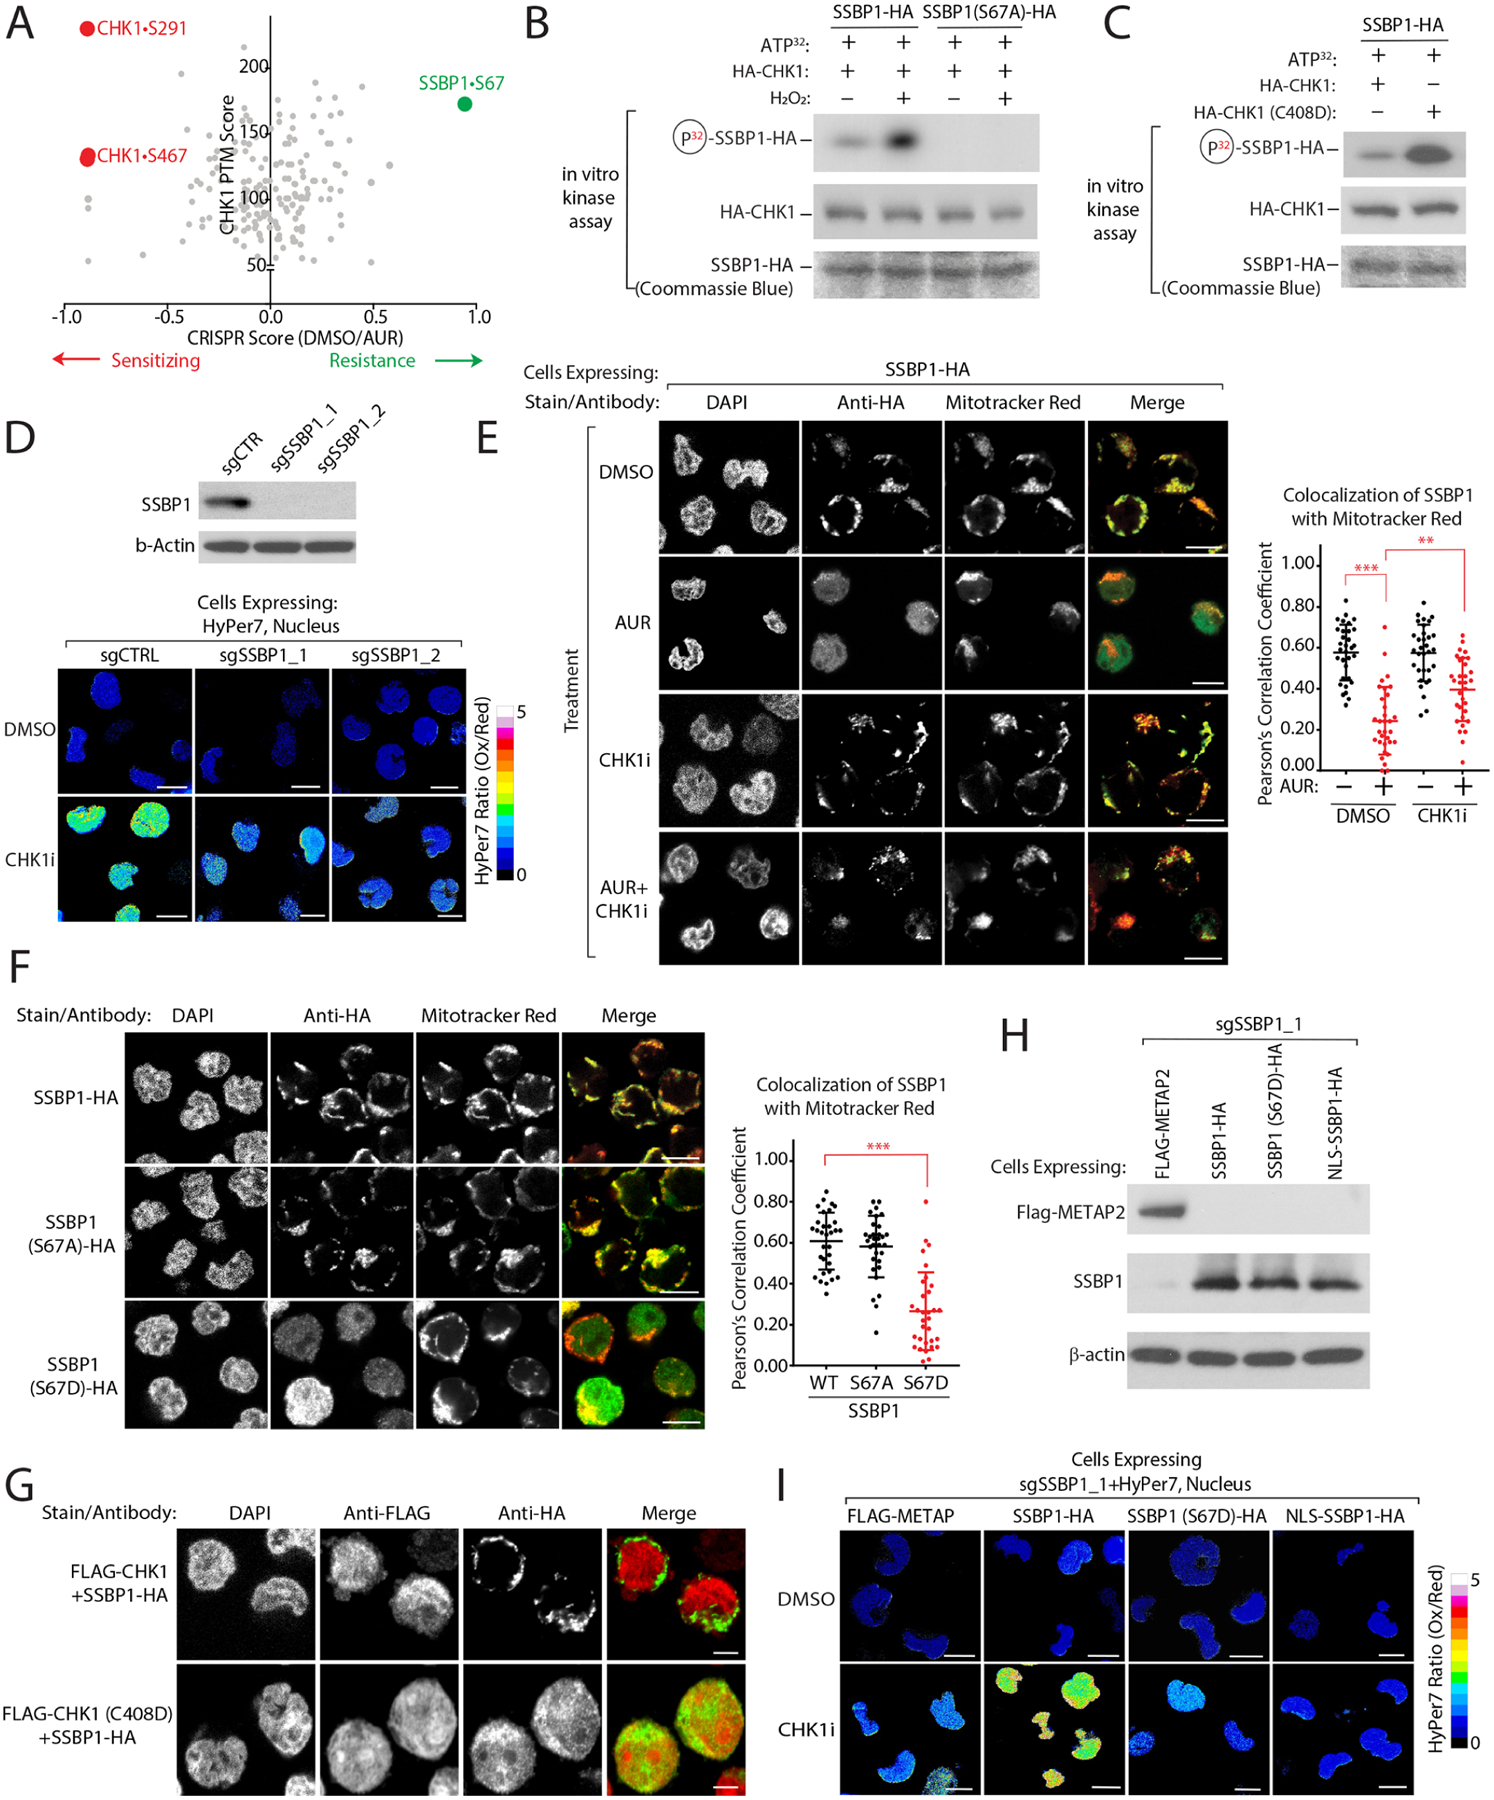
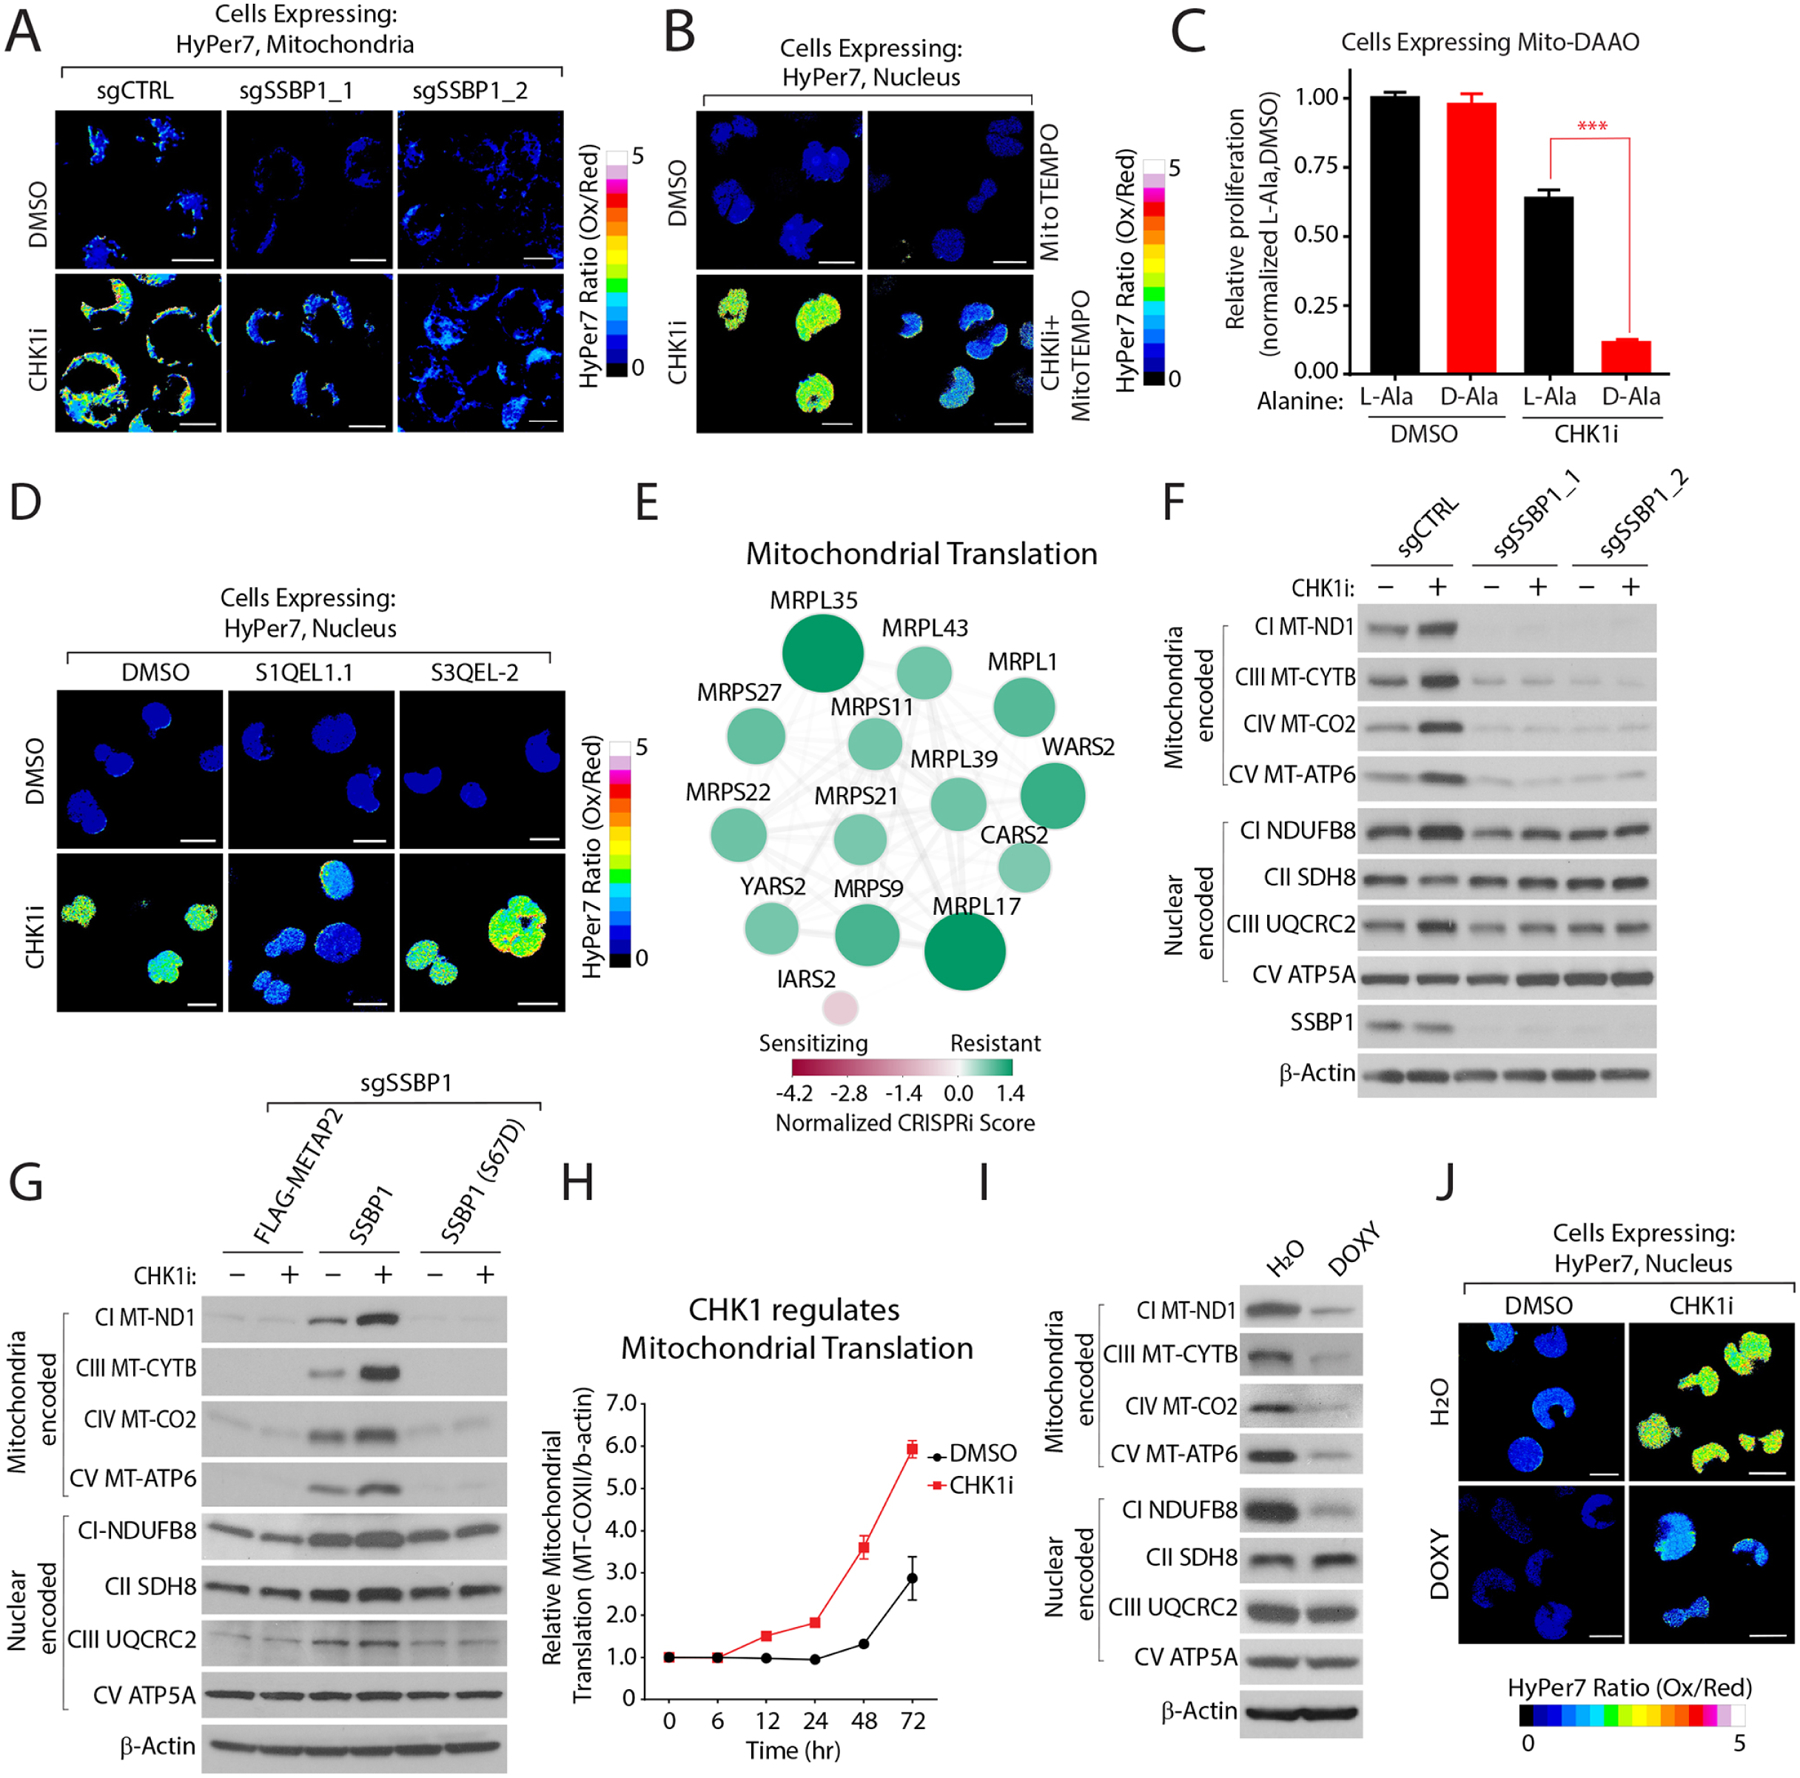
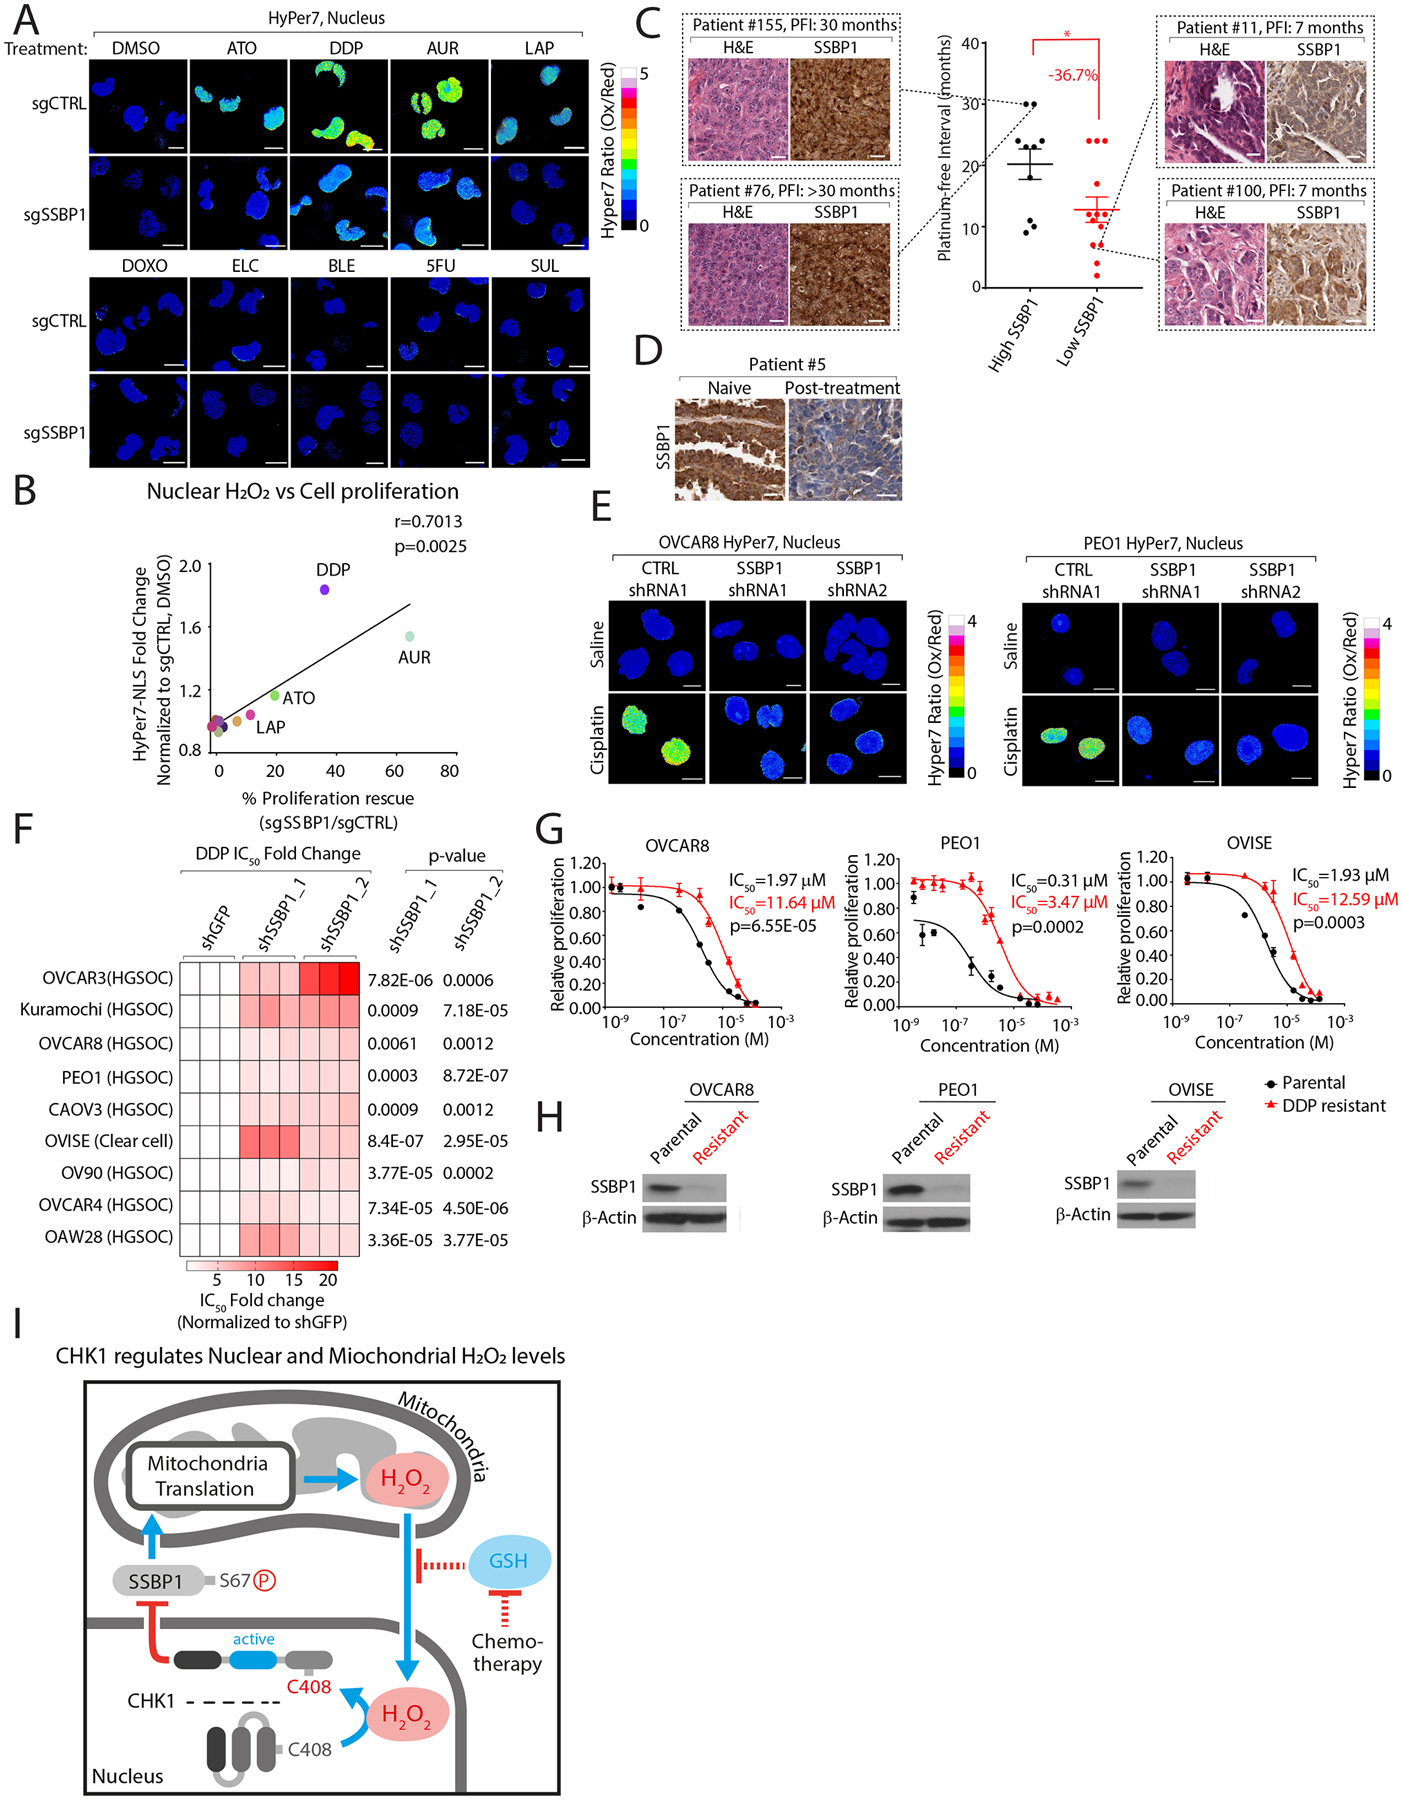
Multiple anticancer drugs have been proposed to cause cell death, in part, by increasing the steady-state levels of cellular reactive oxygen species (ROS). However, for most of these drugs, exactly how the resultant ROS function and are sensed is poorly understood. It remains unclear which proteins the ROS modify and their roles in drug sensitivity/resistance. To answer these questions, we examined 11 anticancer drugs with an integrated proteogenomic approach identifying not only many unique targets but also shared ones-including ribosomal components, suggesting common mechanisms by which drugs regulate translation. We focus on CHK1 that we find is a nuclear H2O2 sensor that launches a cellular program to dampen ROS. CHK1 phosphorylates the mitochondrial DNA-binding protein SSBP1 to prevent its mitochondrial localization, which in turn decreases nuclear H2O2. Our results reveal a druggable nucleus-to-mitochondria ROS-sensing pathway-required to resolve nuclear H2O2 accumulation and mediate resistance to platinum-based agents in ovarian cancers.

Keywords: CHK1; chemical proteomics; chemoresistance; mitochondrial translation; nuclear ROS; nucleus-to-mitochondria signaling.


Conflict of interest statement

Declaration of interests A.P.P., C.M.S., M.P.S., and S.A.B. are employees of Cell Signaling Technology, Inc. L.B.-P. is a founder, consultant, and holds privately held equity in Scorpion Therapeutics.

Figures

Figure 1:
Figure 1:. Defining cysteine targets of anticancer drugs with chemical proteomics.
(A) Anticancer drugs regulate steady-state levels of ROS and antioxidant response pathways (see also Figure S1B). (B) Barcode plot of modified cysteines following treatment with the indicated agents and corresponding cysteine reactivity score (CRS) (see also methods, Table S2A). (C) UMAP representation of commonly detected cysteines regulated by anticancer drugs reveals they are localized to four distinct clusters which are color-coded based on available structures. Insets, enrichments plots of residues within a 10Å radial-sphere of reactive cysteines (see methods, Tables S2C). (D) UMAP of cysteine reactivity changes following treatment with indicated agents. (E) Connectivity diagram for shared cysteine targets of anticancer agents. (F) Ribosomal cysteines regulated by anticancer drugs. Adapted from PDB ID: 5LKS. (G) Anticancer treatments blocks protein synthesis. Immunoblot analysis of puromycin incorporation into nascent proteins following treatment with the indicated compounds. Data are represented as mean ± SEM.
Figure 2:
Figure 2:. Functional genomic characterization of AUR-sensitizing and resistance pathways.
(A) Comparison of each agent’s overlap with H2O2 cysteine reactivity and fold-change in IC50 following NAC treatment (see also Figure S1C, Table S2A–B). (B) Genome-wide CRISPRi screen in K562 cells identifies genes that mediate sensitivity and resistance to AUR (see also Table S4). (C-D) Summary of top-scoring genes and corresponding pathways (C) and their cellular location (D) that promote resistance or sensitivity to AUR treatment. (E-F) Prioritization scheme for selecting targets (E) based on comparing their CRISPRi score and cysteine reactivity following AUR and H2O2 treatments (F) (see also methods, Tables S2–5).
Figure 3:
Figure 3:. CHK1 functions as a sensor of nuclear H2O2 levels.
(A) C408 is highly conserved. (B) AUR activates CHK1 in a NAC-dependent manner. K562 cells were treated with AUR in the presence of NAC or vehicle control CHK1 activity was determined by immunoblotting for the indicated proteins. (C) AUR increases the steady-state levels of nuclear H2O2. Ratiometric images of HyPer7 or roGFP2-ORP1 H2O2 reporters localized to the nucleus following indicated treatments (see also Figures S5A–C). (D) H2O2 treatment regulates CHK1•C408 oxidation (see also Table S2B). (E) Oxidation of CHK1•C408 results in sulfinic acid formation (see methods). (F) Nuclear H2O2 activates CHK1. K562 cells stably expressing D-amino acid oxidase (DAAO) localized to the nucleus were treated with either L-Ala or D-Ala or NAC and CHK1 kinase activity was determined as described in (B). (G) Schematic depicting the localization of DAAO-CHK1 to the mitochondrial outer membrane. (H) H2O2 is sufficient to activate CHK1. Top, Immunofluorescence analysis of mitochondrial localization of DAAO-CHK1-OMP25. Bottom, DAAO-CHK1-OMP25 kinase activity was as described in (F). (I) H2O2 directly activates CHK1. CHK1 in vitro kinase assay following treatment with increasing amounts of H2O2. (J) H2O2 reduces the interaction between endogenous CHK1 and the CHK1 kinase domain. (K) Right, Crystal structure of C-terminal Kinase Associate 1 (KA1) domain of CHK1 highlighting the location of C408 in red, adapted from PDB ID: 5WI2. Left, Modeling of CHK1•C408 interactions as a sulfinic acid or when mutated to Asp. (L) CHK1•C408D has elevated kinase activity. (M) CHK1•C408D-mutation in KA1 domain blocks interaction with CHK1 kinase domain. Scale Bar=10 μm. Data are represented as mean ± SEM. **p < 0.001, ***p< 0.0001. Student’s t-test (two-tailed, unpaired) were used to determine statistical significance.
Figure 4:
Figure 4:. CHK1 regulates nuclear H2O2 levels.
(A) CHK1 depletion increases steady-state nuclear H2O2 levels in a NAC-dependent manner. Nuclear H2O2 levels were measured in K562 co-expressing the indicated sgRNAs and nuclear HyPer7. (B-C) Re-introduction of CHK1 restores nuclear H2O2 levels. H2O2 levels were determined by nuclear HyPer7 (B) and levels of the indicated proteins by immunoblot (C) following reintroduction of CHK1 into K562 cells depleted of CHK1. (D-E) CHK1 inhibition increases nuclear H2O2 in an antioxidant-dependent manner as measured by HyPer7 (D) and roGFP2-ORP1 (E). (F) NAC treatment partially rescues CHK1i cytotoxicity. Relative proliferation was determined after 96 hrs by measuring cellular ATP concentrations. (G) NAC protects cells from CHK1i mediated DNA damage. Immunofluorescence analysis of H2AX•S139 staining (left) and quantification (right). (H) Nuclear H2O2 increases CHK1i cytotoxicity to block cell proliferation. K562 cells stably expressing nuclear localized DAAO were pretreated with L-Ala or D-Ala prior to treatment with CHK1i. Relative proliferation was determined as described in (F). Scale bar=10 μm. Data are represented as mean ± SEM. ***P < 0.0001. Statistical significance was determined by Student’s t-test (two-tailed, unpaired).
Figure 5:
Figure 5:. CHK1 phosphorylates SSBP1 blocking its mitochondrial localization to decrease nuclear H2O2 levels
(A) Comparison of CRISPRi scores following AUR treatment with CHK1 phosphorylation sites characterized in Blasius et al. identifies SSBP1•S67 as a potential CHK1 target mediating resistance to AUR. (B) SSBP1 is a direct target of CHK1 that is phosphorylated in a H2O2-dependent manner in vitro (see methods). (C) CHK1•C408D has heightened levels of activity towards SSBP1. (D) SSBP1 regulates nuclear H2O2 levels downstream of CHK1. Left, immunoblot of SSBP1 levels in K562-dCas9-KRAB cells expressing the indicated sgRNAs. Right, Measurement of nuclear H2O2 with HyPer7 in K562 cells depleted of the indicated genes. (E) SSBP1 phosphorylation by CHK1 blocks its mitochondrial localization. Left, the localization of SSBP1-HA was determined by immunofluorescence analysis of K562 cells following the indicated treatments. Right, quantification of mitochondrial colocalization of HA-SSBP1. (F) SSBP1•S67D phosphomimetic mutant does not localize to the mitochondria. (G) CHK1•C408D is sufficient to drive SSBP1 re-localization. (H-I) SSBP1•S67D phosphomimetic mutant decreases nuclear H2O2 following CHK1 inhibition. Immunoblot analysis of the indicated proteins reintroduced into SSBP1-depleted cells (H) and corresponding levels of H2O2 levels measured with nuclear HyPer7 (I). Scale Bar=10 μm. Data are represented as mean ± SEM. **p < 0.001, ***p< 0.0001. Statistical significance was determined by Student’s t-test (two-tailed, unpaired).
Figure 6:
Figure 6:. CHK1-SSBP1 regulates mitochondrial translation to control mitochondrial/nuclear H2O2 levels.
(A) CHK1 regulates mitochondrial H2O2 levels in a SSBP1-dependent manner. H2O2 levels were determined with HyPer7 localized to the mitochondrial membrane in K562 cells depleted of the indicated genes. (B) Mitochondrial H2O2 levels regulate nuclear H2O2 levels. Nuclear H2O2 was measured with HyPer7 in K562 cells treated with mitoTEMPO and CHK1i. (C) Mitochondrial H2O2 increases CHK1i cytotoxicity. Proliferation was determined by measuring relative ATP levels. (D) Suppression of complex I (S1QEL1.1) but not complex III (S3QEL-2) superoxide partially reverts CHK1i-mediated nuclear H2O2. (E) CRISPRi scores of the indicated genes involved in mitochondrial translation. (F) CHK1 regulates mitochondrial translated proteins in a SSBP1-dependent manner. Immunoblot analysis of the indicated proteins in cells depleted of SSBP1 and treated with CHK1i. (G) CHK1-regulation of mitochondrial translation depends on SSPB1 localization. Immunoblot analysis of the indicated mitochondrial proteins as described in (F) in cells expressing SSBP1 phosphorylation mutants in K562 cells depleted of SSBP1. (H) Inhibition of CHK1 increases mitochondrial translation. Expression of MT-CO2 was determined by immunoblot and normalized to β-actin following CHK1i treatment (see also methods, Figure S6H). (I) Doxycycline (DOXY) decreases mitochondrially translated proteins. (J) DOXY treatment reduces CHK1i-mediated nuclear H2O2 levels. Scale Bar=10 μm. Data are represented as mean ± SEM. ***p< 0.0001. Statistical significance was determined by Student’s t-test (two-tailed, unpaired).
Figure 7:
Figure 7:. SSBP1 regulates nuclear H2O2 levels and mediates cisplatin resistance in ovarian cancer cells.
(A) SSBP1 depletion decreases nuclear H2O2 levels following treatment with anticancer agents in K562 cells. (B) Comparison of fold-change in nuclear H2O2 levels with proliferation rescue in K562 cells depleted of SSBP1 following treatment with the indicated compounds. (C) Lower SSBP1 levels correlate with shorter platinum free intervals (PFI) in high-grade serous ovarian cancer (HGSOC) tumors. (D) SSPB1 levels are decreased in platinum-refractory HGSOC tumors. (E) Knockdown of SSBP1 decreases cisplatin regulated nuclear H2O2 levels in ovarian cancer cell lines. (F) Heatmap depicting fold change in DDP IC50 values in ovarian cancer cell lines expressing the indicated shRNAs targeting SSBP1. (G-H) DDP-resistant ovarian cancers have decreased SSBP1 expression. (G) DDP IC50 values were measured in parental or DDP-resistant ovarian cancer cell lines. (H) Immunoblot analysis of SSBP1 in the indicated cell lines. (I) Model. Nuclear H2O2 activates CHK1 leading to the phosphorylation and cytosolic retention of SSBP1. Cytosolic SSBP1 cannot promote mitochondrial translation which generates H2O2. Mitochondrial H2O2 is transmitted to the nucleus following a decrease in GSH:GSSH ratio by certain anticancer drugs. Data are represented as mean ± SEM. * p < 0.05, ***p< 0.0001. Statistical significance was determined by one-way ANOVA with Sidak’s post-hoc correction.

Update of

Comment in

References

    1. Chio IIC, and Tuveson DA (2017). ROS in Cancer: The Burning Question. Trends in molecular medicine 23, 411–429. 10.1016/j.molmed.2017.03.004. - DOI - PMC - PubMed
    1. Reczek CR, and Chandel NS (2015). ROS-dependent signal transduction. Current opinion in cell biology 33, 8–13. 10.1016/j.ceb.2014.09.010. - DOI - PMC - PubMed
    1. Chouchani ET, Kazak L, and Spiegelman BM (2017). Mitochondrial reactive oxygen species and adipose tissue thermogenesis: Bridging physiology and mechanisms. The Journal of biological chemistry 292, 16810–16816. 10.1074/jbc.R117.789628. - DOI - PMC - PubMed
    1. Collins Y, Chouchani ET, James AM, Menger KE, Cocheme HM, and Murphy MP (2012). Mitochondrial redox signalling at a glance. Journal of cell science 125, 801–806. 10.1242/jcs.098475. - DOI - PubMed
    1. Dixon SJ, and Stockwell BR (2019). The Hallmarks of Ferroptosis. Annual Review of Cancer Biology 3, 35–54. 10.1146/annurev-cancerbio-030518-055844. - DOI

Publication types

MeSH terms

LinkOut - more resources