

ROS Generative Black Phosphorus-Tamoxifen Nanosheets for Targeted Endocrine-Sonodynamic Synergistic Breast Cancer Therapy
- PMID: 37192893
- PMCID: PMC10182776
- DOI: 10.2147/IJN.S406627
ROS Generative Black Phosphorus-Tamoxifen Nanosheets for Targeted Endocrine-Sonodynamic Synergistic Breast Cancer Therapy
Abstract
Introduction: Tamoxifen (TAM) has proven to be a therapeutic breakthrough to reduce mortality and recurrence in estrogen receptor-positive (ER+) breast cancer patients. However, the application of TAM exhibits low bioavailability, off-target toxicity, instinct and acquired TAM resistance.
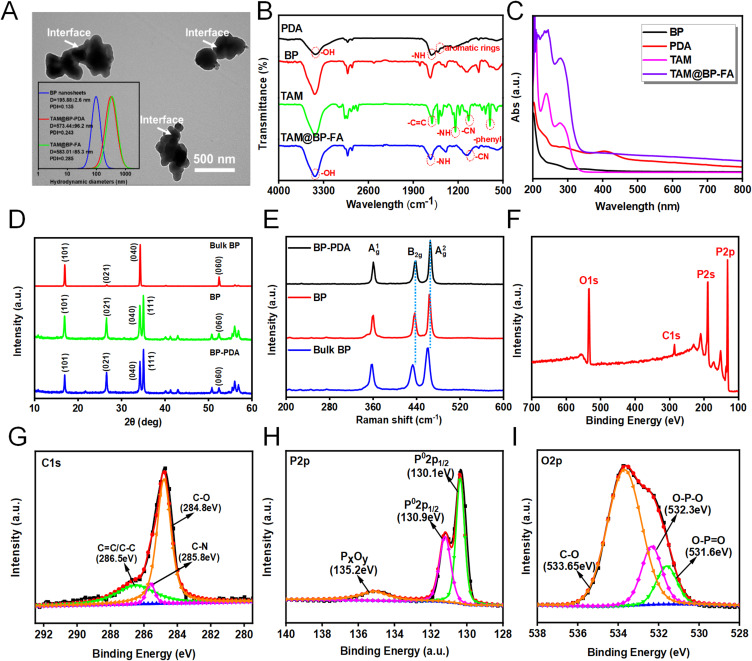
Methods: We utilized black phosphorus (BP) as a drug carrier and sonosensitizer, integrated with TAM and tumor-targeting ligand folic acid (FA) to construct TAM@BP-FA for synergistic endocrine and sonodynamic therapy (SDT) of breast cancer. The exfoliated BP nanosheets were modified through in situ polymerization of dopamine, followed by electrostatic adsorption of TAM and FA. The anticancer effect of TAM@BP-FA was evaluated through in vitro cytotoxicity and in vivo antitumor model. RNA-sequencing (RNA-seq), quantitative real-time PCR, Western blot analysis, flow cytometry analysis and peripheral blood mononuclear cells (PBMCs) analysis were performed for mechanism investigation.
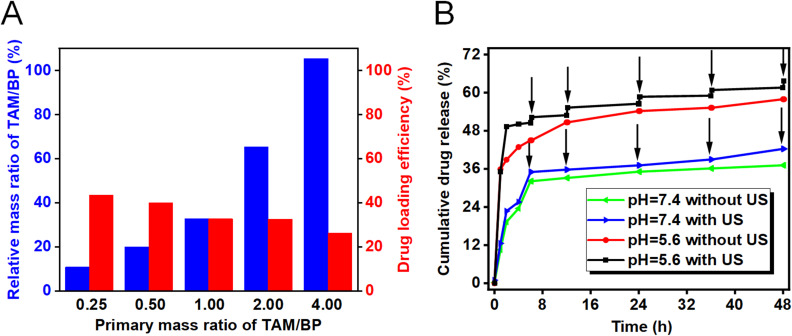
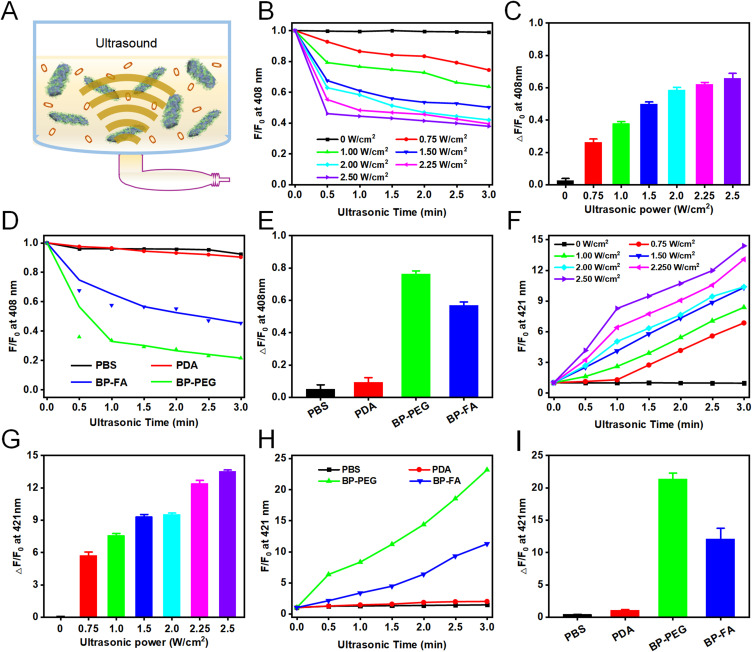
Results: TAM@BP-FA had satisfactory drug loading capacity, the TAM release behavior can be controlled through pH microenvironment and ultrasonic stimulation. An amount of hydroxyl radical (∙OH) and singlet oxygen (1O2) were as expected generated under ultrasound stimulation. TAM@BP-FA nanoplatform showed excellent internalization in both TAM-sensitive MCF7 and TAM-resistant (TMR) cells. Using TMR cells, TAM@BP-FA displayed significantly enhanced antitumor ability in comparison with TAM (7.7% vs 69.6% viability at 5μg/mL), the additional SDT further caused 15% more cell death. RNA-seq unraveled the TAM@BP-FA antitumor mechanisms including effects on cell cycle, apoptosis and cell proliferation. Further analysis showed additional SDT successfully triggering reactive oxygen species (ROS) generation and mitochondrial membrane potential (MMP) reduction. Moreover, PBMCs exposed to TAM@BP-FA induced an antitumor immune response by natural killer (NK) cell upregulation and immunosuppression macrophage reduction.
Conclusion: The novel BP-based strategy not only delivers TAM specifically to tumor cells but also exhibits satisfactory antitumor effects through targeted therapy, SDT, and immune cell modulation. The nanoplatform may provide a superior synergistic strategy for breast cancer therapy.
Keywords: PBMC; black phosphorus; breast cancer; combination therapy; sonodynamic therapy; tamoxifen.
© 2023 Wang et al.
Conflict of interest statement
The authors declare that they have no known competing financial interests or personal relationships that could have appeared to influence the work reported in this paper.
Figures


Similar articles
-
Ultrasound imaging guided targeted sonodynamic therapy enhanced by magnetophoretically controlled magnetic microbubbles.Int J Pharm. 2024 Apr 25;655:124015. doi: 10.1016/j.ijpharm.2024.124015. Epub 2024 Mar 26. Int J Pharm. 2024. PMID: 38527565
-
Tumor-associated macrophages secrete CC-chemokine ligand 2 and induce tamoxifen resistance by activating PI3K/Akt/mTOR in breast cancer.Cancer Sci. 2020 Jan;111(1):47-58. doi: 10.1111/cas.14230. Epub 2019 Dec 19. Cancer Sci. 2020. PMID: 31710162 Free PMC article.
-
Role of mitochondria in tamoxifen-induced rapid death of MCF-7 breast cancer cells.Apoptosis. 2005 Dec;10(6):1395-410. doi: 10.1007/s10495-005-2137-z. Apoptosis. 2005. PMID: 16215679
-
Sonodynamic therapy-based nanoplatforms for combating bacterial infections.Ultrason Sonochem. 2023 Nov;100:106617. doi: 10.1016/j.ultsonch.2023.106617. Epub 2023 Sep 23. Ultrason Sonochem. 2023. PMID: 37769588 Free PMC article. Review.
-
Black Phosphorus, an Emerging Versatile Nanoplatform for Cancer Immunotherapy.Pharmaceutics. 2021 Aug 27;13(9):1344. doi: 10.3390/pharmaceutics13091344. Pharmaceutics. 2021. PMID: 34575419 Free PMC article. Review.
Cited by
-
Glutathione Depletion-Induced ROS/NO Generation for Cascade Breast Cancer Therapy and Enhanced Anti-Tumor Immune Response.Int J Nanomedicine. 2024 Mar 7;19:2301-2315. doi: 10.2147/IJN.S440709. eCollection 2024. Int J Nanomedicine. 2024. PMID: 38469056 Free PMC article.
-
Sono-Piezo Dynamic Therapy: Utilizing Piezoelectric Materials as Sonosensitizer for Sonodynamic Therapy.Adv Sci (Weinh). 2025 Mar;12(12):e2417439. doi: 10.1002/advs.202417439. Epub 2025 Feb 8. Adv Sci (Weinh). 2025. PMID: 39921482 Free PMC article. Review.
-
Nanosensitizer-assisted sonodynamic therapy for breast cancer.J Nanobiotechnology. 2025 Apr 7;23(1):281. doi: 10.1186/s12951-025-03311-3. J Nanobiotechnology. 2025. PMID: 40197318 Free PMC article. Review.
References
MeSH terms
Substances
LinkOut - more resources
Full Text Sources
Medical
