

Atlas of interactions between SARS-CoV-2 macromolecules and host proteins
- PMID: 37192911
- PMCID: PMC9670597
- DOI: 10.1016/j.cellin.2022.100068
Atlas of interactions between SARS-CoV-2 macromolecules and host proteins
Abstract
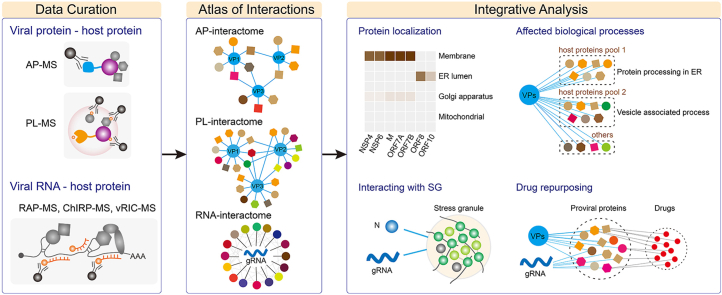
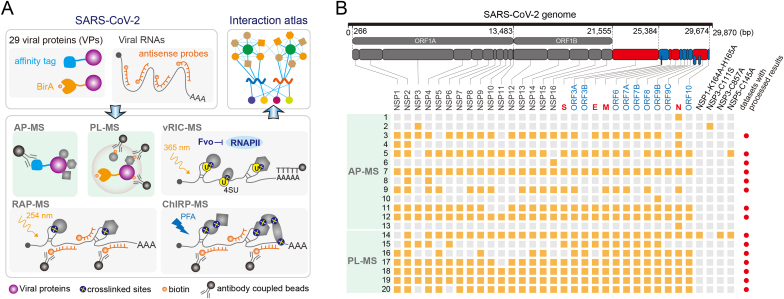
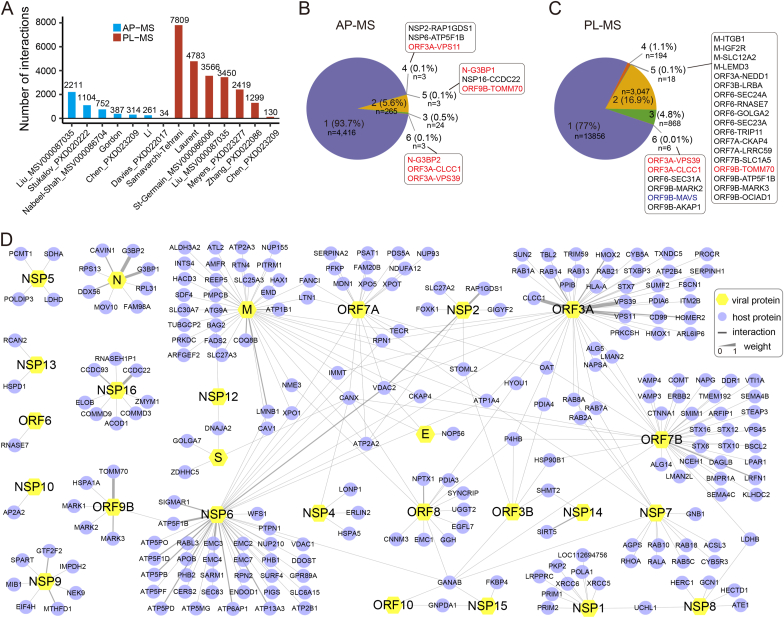
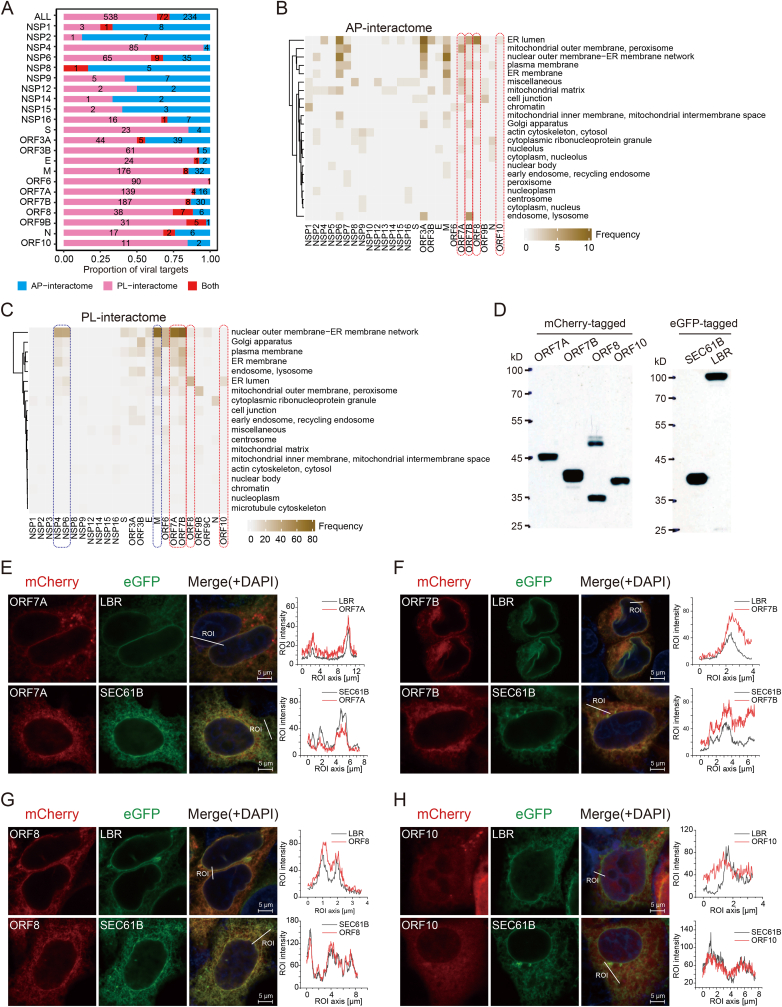
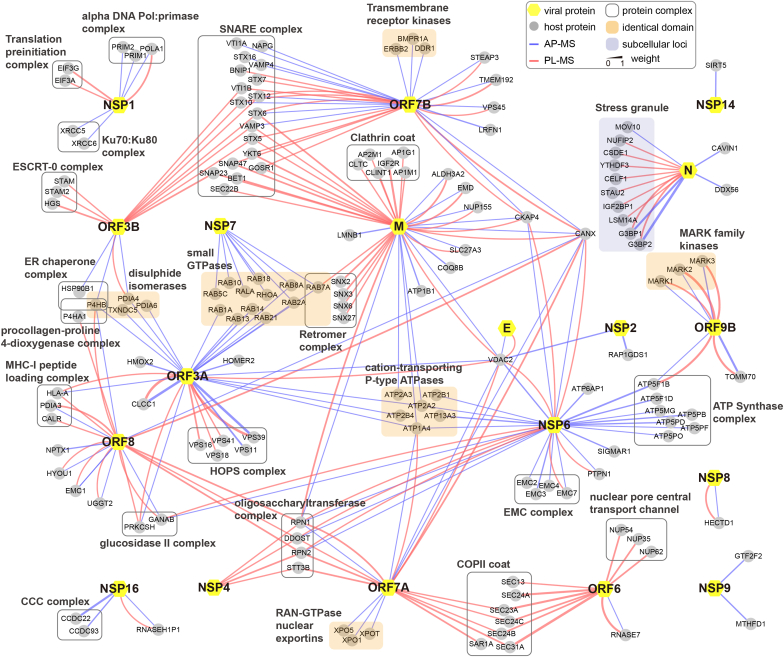
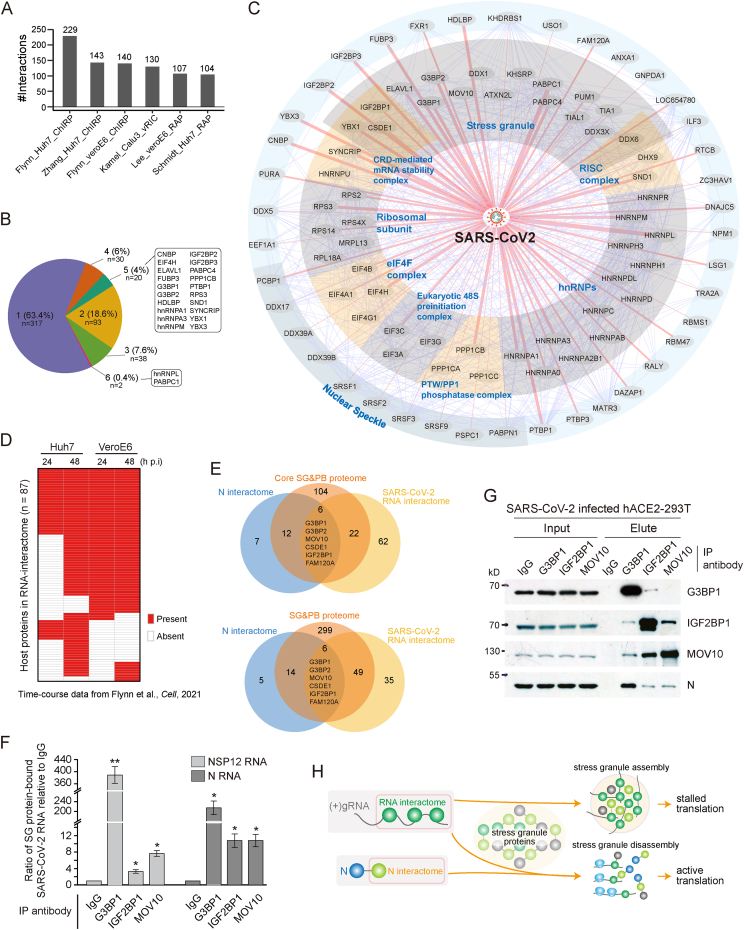
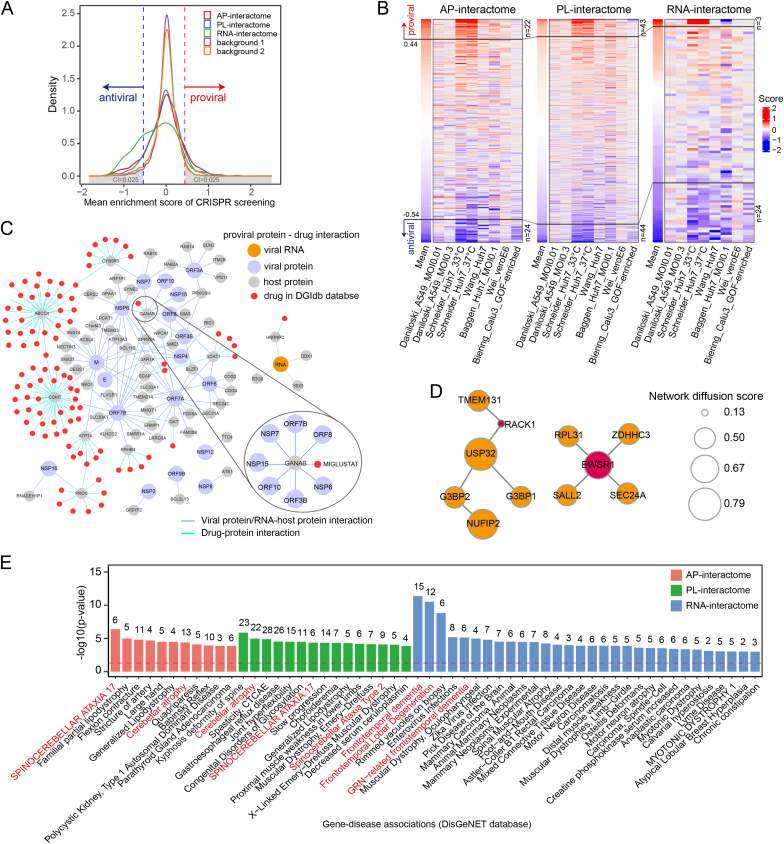
The proteins and RNAs of viruses extensively interact with host proteins after infection. We collected and reanalyzed all available datasets of protein-protein and RNA-protein interactions related to SARS-CoV-2. We investigated the reproducibility of those interactions and made strict filters to identify highly confident interactions. We systematically analyzed the interaction network and identified preferred subcellular localizations of viral proteins, some of which such as ORF8 in ER and ORF7A/B in ER membrane were validated using dual fluorescence imaging. Moreover, we showed that viral proteins frequently interact with host machinery related to protein processing in ER and vesicle-associated processes. Integrating the protein- and RNA-interactomes, we found that SARS-CoV-2 RNA and its N protein closely interacted with stress granules including 40 core factors, of which we specifically validated G3BP1, IGF2BP1, and MOV10 using RIP and Co-IP assays. Combining CRISPR screening results, we further identified 86 antiviral and 62 proviral factors and associated drugs. Using network diffusion, we found additional 44 interacting proteins including two proviral factors previously validated. Furthermore, we showed that this atlas could be applied to identify the complications associated with COVID-19. All data are available in the AIMaP database (https://mvip.whu.edu.cn/aimap/) for users to easily explore the interaction map.
Keywords: Drug repurposing; Protein localization; Protein-interactome; RNA-Interactome; SARS-CoV-2.
© 2022 The Authors.
Conflict of interest statement
The authors declare that they have no conflict of interest.
Figures
Similar articles
-
Comparison of viral RNA-host protein interactomes across pathogenic RNA viruses informs rapid antiviral drug discovery for SARS-CoV-2.Cell Res. 2022 Jan;32(1):9-23. doi: 10.1038/s41422-021-00581-y. Epub 2021 Nov 4. Cell Res. 2022. PMID: 34737357 Free PMC article.
-
MOV10 Helicase Interacts with Coronavirus Nucleocapsid Protein and Has Antiviral Activity.mBio. 2021 Oct 26;12(5):e0131621. doi: 10.1128/mBio.01316-21. Epub 2021 Sep 14. mBio. 2021. PMID: 34517762 Free PMC article.
-
Proteomic analysis identifies the RNA helicase DDX3X as a host target against SARS-CoV-2 infection.Antiviral Res. 2021 Jun;190:105064. doi: 10.1016/j.antiviral.2021.105064. Epub 2021 Mar 26. Antiviral Res. 2021. PMID: 33781803 Free PMC article.
-
RNA-protein interactomes as invaluable resources to study RNA viruses: Insights from SARS CoV-2 studies.Wiley Interdiscip Rev RNA. 2022 Nov;13(6):e1727. doi: 10.1002/wrna.1727. Epub 2022 Mar 27. Wiley Interdiscip Rev RNA. 2022. PMID: 35343064 Free PMC article. Review.
-
Repurposing Sigma-1 Receptor Ligands for COVID-19 Therapy?Front Pharmacol. 2020 Nov 9;11:582310. doi: 10.3389/fphar.2020.582310. eCollection 2020. Front Pharmacol. 2020. PMID: 33364957 Free PMC article. Review.
Cited by
-
The roles of macrophages and monocytes in COVID-19 Severe Respiratory Syndrome.Cell Insight. 2025 May 8;4(4):100250. doi: 10.1016/j.cellin.2025.100250. eCollection 2025 Aug. Cell Insight. 2025. PMID: 40689082 Free PMC article. Review.
-
Structure-Guided design of Cas12a variants improves detection of nucleic acids.Cell Insight. 2025 Jan 20;4(2):100228. doi: 10.1016/j.cellin.2025.100228. eCollection 2025 Apr. Cell Insight. 2025. PMID: 40061934 Free PMC article.
-
Multimodal SARS-CoV-2 interactome sketches the virus-host spatial organization.Commun Biol. 2025 Mar 26;8(1):501. doi: 10.1038/s42003-025-07933-z. Commun Biol. 2025. PMID: 40140549 Free PMC article.
-
DCAF7 Acts as A Scaffold to Recruit USP10 for G3BP1 Deubiquitylation and Facilitates Chemoresistance and Metastasis in Nasopharyngeal Carcinoma.Adv Sci (Weinh). 2024 Sep;11(36):e2403262. doi: 10.1002/advs.202403262. Epub 2024 Jul 8. Adv Sci (Weinh). 2024. PMID: 38973296 Free PMC article.
-
Predicting host-based, synthetic lethal antiviral targets from omics data.bioRxiv [Preprint]. 2023 Aug 16:2023.08.15.553430. doi: 10.1101/2023.08.15.553430. bioRxiv. 2023. Update in: NAR Mol Med. 2024 Jan 23;1(1):ugad001. doi: 10.1093/narmme/ugad001. PMID: 37645861 Free PMC article. Updated. Preprint.
References
-
- Baek M., Dimaio F., Anishchenko I., Dauparas J., Ovchinnikov S., Lee G.R., Wang J., Cong Q., Kinch L.N., Schaeffer R.D., Millan C., Park H., Adams C., Glassman C.R., Degiovanni A., Pereira J.H., Rodrigues A.V., Van Dijk A.A., Ebrecht A.C.…Baker D. Accurate prediction of protein structures and interactions using a three-track neural network. Science. 2021;373:871–876. - PMC - PubMed
-
- Baggen J., Persoons L., Vanstreels E., Jansen S., Van Looveren D., Boeckx B., Geudens V., De Man J., Jochmans D., Wauters J., Wauters E., Vanaudenaerde B.M., Lambrechts D., Neyts J., Dallmeier K., Thibaut H.J., Jacquemyn M., Maes P., Daelemans D. Genome-wide CRISPR screening identifies TMEM106B as a proviral host factor for SARS-CoV-2. Nature Genetics. 2021;53:435–444. - PubMed
-
- Baggen J., Vanstreels E., Jansen S., Daelemans D. Cellular host factors for SARS-CoV-2 infection. Nat Microbiol. 2021;6:1219–1232. - PubMed
LinkOut - more resources
Full Text Sources
Miscellaneous
