. 2023 Apr 5;2(3):100100.
doi: 10.1016/j.cellin.2023.100100. eCollection 2023 Jun.

The deubiquitinase OTUD4 inhibits the expression of antimicrobial peptides in Paneth cells to support intestinal inflammation and bacterial infection

Affiliations

The deubiquitinase OTUD4 inhibits the expression of antimicrobial peptides in Paneth cells to support intestinal inflammation and bacterial infection

Keying Yu et al. Cell Insight. .

Erratum in

  • Corrigendum to previous published articles.
    [No authors listed] [No authors listed] Cell Insight. 2025 Jan 11;4(2):100225. doi: 10.1016/j.cellin.2024.100225. eCollection 2025 Apr. Cell Insight. 2025. PMID: 39881711 Free PMC article.

Abstract

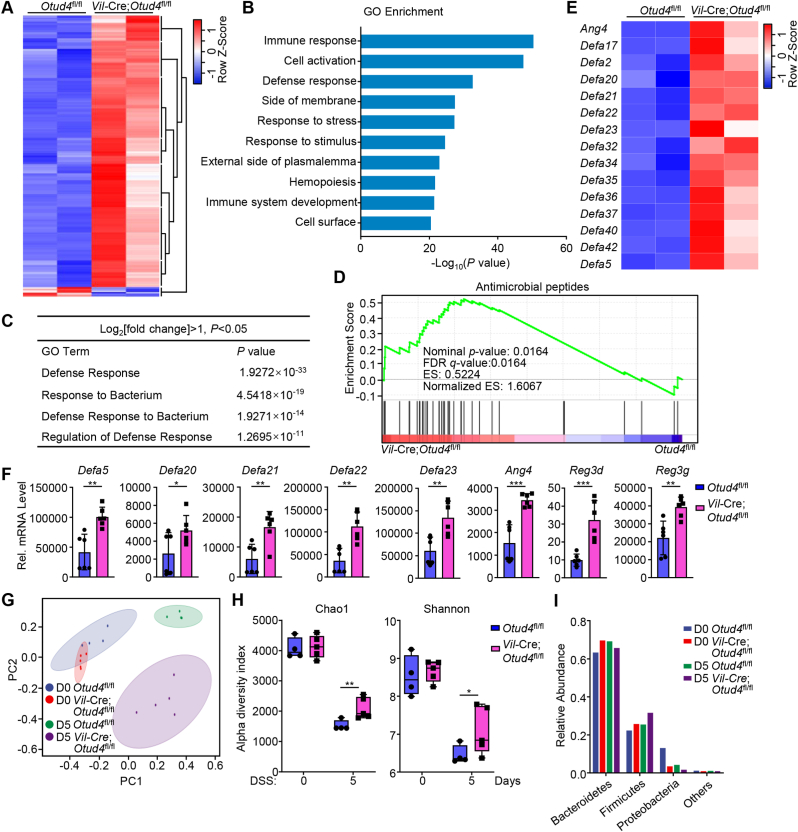
Dysfunction of the intestinal epithelial barrier causes microbial invasion that would lead to inflammation in the gut. Antimicrobial peptides (AMPs) are essential components of the intestinal epithelial barrier, while the regulatory mechanisms of AMPs expression are not fully characterized. Here, we report that the ovarian tumor family deubiquitinase 4 (OTUD4) in Paneth cells restricts the expression of AMPs and thereby promotes experimental colitis and bacterial infection. OTUD4 is upregulated in the inflamed mucosa of ulcerative colitis patients and in the colon of mice treated with dextran sulfate sodium salt (DSS). Knockout of OTUD4 promotes the expression of AMPs in intestinal organoids after stimulation with lipopolysaccharide (LPS) or peptidoglycan (PGN) and in the intestinal epithelial cells (IECs) of mice after DSS treatment or Salmonella typhimurium (S.t.) infection. Consistently, Vil-Cre;Otud4fl/fl mice and Def-Cre;Otud4fl/fl mice exhibit hyper-resistance to DSS-induced colitis and S.t. infection compared to Otud4fl/fl mice. Mechanistically, knockout of OTUD4 results in hyper K63-linked ubiquitination of MyD88 and increases the activation of NF-κB and MAPKs to promote the expression of AMPs. These findings collectively highlight an indispensable role of OTUD4 in Paneth cells to modulate AMPs production and indicate OTUD4 as a potential target for gastrointestinal inflammation and bacterial infection.

Keywords: Antimicrobial peptides; Bacterial infection; Colitis; Deubiquitination; MyD88; OTUD4.


Figures

Image 1
Graphical abstract
Fig. 1
Fig. 1
Otud4 deficiency in IECs leads to increased resistance toDSS-inducedcolitis. (A) OTUD4 mRNA expression levels in colonic mucosa tissues from ulcerative colitis (UC) patients and healthy individuals (data from GEO database GDS3119) (n = 26). (B) A scheme of DSS-induced colitis (upper scheme) and body weight change (lower graph) of Otud4fl/fl (n = 14) and Vil-Cre;Otud4fl/fl (n = 14) mice treated with 2.5% DSS for 5 days followed by normal sterile water for 2 days. (C) A representative image and the lengths of colons of Otud4fl/fl (n = 14) and Vil-Cre;Otud4fl/fl (n = 14) mice treated as in (B). (D) Representative images of HE-stained colon sections of Otud4fl/fl and Vil-Cre;Otud4fl/fl mice treated as in (B). (E) The pathology scores of Otud4fl/fl (n = 14) and Vil-Cre;Otud4fl/fl (n = 14) mice treated as in (B). ∗P ​< ​0.05, ∗∗P ​< ​0.01, ∗∗∗P < 0.001 (Student's unpaired t-test in A–C, E). Graphs show mean ± S.D. (A–C, E). Red and black scale bars represent 2 cm and 400 μm, respectively (C, D). Data are combined three independent experiments (B, C, E) or representative of three independent experiments (D).
Fig. 2
Fig. 2
Depletion of OTUD4 in IECs alters the expression of AMPs and reshapes gut microbiota. (A) Heat map of differentially expressed genes (DEGs) (P < 0.05 and |log2 Fold change|≥1) in the transcriptomic profile of intestinal epithelial cells (IECs) from Otud4fl/fl (n = 2) and Vil-Cre;Otud4fl/fl (n = 2) mice that were given 2.5% DSS in drinking water for 2 d. (B) GO (gene ontology) analysis from the transcriptomic data obtained in (A). (C) A table of GO pathways associated with bacterial defense from the transcriptomic data obtained in (A). (D) GSEA analysis of antimicrobial peptides from the transcriptomic data obtained in (A). FDR, false discovery rate; ES, enrichment score. (E) Heatmap of the indicated genes related antimicrobial peptides from the transcriptomic data obtained in (A). (F) qRT-PCR analysis of the indicated genes of IECs from two groups of Otud4fl/fl (n = 6) and Vil-Cre;Otud4fl/fl (n = 6) mice that were given 2.5% DSS in drinking water for 2 d. (G) PCoA analysis from 16S rRNA sequencing in the feces of Otud4fl/fl (n = 4) and Vil-Cre;Otud4fl/fl (n = 5) mice that were given 2.5% DSS in drinking water for 0 d or 5 d. (H) Chao1 richness and Shannon diversity analysis of the 16S rRNA sequencing data obtained in (G). (I) Bacterial relative abundance from 16S rRNA sequencing data obtained in (G). ∗P ​< ​0.05, ∗∗P ​< ​0.01, ∗∗∗P < 0.001 (Student's unpaired t-test in F, H). Graphs show mean ± S.D. (F, H). Data are representative of two (F) independent experiments.
Fig. 3
Fig. 3
Knockout of OTUD4 in IECs leads tohyper-resistancetoS.t. infection. (A) Survival of Otud4fl/fl (n = 7) and Vil-Cre;Otud4fl/fl (n = 9) mice that were injected with Salmonella typhimurium (S.t.) (2 × 107 c.f.u. per mouse) by gavage. (B) Body weight change of Otud4fl/fl (n = 12) and Vil-Cre;Otud4fl/fl (n = 12) mice treated as in (A). (C) A representative image and the lengths of colons of Otud4fl/fl (n = 12) and Vil-Cre;Otud4fl/fl (n = 12) mice treated as in (A) and sacrificed at day 6. (D) Representative images of HE-stained colon sections of Otud4fl/fl and Vil-Cre;Otud4fl/fl mice treated as in (A) and sacrificed at day 6. (E) Bacterial counts (CFU/g) of feces, cecum, liver, and spleen from Otud4fl/fl (n = 5) and Vil-Cre;Otud4fl/fl (n = 5) mice treated as in (A). (F) qRT-PCR analysis of expression levels of the indicated genes of IECs from Otud4fl/fl (n = 6) and Vil-Cre;Otud4fl/fl (n = 6) mice at day 2 after injection of S.t. (2 × 107 c.f.u. per mouse) by gavage. ∗P ​< ​0.05, ∗∗P ​< ​0.01, ∗∗∗P < 0.001 (Log-rank test in A, Student's unpaired t-test in B, C, E, F). Graphs show mean ± S.D. (B, C, E, F). Red and black scale bars represent 2 cm and 400 μm, respectively (C, D). Data are representative of two independent experiments (A, D–F) or combined two independent experiments (B, C).
Fig. 4
Fig. 4
OTUD4 in Paneth cells supportsDSS-induced colitis andS.t. infection. (A) A scheme of DSS-induced colitis (upper scheme) and body weight change (lower graph) of Otud4fl/fl (n = 7) and Def-Cre;Otud4fl/fl (n = 7) mice with 2.5% DSS for 5 days followed by normal sterile water for 2 days. (B) A representative image and the lengths of colons of Otud4fl/fl (n = 7) and Def-Cre;Otud4fl/fl (n = 7) mice treated as in (A). (C) Representative images of HE-stained colon sections of Otud4fl/fl and Def-Cre;Otud4fl/fl mice treated as in (A). (D) The pathology scores of Otud4fl/fl (n = 7) and Def-Cre;Otud4fl/fl (n = 7) mice treated as in (A). (E) qRT-PCR analysis of expression levels of the indicated genes of IECs from Otud4fl/fl (n = 6) and Def-Cre;Otud4fl/fl (n = 6) mice that were given 2.5% DSS in drinking water for 2 d. (F) Survival of Otud4fl/fl (n = 12) and Def-Cre;Otud4fl/fl (n = 8) mice that were injected with S.t. (2 × 107 c.f.u. per mouse) by gavage. (G) Body weight change of Otud4fl/fl (n = 12) and Def-Cre;Otud4fl/fl (n = 12) mice treated as in (F) and sacrificed at day 6. (H) A representative image and the lengths of colons of Otud4fl/fl (n = 12) and Def-Cre;Otud4fl/fl (n = 12) mice treated as in (F) and sacrificed at day 6. (I) Representative images of HE-stained colon sections of Otud4fl/fl and Def-Cre;Otud4fl/fl mice treated as in (F) and sacrificed at day 6. (J) Bacterial counts (CFU/g) of feces, cecum, liver, and spleen from Otud4fl/fl (n = 6) and Def-Cre;Otud4fl/fl (n = 6) mice treated as in (F). (K) qRT-PCR analysis of Def5a or Reg3g of IECs from Otud4fl/fl (n = 6) and Def-Cre;Otud4fl/fl (n = 6) mice at day 2 after injection of S.t. (2 × 107 c.f.u. per mouse) by gavage. ∗P ​< ​0.05, ∗∗P ​< ​0.01, ∗∗∗P < 0.001 (Student's unpaired t-test in A, B, D, E, G, H, J, K, Log-rank test in F). Graphs show mean ± S.D. (A, B, D, E, G, H, J, K). Red and black scale bars represent 2 cm and 400 μm (B, C, H, I). Data are combined two independent experiments (A, B, D, F–H) or representative of two independent experiments (C, E, I, J, K).
Fig. 5
Fig. 5
OTUD4 inhibits the expression of AMPs by targeting MyD88. (A) Whole-cell extract of IECs from wild-type C57BL/6 mice was immunoprecipitated with control IgG or anti-OTUD4 and subjected to immunoblot analysis. (B) Pulldown (with GST beads and GST-K63-Ub-TUBE) and immunoblot analysis of IECs from Otud4fl/fl (n = 2) and Vil-Cre;Otud4fl/fl (n = 2) mice that were uninduced, given 2.5% DSS in drinking water for 2 days or infected with S.t. (2 × 107 c.f.u. per mouse) by gavage for 2 days. TUBE, tandem ubiquitin binding entity. (C) Immunoblot analysis of the indicated proteins in IECs from Otud4fl/fl (n = 2) and Vil-Cre;Otud4fl/fl (n = 2) mice treated as in (B). (D) qRT-PCR analysis of the indicated genes of intestinal organoids from Otud4fl/fl and Vil-Cre;Otud4fl/fl mice that were unstimulated or stimulated with LPS (10 μg/mL) or PGN (10 μg/mL) in the presence or absence of ST2825 (a MyD88 inhibitor, 10 μM) for 4 h. (E) qRT-PCR analysis of the indicated genes of intestinal organoids from Otud4fl/fl and Vil-Cre;Otud4fl/fl mice that were uninfected and infected with S.t. (MOI, 1:200) in the presence or absence of ST2825 (10 μM) for 2 h ∗P ​< ​0.05, ∗∗P ​< ​0.01, ∗∗∗P < 0.001 (Student's unpaired t-test in D, E). Graphs show mean ± S.D. (D, E). Data are representative of two independent experiments (A, C, D, E) or three independent experiments (B).

References

    1. Adolph T.E., Tomczak M.F., Niederreiter L., Ko H.J., Bock J., Martinez-Naves E., Glickman J.N., Tschurtschenthaler M., Hartwig J., Hosomi S., et al. Paneth cells as a site of origin for intestinal inflammation. Nature. 2013;503:272–276. - PMC - PubMed
    1. Annese V. Genetics and epigenetics of IBD. Pharmacological Research. 2020;159 - PubMed
    1. An R., Wang P., Guo H., Liuyu T., Zhong B., Zhang Z.-D. USP2 promotes experimental colitis and bacterial infections by inhibiting the proliferation of myeloid cells and remodeling the extracellular matrix network. Cell Insight. 2022;1 - PMC - PubMed
    1. Caruso R., Lo B.C., Nunez G. Host-microbiota interactions in inflammatory bowel disease. Nature Reviews Immunology. 2020;20:411–426. - PubMed
    1. Chen J., Zhai Z., Long H., Yang G., Deng B., Deng J. Inducible expression of defensins and cathelicidins by nutrients and associated regulatory mechanisms. Peptides. 2020;123 - PubMed

LinkOut - more resources