

Stabilization of uric acid mixed crystals by melamine
- PMID: 37193265
- PMCID: PMC10168670
- DOI: 10.1016/j.jcrysgro.2023.127134
Stabilization of uric acid mixed crystals by melamine
Abstract
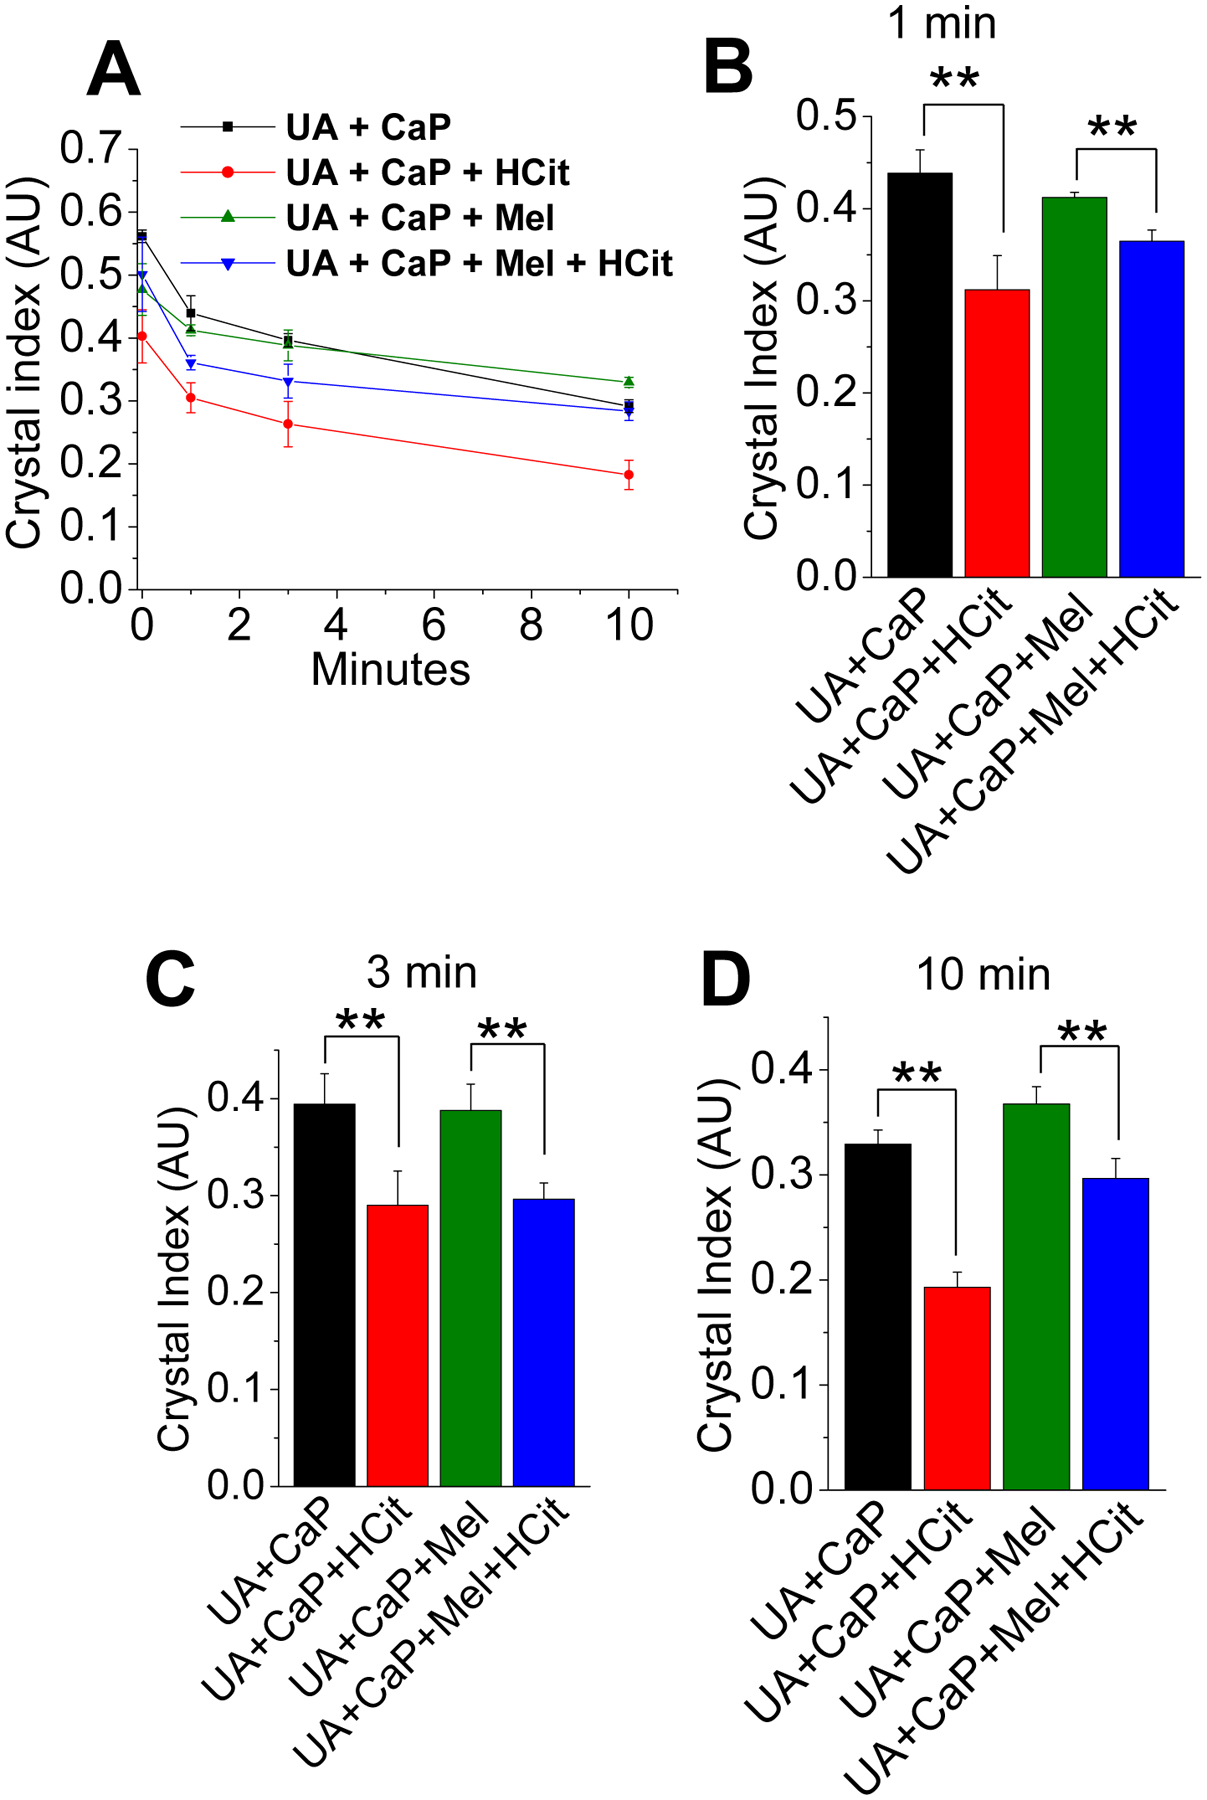
Melamine stabilizes heterogeneous nucleation of calcium crystals by increasing the retention time and decreasing the rate of dissolution. Stabilization of such mixed crystals limit the efficacy of non-invasive treatment options for kidney stones. Crystalline forms of uric acid (UA) are also involved in urolithiasis or UA kidney stones; however, its interactions with contaminating melamine and the resulting effects on the retention of kidney stones remain unknown. Since melamine augments calcium crystal formation, it provides an avenue for us to understand the stability of UA-calcium phosphate (CaP) crystals. We show here that melamine facilitates UA+CaP crystal formation, resulting in greater aggregates. Moreover, melamine induced mixed crystal retention through a time-dependent manner in presence and/or absence of hydroxycitrate (crystal inhibitor), indicating its abridged effectiveness as conventional remedy. CaP was also shown to modify optical properties of UA+CaP mixed crystals. Differential staining of individual crystals revealed enhanced co-aggregation of UA and CaP. The dissolution rate of UA in presence of melamine was faster than its heterogeneous crystallization form with CaP, although the size was comparatively much smaller, suggesting disparity in regulation between UA and CaP crystallization. While melamine stabilized UA, CaP and mixed crystals in relatively physiological conditions (artificial urine), the retentions of those crystals were further augmented by melamine, even in presence of hydroxycitrate, thus reducing treatment efficacy.
Keywords: A1. Biocrystallization; A2. Heterogeneous Nucleation; B1. Solubility; B2. Kidney stones dissolution; B3. Calcium compounds.
Conflict of interest statement
Declaration of interests The authors declare that they have no known competing financial interests or personal relationships that could have appeared to influence the work reported in this paper. Conflicts of Interest: The authors declare no conflict of interest.
Figures


Similar articles
-
Matting Calcium Crystals by Melamine Improves Stabilization and Prevents Dissolution.Cryst Growth Des. 2019 Nov 6;19(11):6636-6648. doi: 10.1021/acs.cgd.9b01036. Epub 2019 Oct 14. Cryst Growth Des. 2019. PMID: 31749663 Free PMC article.
-
Melamine promotes calcium crystal formation in three-dimensional microfluidic device.Sci Rep. 2019 Jan 29;9(1):875. doi: 10.1038/s41598-018-37191-5. Sci Rep. 2019. PMID: 30696888 Free PMC article.
-
Investigations on melamine-based uric acid kidney stone formation and its prevention by inhibitors.Urolithiasis. 2023 Apr 11;51(1):68. doi: 10.1007/s00240-023-01437-3. Urolithiasis. 2023. PMID: 37039903
-
Do "inhibitors of crystallisation" play any role in the prevention of kidney stones? A critique.Urolithiasis. 2017 Feb;45(1):43-56. doi: 10.1007/s00240-016-0953-y. Epub 2016 Nov 29. Urolithiasis. 2017. PMID: 27900407 Review.
-
Is there a role for uric acid in an animal model of calcium phosphate nephrocalcinosis and calcium phosphate crystallization in urine of patients with idiopathic calcium urolithiasis? An orientational study.J Endourol. 1999 Nov;13(9):637-45. doi: 10.1089/end.1999.13.637. J Endourol. 1999. PMID: 10608515 Review.
Cited by
-
Titanium Dioxide Promotes the Growth and Aggregation of Calcium Phosphate and Monosodium Urate Mixed Crystals.Crystals (Basel). 2024 Jan;14(1):11. doi: 10.3390/cryst14010011. Epub 2023 Dec 22. Crystals (Basel). 2024. PMID: 38287972 Free PMC article.
-
Improved polarized light microscopic detection of gouty crystals via dissolution with formalin and ethylenediamine tetraacetic acid.Sci Rep. 2023 May 9;13(1):7505. doi: 10.1038/s41598-023-34570-5. Sci Rep. 2023. PMID: 37160946 Free PMC article.
References
Grants and funding
LinkOut - more resources
Full Text Sources
Miscellaneous
