. 2023 May 16;14(1):2803.
doi: 10.1038/s41467-023-38215-z.

A pesticide and iPSC dopaminergic neuron screen identifies and classifies Parkinson-relevant pesticides

Affiliations

A pesticide and iPSC dopaminergic neuron screen identifies and classifies Parkinson-relevant pesticides

Kimberly C Paul et al. Nat Commun. .

Erratum in

Abstract

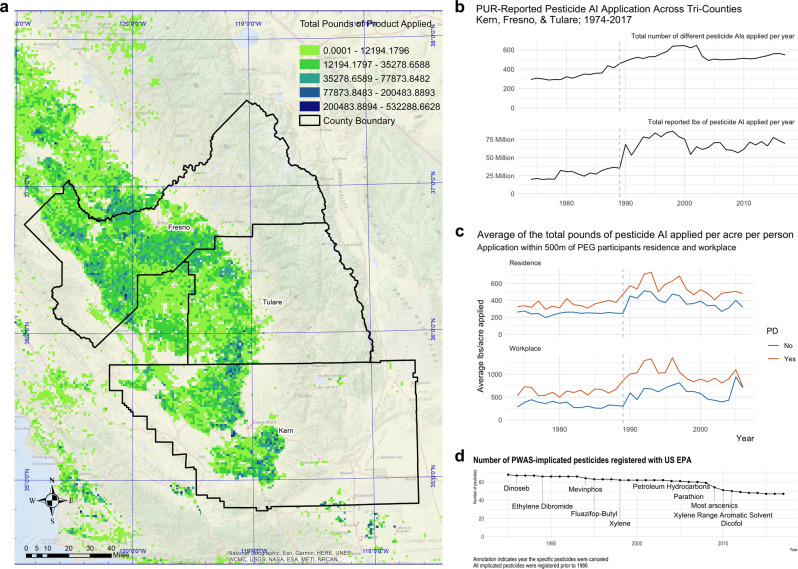
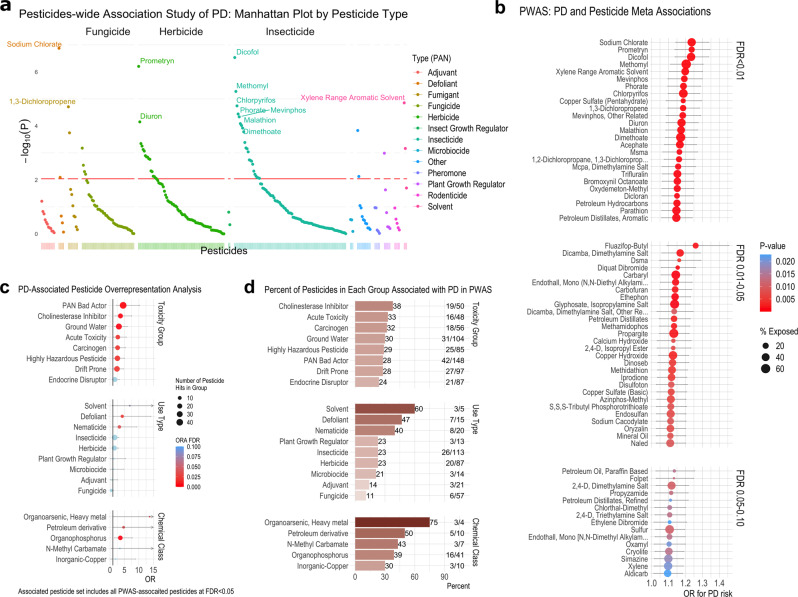
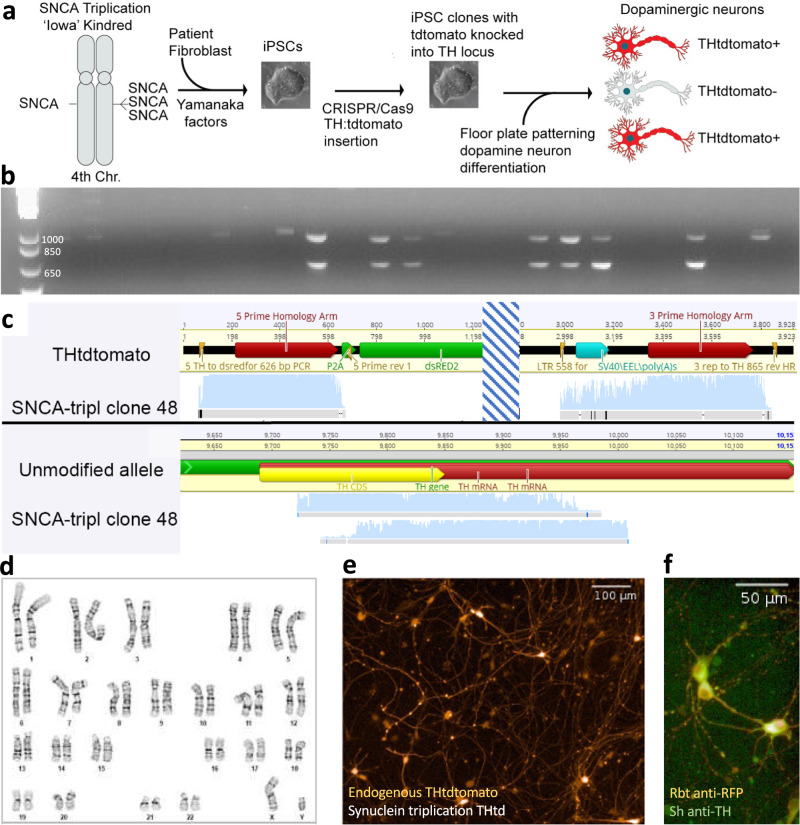
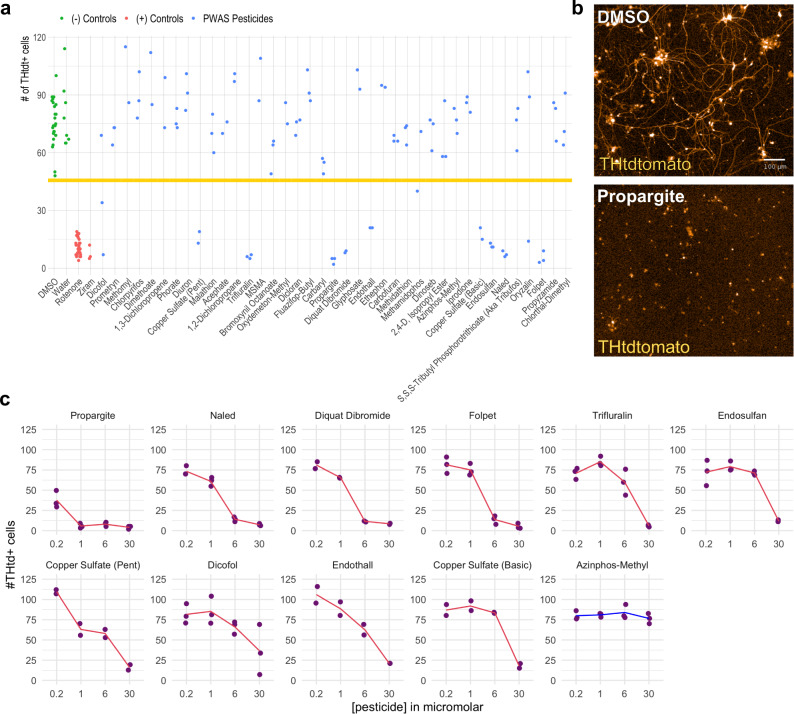
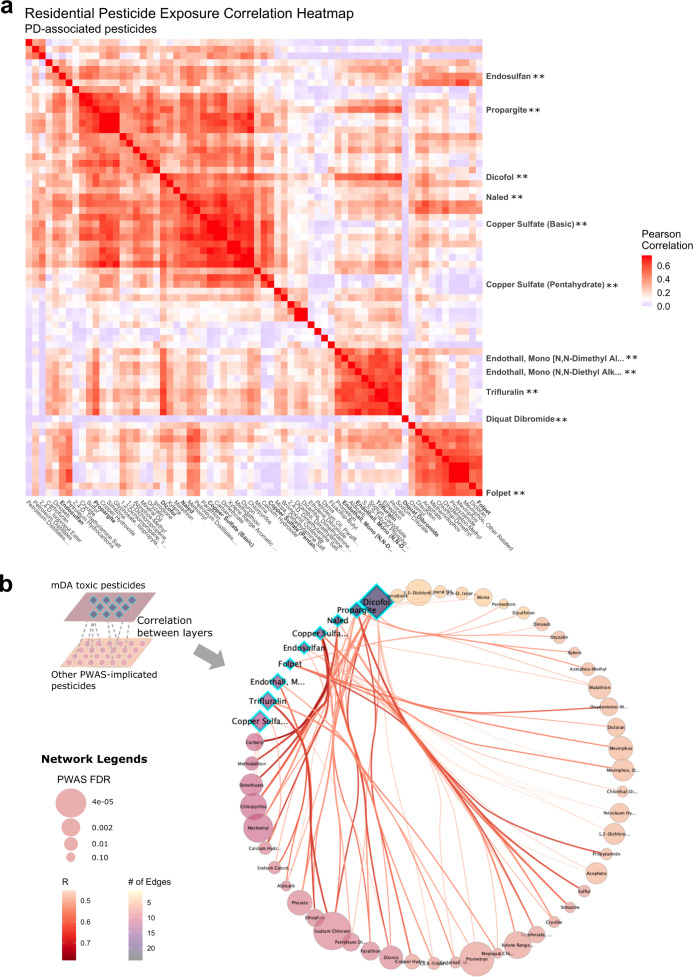
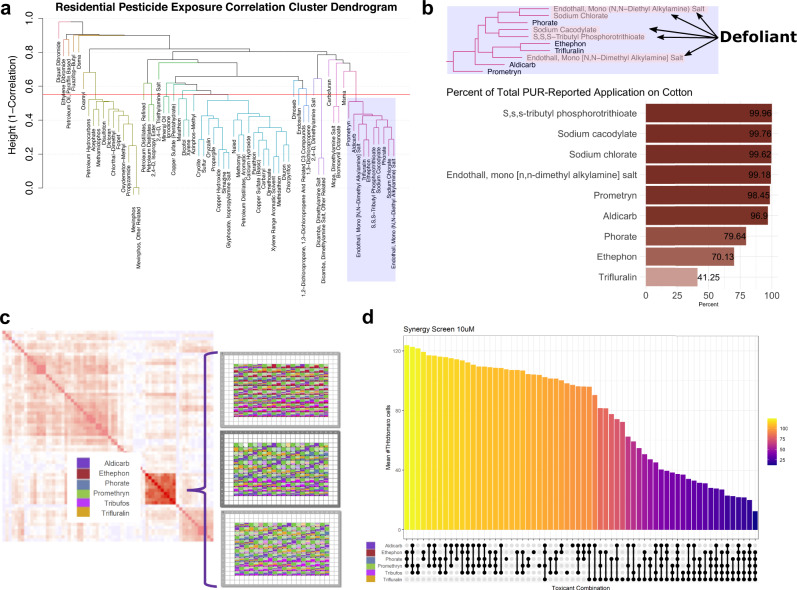
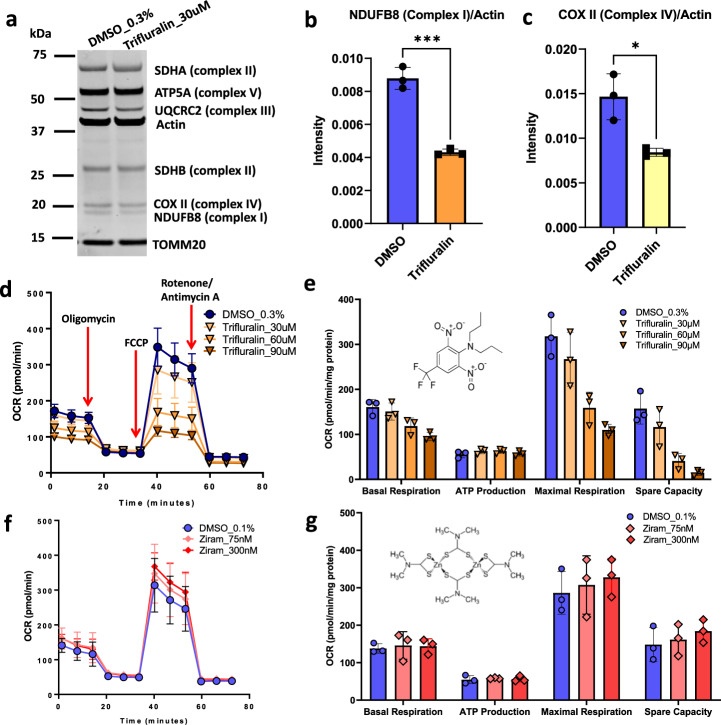
Parkinson's disease (PD) is a complex neurodegenerative disease with etiology rooted in genetic vulnerability and environmental factors. Here we combine quantitative epidemiologic study of pesticide exposures and PD with toxicity screening in dopaminergic neurons derived from PD patient induced pluripotent stem cells (iPSCs) to identify Parkinson's-relevant pesticides. Agricultural records enable investigation of 288 specific pesticides and PD risk in a comprehensive, pesticide-wide association study. We associate long-term exposure to 53 pesticides with PD and identify co-exposure profiles. We then employ a live-cell imaging screening paradigm exposing dopaminergic neurons to 39 PD-associated pesticides. We find that 10 pesticides are directly toxic to these neurons. Further, we analyze pesticides typically used in combinations in cotton farming, demonstrating that co-exposures result in greater toxicity than any single pesticide. We find trifluralin is a driver of toxicity to dopaminergic neurons and leads to mitochondrial dysfunction. Our paradigm may prove useful to mechanistically dissect pesticide exposures implicated in PD risk and guide agricultural policy.


Conflict of interest statement

L.L.R. is a founder of and a member of the Scientific Advisory Board of Vesalius Therapeutics, a private biotechnology company, and an owner of stock options. He is a member of the Scientific Advisory Board of Yumanity Therapeutics and a shareholder. Both companies study Parkinson’s disease. B.R., M.C., and R.C.K. have been retained as expert consultants for plaintiffs in a lawsuit on the role of paraquat in Parkinson’s disease causation. V.K. is a co-founder of and senior advisor to DaCapo Brainscience and Yumanity Therapeutics, companies focused on central nervous system diseases. The remaining authors declare no competing interests.

Figures

Fig. 1
Fig. 1. Description of agricultural pesticide use in the study area, including geography of applications, number of unique active ingredients applied by year, total pounds applied, and pesticide registration timeline.
a Geography of study region for PEG cohort and total pounds of pesticides applied in the region in 2000. Total pounds of pesticides applied shown by color scale. b The number of different PUR-reported pesticides applied per year across the three counties and the total reported pounds of pesticide applied per year across the three counties (1974–2017). c The average total reported pounds of pesticide applied per acre around PEG participants’ residential and workplace addresses per year from 1974–2006 (the mean index year), by PD status. Values above the 99th percentile were limited to the 99th percentile. d Timeline showing the number of PWAS-implicated pesticides that were registered with the US EPA by year. The annotation indicates the year the named pesticide had registration canceled or withdrawn. Source data are provided as a Source Data file.
Fig. 2
Fig. 2. Pesticide-Wide Association Study analysis associated specific pesticides with PD and overrepresentation analysis implicates groups of pesticides overrepresented in the associated pesticides.
a Manhattan plot detailing the -log(p-value) from the meta-analysis for all 288 pesticides tested for association with PD. We conducted univariate, unconditional logistic regression to calculate odds ratios (ORs) and 95% confidence intervals (CIs) for PD with each pesticide (n = 288). We combined the OR estimates from each study wave and location (residential and occupational addresses) in a fixed effects meta-analysis, results shown here. P-values were based on a z-score statistic and two-sided interval. P-values were adjusted for multiple testing using an FDR and are shown in Supplementary Data 3. The red horizontal line indicates the FDR = 0.05 cut-off. b Dot plot displaying the odds ratio (OR; dot) and 95% CI (error bars) from the meta-analysis described above for all pesticides with an FDR < 0.10. Analysis for Figs. 2a and 2b was based on n = 829 PD patients and n = 824 controls. The log odds ratio is the center of the 95% CI on the logarithmic scale. The log odds ratio and 95% CI on the logarithmic scale were exponentiated to get the odds ratio and 95% CI. c Results of overrepresentation analysis to test for overrepresentation of pesticide groups (toxicity groups, chemical classes, and use types) in the set of PWAS PD-associated pesticides relative to all pesticides we assessed. Odds ratios (dot) and 95% CIs (error bars) are displayed. The log odds ratio is the center of the 95% CI on the logarithmic scale. The log odds ratio and 95% CI on the logarithmic scale were exponentiated to get the odds ratio. Given the asymmetrical nature of the resulting odds ratio, the odds ratio is no longer the center of the 95% CI. The overrepresentation analysis was based on n = 286 pesticide associations. The associated pesticide set includes all associated pesticides at FDR < 0.05 (n = 53 pesticides). d Bar graph indicating the percent of pesticides in each group associated with PD in the PWAS. The graph also shows the total number of pesticides tested in the PWAS from each group (denominator) and the number of pesticides in each group associated with PD (numerator) on the right. This information is used for the overrepresentation analysis. For example, there were 50 cholinesterase inhibitor pesticides assessed for association with PD, 17% of all tested pesticides (50/286). In total, 19 cholinesterase inhibitors were associated with PD at FDR < 0.05 in the PWAS (19/50, 38%). Using an odds ratio and Fisher’s exact test, we found that the odds of being among the PD-associated pesticides was 3.6-fold higher for the cholinesterase inhibitors versus the non-cholinesterase inhibiting pesticides (OR = 3.62, 95% CI = 1.73. 7.50, FDR = 3.2e-03). Source data are provided as a Source Data file.
Fig. 3
Fig. 3. SNCA triplication THtdTomato reporter generation and quality control to facilitate purification and live-cell imaging of dopaminergic neurons.
a Schematic demonstrating iPSC source, generation, modification, and differentiation with tdTomato reporter permitting identification and isolation of dopaminergic neurons. Previously described iPSC line derived from a patient with Parkinson’s Disease caused by triplication of the SNCA locus resulting in four copies of the gene encoding α-synuclein. iPSC line was then modified with tyrosine hydroxylase:tdTomato reporter. Adapted from Hallaci et al. 2022. bf Quality control and validation of SNCA triplication THtdTomato reporter line including 5’ and 3’ PCR products to confirm proper insertion. b Agarose gel stained with ethidium bromide to demonstrate examples of seven clones that contain the expected PCR products (626 bp product confirmed proper insertion of the 5’ end of the reporter construct and an 878 bp product confirming proper insertion at the 3’ end). PCR reactions run separately but combined into the same wells of the agarose gel for each clone to visualize clones passing and failing PCR quality control. A subset of clones have a single larger band and these are excluded from further testing. Band length was reproduced in an additional PCR from clones showing proper size to evaluate by Sanger sequencing. c Sanger sequencing of PCR products in (b) confirming correct insertion of tdTomato cassette. d G-banded karyotype (performed by WiCell) confirms normal karyotype in modified clone. e Example of live imaging of endogenous THtdTomato fluorescence at 10x. Neurons with this live imaging morphology and appearance are consistently obtained from multiple differentiations (greater than ten) from this cell line. f Immunofluorescence co-localization of Rabbit (Rbt) anti-RFP and Sheep (Sh) anti-tyrosine hydroxylase visualized with Alexa Fluor 546 donkey anti-rabbit and Alexa Fluor 488 donkey anti-sheep, respectively. Colocalization of anti-RFP and anti-tyrosine hydroxylase staining reproduces in greater than three differentiations in the cell line used for these experiments. Source data are provided as a Source Data file.
Fig. 4
Fig. 4. PWAS pesticides are directly toxic to PD patient-derived mDA neurons in a live imaging screen.
a Scatter plot with the number of THtdTomato+ cells measured by live imaging analysis 11 days after the first treatment. DMSO controls (green data points) were present on each assay plate. Water control (green data points) was present on the assay plate containing primarily water-soluble pesticides. Rotenone (red data points) and ziram (red data points) were used as positive controls. Blue data points represent the different pesticides from the PWAS study. Horizontal line denotes three standard deviations below DMSO mean. b Upper image is a x10 magnification live image of a DMSO control well. Lower image is from a propargite treated well. Scale bar =  100 µM. More than five independent experiments repeated with DMSO and propargite treatment showed similar neuronal morphology with DMSO and similar extent of cell death and debris with propargite. c Four concentration dose curves of PWAS toxicants producing death in SNCA triplication THtdTomato sorted neurons. Cell numbers measured by high-content imaging of live cultures 11 days after first treatment. n = 1 with two technical replicates per water soluble pesticide and three technical replicates per DMSO and ethanol soluble pesticides per dose per pesticide for the screen dose curves. Red lines connect average cell number value for each pesticide concentration. Source data are provided as a Source Data file.
Fig. 5
Fig. 5. Pesticide exposure correlations demonstrate substantial interconnections of pesticides that produced significant mDA neuron death with many other pesticides.
a Correlation heatmap indicating the pairwise Pearson correlation coefficient for 68 PWAS-implicated pesticides (FDR < 0.10), using residential address-based exposures. The pesticides which produced significant mDA neuron death in the iPSC-model are highlighted on the y-axis. No pesticides were significantly negatively correlated. Thus, the blue color represents null (R = 0) correlation to dark red representing strong correlation (R > 0.75). All pesticide labels are shown on the x-axis, the y-axis only displays labels of select pesticides, with the ** indicating that the pesticides were toxic to mDA neurons. b Correlation wheel showing the pesticide exposure correlations across two layers: first, the set of mDA toxic pesticides, which are designated as teal highlighted diamonds, and second, the set of all other PWAS-implicated pesticides, shown as circles. Correlations between layers at R > 0.45 are shown in the circle, correlations within layers are not shown. The size of the shapes in the correlation circle (diamonds and circles) were determined by the PWAS FDR, thus pesticides that were more strongly associated with PD in the PWAS are represented by larger sized shapes. The color of the shapes reflects the density of the connections (i.e. correlations at R > 0.45) made by that specific pesticide with others. Pesticides with a darker color are correlated with more pesticides, and arrangement around the circle is ordered from those with the most correlations (dicofol, darkest color) to the least (petroleum hydrocarbons, lightest color). Dicofol, for example, resulted in significant mDA cell death in the iPSC-model and is therefore shown as a teal highlighted diamond. It was also both (1) the most statistically significant mDA toxic pesticide in the PD PWAS (FDR = 4.2e-05) and therefore shown as the largest diamond, and (2) correlated above R > 0.45 with the most other PWAS-implicated pesticides (n = 24 pesticides), and therefore shown as the darkest color. Note, pesticides that did not correlate across layer at R > 0.45 are not shown on the wheel. Diquat dibromide, for example, was mDA toxic, however, the strongest correlation diquat displays with another pesticides was R = 0.14. Source data are provided as a Source Data file.
Fig. 6
Fig. 6. Co-exposure of pesticides in the Cotton Cluster demonstrates evidence of synergistic toxicity.
a Cluster dendrogram from hierarchical clustering of the PWAS-pesticides using residential address-based exposures (clusters cut at height = 0.55), to identify groups of highly correlated pesticides for co-exposure analysis. b Cotton cluster: cluster identified as of interest, as it includes two of the three most significantly PD-associated pesticides in the PWAS based on FDR (sodium chlorate and prometryn) and half of the pesticides in the cluster have a use type of defoliant. The bar graph shows the proportion of all agricultural application records in the tri-county study area for each pesticide used on cotton, with the darker color representing larger proportions. For example, 99.96% of the reported S,S,S-tributyl phosphorotrithioate (aka tribufos) applications were on cotton. c Schematic outlining how pesticides from a single co-exposure cluster (cotton cluster) were recombined in all possible combinations of six pesticides using an HP Digital dispenser on sorted dopaminergic neurons plated into a 384 well format, similar to the survival assay described in Fig. 4. d An upset plot was used to sort and display the most toxic and least toxic combinations. Y-axis shows number of THtdTomato+ neurons at day 11 following treatment. Ball and stick connections along the X-axis indicate co-treatments with a ball indicating treatment with a given pesticide. Cooler (purple) colors represent lower relative cell counts while warmer (yellow) colors represent higher cell counts. DMSO control condition is depicted by the x-value lacking any ball and stick marker. N = 4 biological replicates. Source data are provided as a Source Data file.
Fig. 7
Fig. 7. Trifluralin alters mitochondrial subunit abundance and oxygen consumption rate.
Effect of Trifluralin in mitochondria subunit and effect of Trifluralin and Ziram in Mito-stress assays. a Western blot analysis of respiratory chain complexes for differentiated SNCA-triplication neurons at DIV 65, exposed to 0.3% DMSO and 30 µM Trifluralin for 24 h. Uncropped blots in Source Data. b Quantification of Complex I and c Complex IV from blot in a normalized to actin, (●) 0.3% DMSO and (◼) 30 µM Trifluralin. T-test for mitochondria subunit, p < 0.001 (***), p < 0.01 (*), n = 3 biologically independent replicates, d Measurement of Oxygen Consumption Rate curves on Mito-stress assay for the dose-response effect of (●) DMSO 0.3% and (▼) Trifluralin (30 µM, 60 µM and 90 µM) on SNCA-triplication differentiated neurons at DIV 65 and after 6hrs exposure. e Metabolic parameters (Basal respiration, ATP production, maximal respiration and spare respiratory capacity) calculated from d. 2-way ANOVA for Mito-stress assays, p < 0.0001 (****); Dunnett’s multiple comparisons test p < 0.0001 for DMSO vs. 60 µM and DMSO vs. 90 µM Trifluralin. DMSO vs. 90 µM Trifluralin not significant, p = 0.099. f Oxygen Consumption Rate curves on Mito-stress assay (●) 0.1 % DMSO and (♦) 75 nM and 300 nM Ziram exposure on SNCA-triplication differentiated neurons for 6 h. g Metabolic parameters for the conditions described in f. There were no significant differences among treatment conditions with Ziram (p = 0.4326). Errors bars represent standard deviation, n = 3 biologically independent replicates for 7d–7g. Source data are provided as a Source Data file.

References

    1. Ascherio A, Schwarzschild MA. The epidemiology of Parkinson’s disease: risk factors and prevention. Lancet Neurol. 2016;15:1257–1272. - PubMed
    1. Goldman SM, Musgrove RE, Jewell SA, Di Monte DA. Chapter Three - Pesticides and Parkinson’s Disease: Current Experimental and Epidemiological Evidence. In: Advances in Neurotoxicology (eds Aschner M, Costa LG). Academic Press (2017).
    1. California Department of Pesticide Regulation. Actively Registered Active Ingredients (AI) by Common Name.).
    1. Liu C, et al. A Scientometric Analysis and Visualization of Research on Parkinson’s Disease Associated With Pesticide Exposure. Front Pub. Health. 2020;8:91. - PMC - PubMed
    1. Minakaki G, Krainc D, Burbulla LF. The Convergence of Alpha-Synuclein, Mitochondrial, and Lysosomal Pathways in Vulnerability of Midbrain Dopaminergic Neurons in Parkinson’s Disease. Front. Cell Dev. Biol. 2020;8:580634. - PMC - PubMed

Publication types