. 2023 May 16;14(1):2241.
doi: 10.1038/s41467-023-37714-3.

Identification of indocyanine green as a STT3B inhibitor against mushroom α-amanitin cytotoxicity

Affiliations

Identification of indocyanine green as a STT3B inhibitor against mushroom α-amanitin cytotoxicity

Bei Wang et al. Nat Commun. .

Abstract

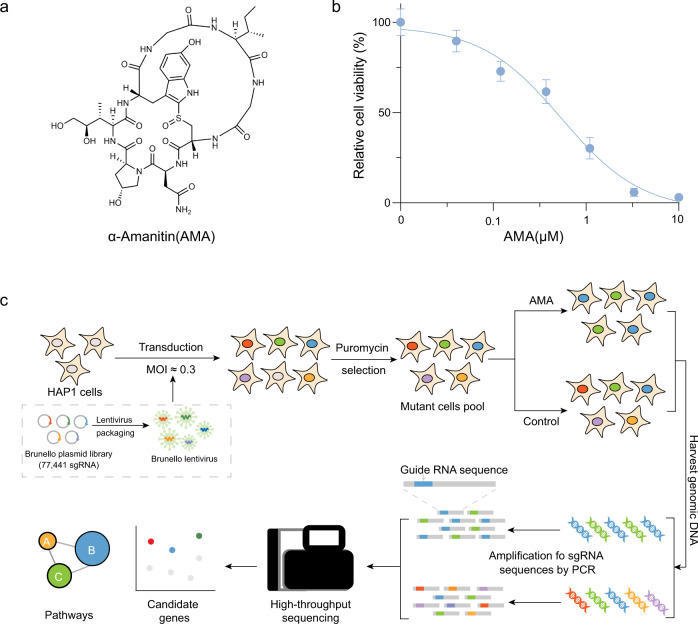
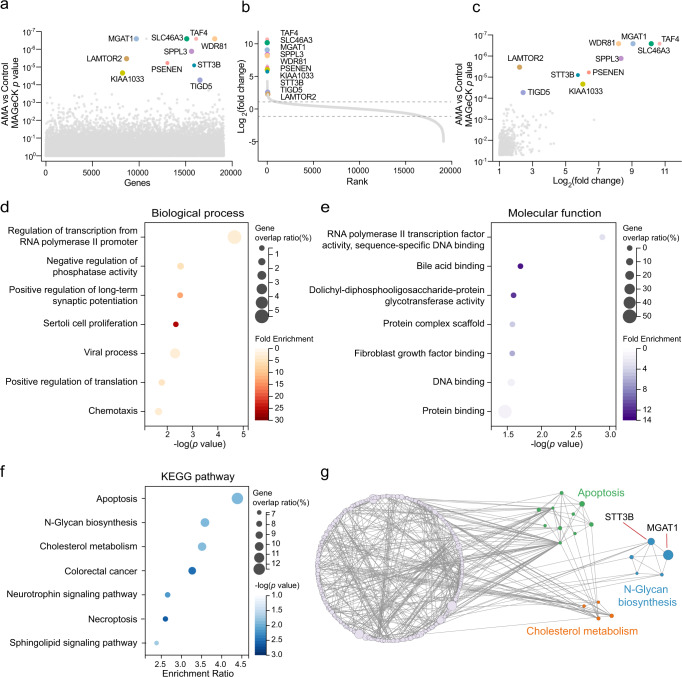
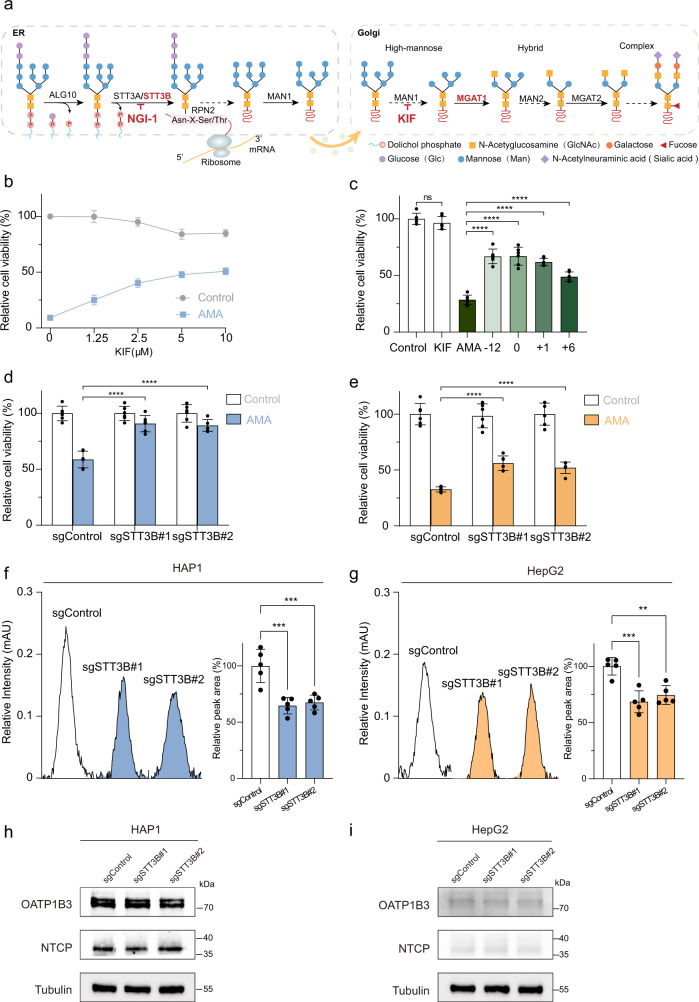
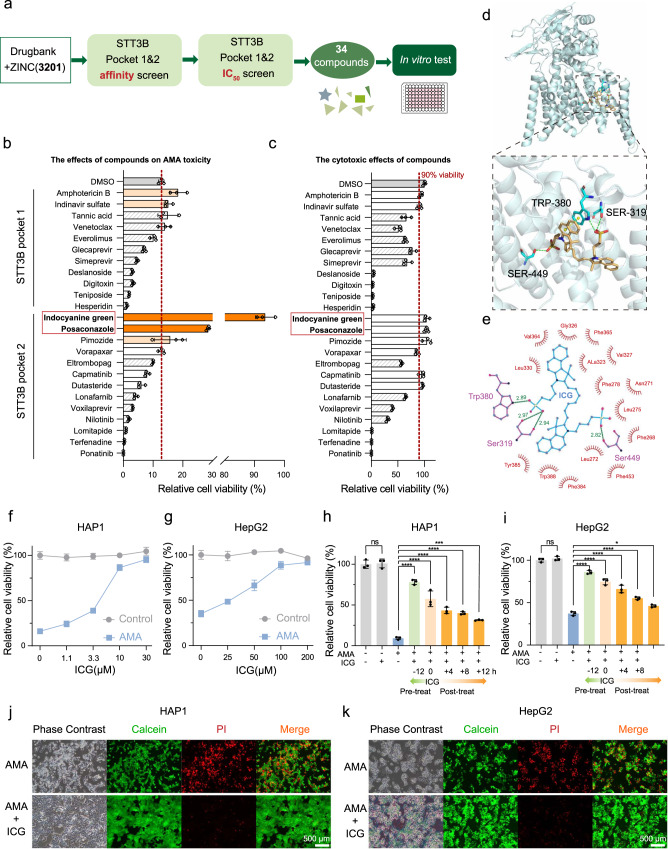
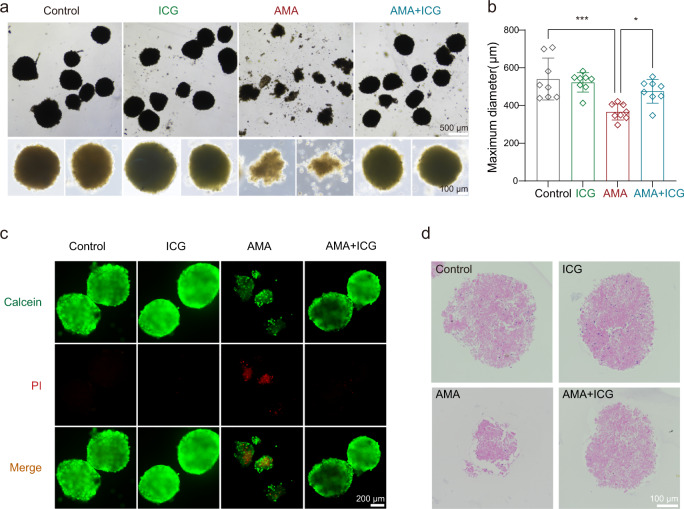
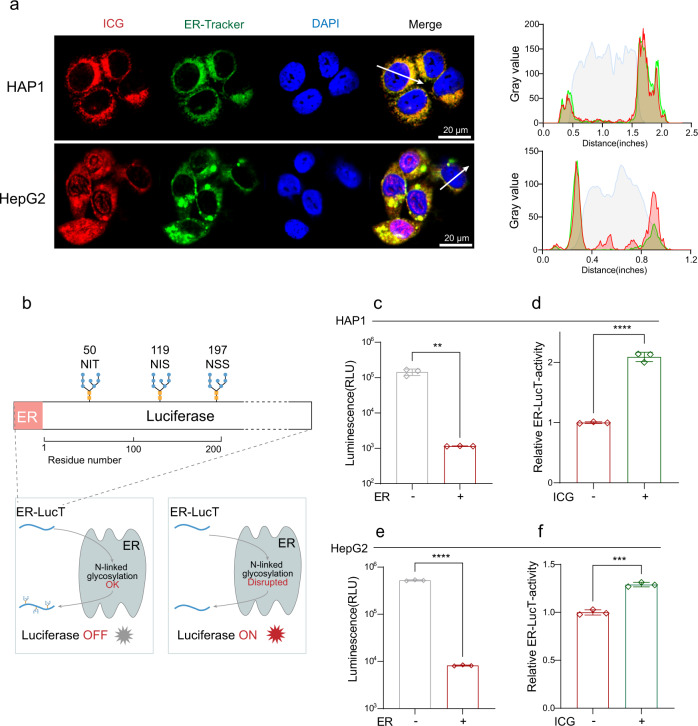
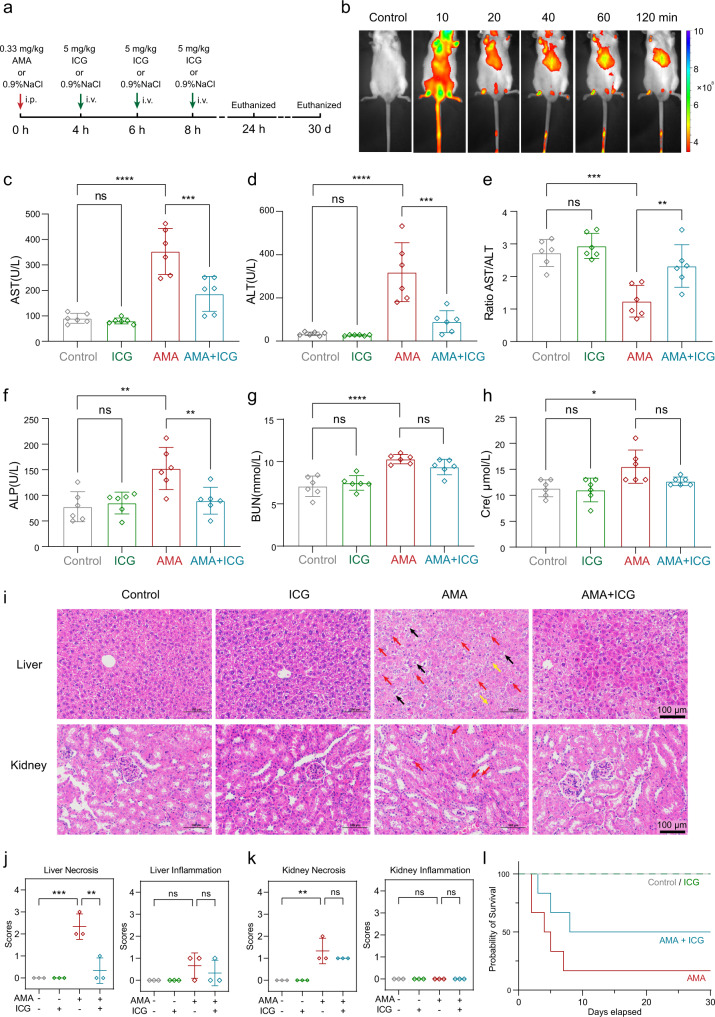
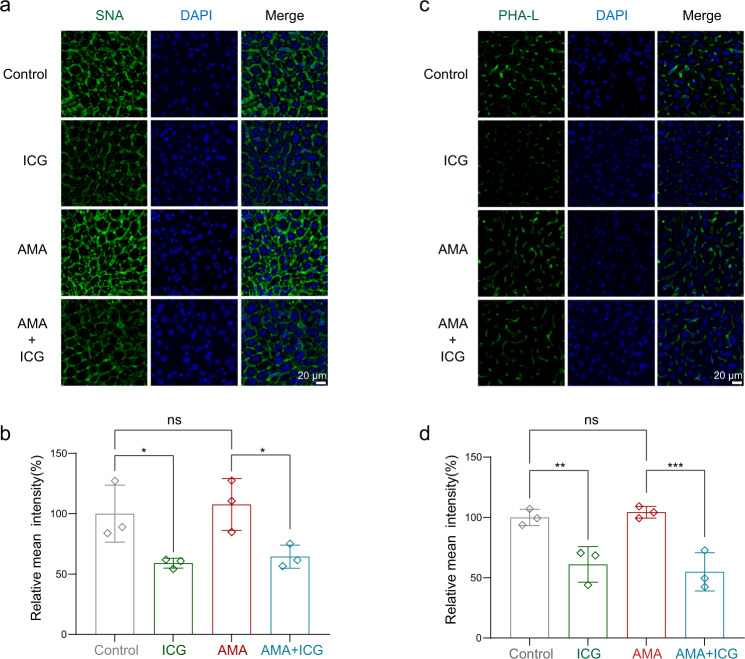
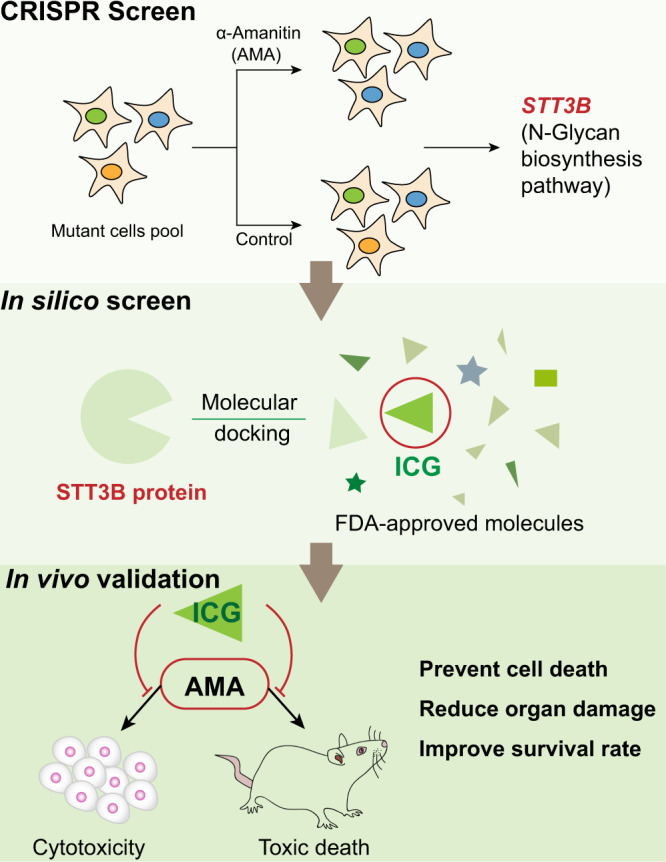
The "death cap", Amanita phalloides, is the world's most poisonous mushroom, responsible for 90% of mushroom-related fatalities. The most fatal component of the death cap is α-amanitin. Despite its lethal effect, the exact mechanisms of how α-amanitin poisons humans remain unclear, leading to no specific antidote available for treatment. Here we show that STT3B is required for α-amanitin toxicity and its inhibitor, indocyanine green (ICG), can be used as a specific antidote. By combining a genome-wide CRISPR screen with an in silico drug screening and in vivo functional validation, we discover that N-glycan biosynthesis pathway and its key component, STT3B, play a crucial role in α-amanitin toxicity and that ICG is a STT3B inhibitor. Furthermore, we demonstrate that ICG is effective in blocking the toxic effect of α-amanitin in cells, liver organoids, and male mice, resulting in an overall increase in animal survival. Together, by combining a genome-wide CRISPR screen for α-amanitin toxicity with an in silico drug screen and functional validation in vivo, our study highlights ICG as a STT3B inhibitor against the mushroom toxin.


Conflict of interest statement

The authors declare no competing interests.

Figures

Fig. 1
Fig. 1. A workflow of a genome-wide CRISPR-Cas9 knockout screen for AMA toxicity.
a Chemical structure of AMA. b HAP1 cells were treated with vehicle or different concentrations of AMA for 72 h, and cell viability was determined by CCK8 assays (n = 3 biological replicates). Data are presented as mean ± SD and are representative of three independent experiments. c The workflow of genome-wide CRISPR loss-of-function screening. Source data are provided as a Source Data file.
Fig. 2
Fig. 2. The CRISPR screen identifies genes and pathways required for AMA toxicity.
a Bubble plot of p value from AMA screen. b Distribution of Log2 fold change (LFC, AMA treatment versus control) for each gene. c The p value and LFC of significant 559 genes. The top 10 genes were highlighted and marked. d, e GO terms enrichment analysis of these significant hits for biological process d and molecular function e. f KEGG pathway analysis of these significant hits. g Genetic interaction network of the significant 559 genes. The node size represents the -Lg (RRA score). Source data are provided as a Source Data file.
Fig. 3
Fig. 3. N-Glycan biosynthesis is essential for AMA-induced cell death.
a A simplified overview of N-glycan biosynthesis. b KIF blocked AMA toxicity. HAP1 cells were pre-treated with KIF for 12 h and then treated with AMA (3 μM) for 48 h (n = 3 biological replicates). c Both pre-treatment and post-treatment with KIF protect HAP1 cells against AMA (3 μM) (n = 6 biological replicates). nsp = 0.9117, ****p < 0.0001. The statistics were assessed using one-way ANOVA followed by Tukey’s multiple comparisons test. d, e Depletion of STT3B conferring resistance to AMA in HAP1 d and HepG2 e cells (n = 6 biological replicates). ****p < 0.0001. The statistics were assessed using one-way ANOVA followed by Dunnett’s multiple comparisons test. f, g The detection of AMA entrance into cells. The representative peak and relative peak area (n = 5 biological replicates) of AMA in different sgRNA STT3B knockout HAP1 f, and HepG2 g cells. ***p = 0.0003, ***p = 0.0006; ***p = 0.0002, **p = 0.0010. The statistics were assessed using one-way ANOVA followed by Dunnett’s multiple comparisons test. h, i The expression of OATP1B3 and NTCP in different sgRNA STT3B knockout HAP1 h and HepG2 i cells. Data are presented as mean ± S.D.  and are representative of three independent experiments. Source data are provided as a Source Data file.
Fig. 4
Fig. 4. In silico screen of FDA-approved molecules for STT3B inhibitor.
a Schematic design of in silico screen to identify STT3B inhibitors. Minimized affinity screen and NNScore2 screen were subsequently performed. b Relative cell viability of HAP1 cells pretreated for 12 h with the indicated small molecule inhibitors at 10 μM and then treated with 3 μM AMA (n = 3 biological replicates). c Relative cell viability of HAP1 cells treated with the indicated small molecule inhibitors at 10 μM for 60 h (n = 3 biological replicates). d 3D Overview and close-up views of binding sites of STT3B and ICG (generated by PyMOL). ICG is shown in light orange. STT3B residues interacting with ICG are shown in cyan. Hydrogen bonds are shown in dashed green lines, and pi-pi stacking is shown in dashed yellow lines. e 2D STT3B-ICG interaction diagrams (generated by LigPlot + ). ICG is shown in blue, hydrogen-bonding residues are shown in purple, and hydrogen bonds are shown in green dotted lines, the spoked arcs represent residues making nonbonded contacts with ICG. f, g The pretreatment of ICG reduces AMA-induced cell death. Cells were pre-treated with ICG for 12 h and then treated with AMA (3 μM for HAP1 and 5 μM for HepG2) for 48 h (n = 3 biological replicates). h, i The pre-treatment and post-treatment of ICG (10 μM for HAP1 and 100 μM for HepG2) protected HAP1 (3 μM) and HepG2 (5 μM) cells from AMA-induced cell death (n = 3 biological replicates). nsp > 0.9999, ****p < 0.0001, ***p = 0.0007; nsp = 0.9840, ****p < 0.0001, *p = 0.0181. The statistics were assessed using one-way ANOVA followed by Tukey’s multiple comparisons test. j, k Calcein/PI viability assay of HAP1 cells and HepG2 cells pretreated with ICG for 12 h and then treated with AMA at 3 μM for HAP1 cells j and at 5 μM for HepG2 cells k. Scale bars are 500 μm. Data are presented as mean ± SD.  and are representative of three independent experiments. Source data are provided as a Source Data file.
Fig. 5
Fig. 5. ICG alleviates AMA toxicity in mice liver organoids.
The Organoids were treated with AMA (3 μM) and/or ICG (10 μM) for 3 days. a Representative images of mouse liver organoids. b Maximum diameter of organoids (n = 8 randomly selected organoids in each figure). ***p = 0.0002, *p = 0.0248. The statistics were assessed using one-way ANOVA followed by Tukey’s multiple comparisons test. c Calcein/PI viability assay of organoids. d Representative H&E images of organoids. Data are presented as mean ± SD.  and are representative of three independent experiments. Source data are provided as a Source Data file.
Fig. 6
Fig. 6. ICG prevents cells from AMA-induced cell death by inhibiting STT3B activity.
a Intracellular co-localization of ICG and ER in HAP1 and HepG2 cells and the corresponding fluorescence intensity profiles across the cell along the direction of arrow. b A scheme of ER-LucT reporter system, the disruption of luciferase glycosylation turn on luminescence. Luc, luciferase. c N-glycosylation of Luc reduced the Luc activity in HAP1 cells (n = 3 biological replicates). **p = 0.0012 d The blockage of N-glycosylation of Luc increased the Luc activity by treatment with 10 μM ICG. The ER-LucT-activity was normalized to the vehicle control (n = 3 biological replicates). ****p < 0.0001. e N-glycosylation of Luc reduced the Luc activity in HAP1 cells (n = 3 biological replicates). ****p < 0.0001. f The blockage of N-glycosylation of Luc increased the Luc activity by treatment with 100 μM ICG HepG2. The ER-LucT-activity was normalized to the vehicle control (n = 3 biological replicates). ***p = 0.0001. Data are presented as mean ± SD and are representative of three independent experiments. The statistics were all assessed using two-tailed unpaired t test. Source data are provided as a Source Data file.
Fig. 7
Fig. 7. ICG is an effective antidote for AMA toxicity in mice.
a The scheme of the mouse study. AMA was i.p. injection at 0.33 mg/kg and ICG intravenously injected at 4 h, 6 h and 8 h with a dose of 5 mg/kg. The mice were euthanized at 24 h and 30th day. b NIR fluorescence images of mice at different time points after intravenous injection of ICG. ch Plasma levels of AST, ALT, the ratio of AST/ALT, ALP, BUN, Cre in different groups (n  =  6 biological replicates). c nsp = 0.9889, ****p < 0.0001, ***p = 0.0004; d nsp = 0.9986, ****p < 0.0001, ***p = 0.0001; e nsp = 0.8764, ***p = 0.0002, **p = 0.0060; f nsp = 0.9748, ***p = 0.0020, **p = 0.0091; g nsp = 0.8776, ****p < 0.0001, nsp = 0.3169; h nsp = 0.8776, *p = 0.0163, nsp = 0.3169. i H&E staining of liver and kidney of mice in different treatments. Cellular edema (black arrow), inflammatory cells (yellow arrow), and necrosis (red arrow) were shown. Scale bars are 100 μm. j, k Pathological score of liver and kidney in different treatments (n = 3 biological replicates). j ***p = 0.0005, **p = 0.0015; nsp = 0.2641, nsp = 0.7538; k **p = 0.0021, nsp = 0.5252; the samples all have a standard error of zero. l Survival curves of mice with different treatments (n = 6 biological replicates). Data are presented as mean ± SD. The statistics were assessed using one-way ANOVA followed by Tukey’s multiple comparisons test. Source data are provided as a Source Data file.
Fig. 8
Fig. 8. ICG disrupts glycation in livers in vivo.
The lectin staining assay was used to analyze the glycation of liver sections. The mice were administrated with AMA at 0 h and three consecutive administrations of ICG were injected at 4 h, 6 h, 8 h, and all mice were euthanized at 24 h. The liver sections were stained with SNA for sialylated glycans and PHA-L for complex glycans. a, b Representative images of SNA binding to complex glycans a and semiquantitative evaluation for SNA b by Image J (n = 3 biological replicates). *p = 0.0174, nsp = 0.5946, *p = 0.0136. c, d Representative images of sialylated glycans stained by PHA-L c and semiquantitative evaluation d by Image J (n = 3 biological replicates). **p = 0.0033, nsp = 0.6628, ***p = 0.0008. Data are presented as mean ± SD. The statistics were assessed using a one-way ANOVA test. Source data are provided as a Source Data file.
Fig. 9
Fig. 9. Identification of ICG as a STT3B inhibitor against mushroom AMA cytotoxicity.
A genome-wide CRISPR screen against mushroom AMA cytotoxicity has identified STT3B, a key enzyme in the N-glycan biosynthesis pathway, as a druggable target for preventing AMA-induced cell death. After an in silico drug screen with an FDA-approved library, ICG was identified as a specific inhibitor for STT3B. Eventually, ICG could effectively block AMA cytotoxicity in vitro and in vivo.

References

    1. Sun J, et al. Investigating and analyzing three cohorts of mushroom poisoning caused by Amanita exitialis in Yunnan, China. Hum. Exp. Toxicol. 2018;37:665–678. doi: 10.1177/0960327117721960. - DOI - PubMed
    1. Govorushko S, et al. Poisoning associated with the use of mushrooms: a review of the global pattern and main characteristics. Food Chem. Toxicol. 2019;128:267–279. doi: 10.1016/j.fct.2019.04.016. - DOI - PubMed
    1. Li W, et al. Mushroom poisoning outbreaks China, 2010–2020. China CDC Wkly. 2021;3:518–522. doi: 10.46234/ccdcw2021.134. - DOI - PMC - PubMed
    1. Zuker-Herman R, Tong R, Wong A. Intravenous rifampicin use in the management of amanita phalloides toxicity. Clin. Toxicol. 2021;59:843–845. doi: 10.1080/15563650.2021.1887492. - DOI - PubMed
    1. Garcia J, et al. A breakthrough on Amanita phalloides poisoning: an effective antidotal effect by polymyxin B. Arch. Toxicol. 2015;89:2305–2323. doi: 10.1007/s00204-015-1582-x. - DOI - PubMed

Publication types