. 2023 May 16;14(1):2800.
doi: 10.1038/s41467-023-38435-3.

Virological characteristics of the SARS-CoV-2 XBB variant derived from recombination of two Omicron subvariants

Collaborators, Affiliations

Virological characteristics of the SARS-CoV-2 XBB variant derived from recombination of two Omicron subvariants

Tomokazu Tamura et al. Nat Commun. .

Abstract

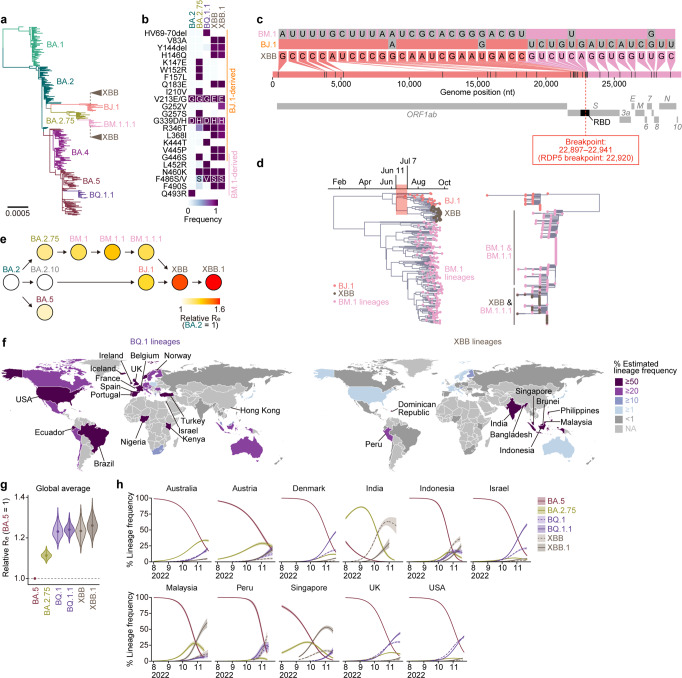
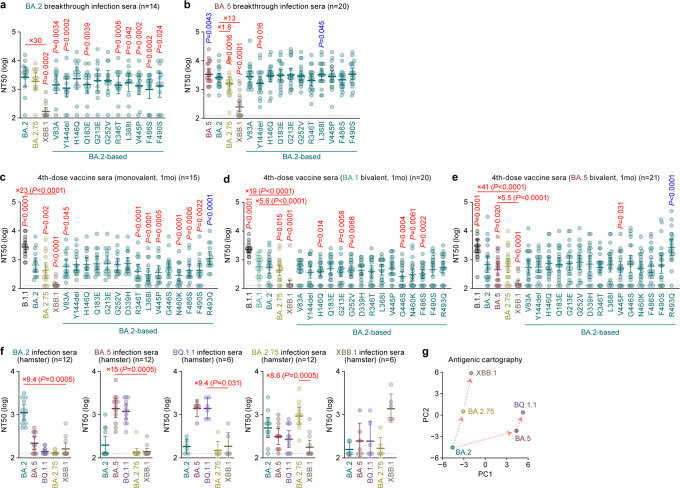
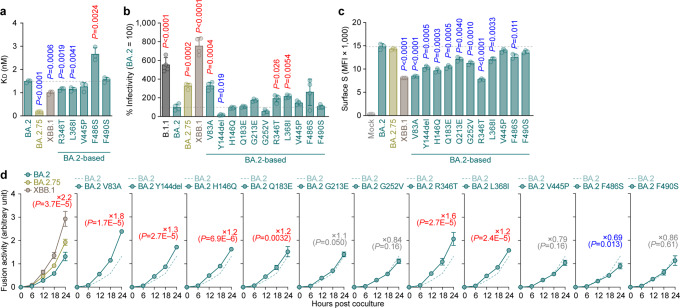
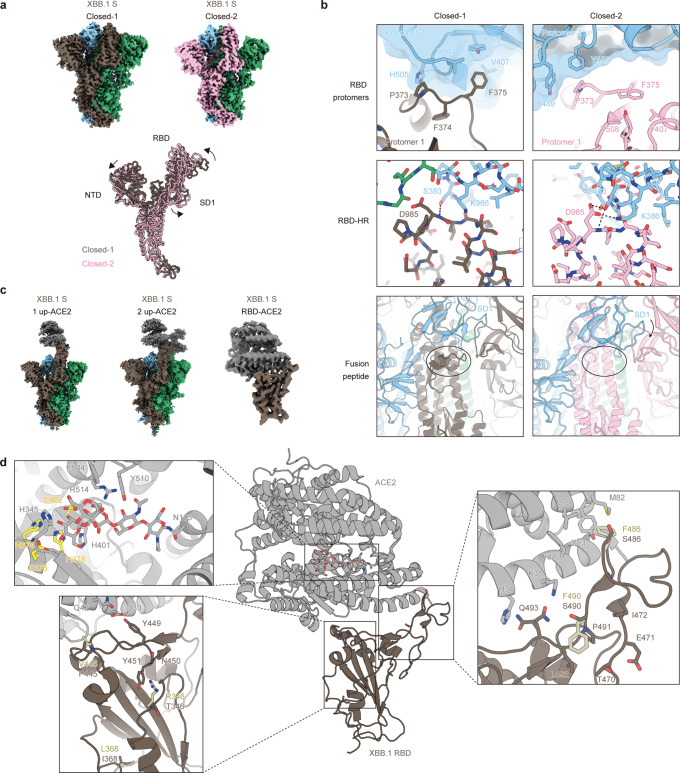
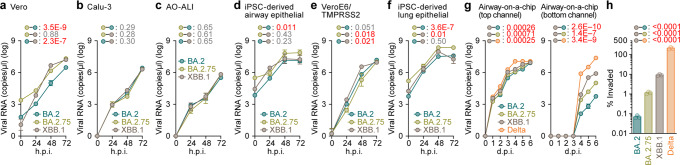
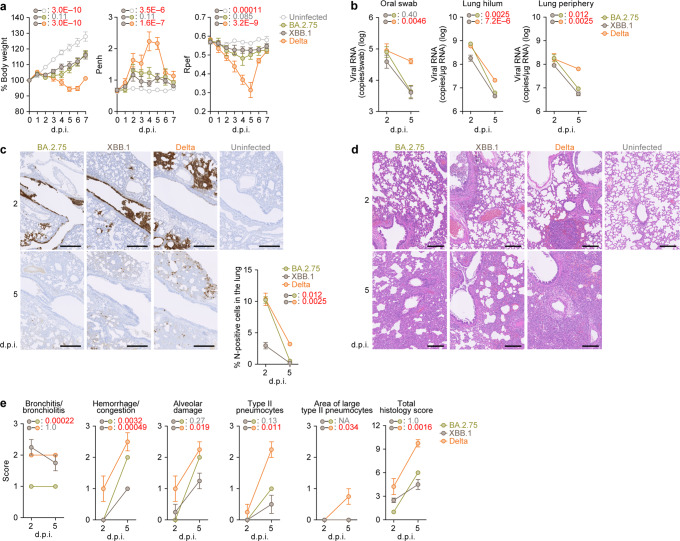
In late 2022, SARS-CoV-2 Omicron subvariants have become highly diversified, and XBB is spreading rapidly around the world. Our phylogenetic analyses suggested that XBB emerged through the recombination of two cocirculating BA.2 lineages, BJ.1 and BM.1.1.1 (a progeny of BA.2.75), during the summer of 2022. XBB.1 is the variant most profoundly resistant to BA.2/5 breakthrough infection sera to date and is more fusogenic than BA.2.75. The recombination breakpoint is located in the receptor-binding domain of spike, and each region of the recombinant spike confers immune evasion and increases fusogenicity. We further provide the structural basis for the interaction between XBB.1 spike and human ACE2. Finally, the intrinsic pathogenicity of XBB.1 in male hamsters is comparable to or even lower than that of BA.2.75. Our multiscale investigation provides evidence suggesting that XBB is the first observed SARS-CoV-2 variant to increase its fitness through recombination rather than substitutions.


Conflict of interest statement

Y.Y. and T.N. are founders and shareholders of HiLung, Inc. Y.Y. is a co-inventor of patents (PCT/JP2016/057254; “Method for inducing differentiation of alveolar epithelial cells”, PCT/JP2016/059786, “Method of producing airway epithelial cells”). The other authors declare that no competing interests exist.

Figures

Fig. 1
Fig. 1. Phylogenetic and epidemic analyses of the XBB lineage.
a Muximum likelihood tree of representative sequences from PANGO lineages of interest: BA.1, BA.2, BA.4, BA.5, BA.2.75, BJ.1 and BM.1.1.1, rooted on a B.1.1 outgroup (not shown). The recombinant parents of XBB are annotated on the tree as cartoon clades. b Amino acid differences in the S proteins of Omicron lineages. c Nucleotide differences between the consensus sequences of the BJ.1, BM.1 (including BM.1.1/BM.1.1.1) lineages and the XBB (including XBB.1) lineage, visualized with snipit (https://github.com/aineniamh/snipit). d Maximum clade credibility time-calibrated phylogeny of the 5ʹ non-recombinant segment (1–22,920) of the XBB variant (left) and non-calibrated maximum likelihood phylogeny of the 3ʹ non-recombinant segment (22,920–29,903) (right). The right hand-side tree is rooted on a BA.2 outgroup (not shown). e Relative effective reproduction number (Re) values for viral lineages in India, assuming a fixed generation time of 2.1 days. The Re of BA.2 is set at 1. Dot color indicates the posterior mean of the Re, and an arrow indicate phylogenetic relationship. See also Supplementary Fig. 1b. f Difference in the circulated regions between BQ.1 and XBB lineages. Estimated lineage frequency as of November 15th, 2022 in each country is shown. Countries with ≥50% and ≥20% frequencies are annotated for the BQ.1 and XBB lineages, respectively. g Relative Re values for viral lineages, assuming a fixed generation time of 2.1 days. The Re value of BA.5 is set at 1. The posterior (violin), posterior mean (dot), and 95% Bayesian confidential interval (CI; line) are shown. The global average values estimated by a hierarchical Bayesian model are shown. See also Supplementary Fig. 1c. h Estimated lineage dynamics in each country where BQ.1 and XBB lineages cocirculated. Posterior mean, line; 95% CI, ribbon. Source data are provided with this paper.
Fig. 2
Fig. 2. Immune resistance of XBB.1.
Neutralization assays were performed with pseudoviruses harboring the spike (S) proteins of B.1.1, BA.1, BA.2, BA.5, BQ.1.1, BA.2.75 and XBB.1. The BA.2 S-based derivatives are included in (a–e). The following sera were used. Convalescent sera from fully vaccinated individuals who had been infected with BA.2 after full vaccination (9 2-dose vaccinated and 5 3-dose vaccinated. 14 donors in total) (a), and BA.5 after full vaccination (2 2-dose vaccinated donors, 17 3-dose vaccinated donors and 1 4-dose vaccinated donors. 20 donors in total) (b). 4-dose vaccine sera collected at 1 month after the 4-dose monovalent vaccine (15 donors) (c), BA.1 bivalent vaccine (20 donors) (d), and BA.5 bivalent vaccine (21 donors) (e). f Sera from hamsters infected with BA.2 (12 hamsters), BA.5 (12 hamsters), BQ.1.1 (6 hamsters), BA.2.75 (12 hamsters), and XBB.1 (6 hamsters). g Antigenic cartography based on the results of neutralization assays using hamster sera (Fig. 2f). Assays for each serum sample were performed in triplicate to determine the 50% neutralization titer (NT50). Each dot represents one NT50 value, and the geometric mean and 95% confidential interval (CI) are shown. Statistically significant differences were determined by two-sided Wilcoxon signed-rank tests. The P values versus BA.2 (a), BA.5 (b), or XBB.1 (c–f) are indicated in the panels. For the BA.2 derivatives (a–e), statistically significant differences (P < 0.05) versus BA.2 are indicated with asterisks. Red and blue asterisks, respectively, indicate decreased and increased NT50s. The horizontal dashed line indicates the detection limit (120-fold). Information on the convalescent donors is summarized in Supplementary Table 5. Source data are provided with this paper.
Fig. 3
Fig. 3. Virological characteristics of XBB.1 in vitro.
a Binding affinity of the receptor binding domain (RBD) of SARS-CoV-2 spike (S) protein to angiotensin-converting enzyme 2 (ACE2) by yeast surface display. The dissociation constant (KD) value indicating the binding affinity of the RBD of the SARS-CoV-2 S protein to soluble ACE2 when expressed on yeast is shown. b Pseudovirus assay. HOS-ACE2/TMPRSS2 cells were infected with pseudoviruses bearing each S protein. The amount of input virus was normalized based on the amount of HIV-1 p24 capsid protein. The percent infectivity compared to that of the virus pseudotyped with the BA.2 S protein are shown. c, d, S-based fusion assay. c S protein expression on the cell surface. The summarized data are shown. d S-based fusion assay in Calu-3 cells. The recorded fusion activity (arbitrary units) is shown. The dashed green line indicates the result of BA.2. The red number in each panel indicates the fold difference between BA.2 and the derivative tested (XBB.1 in the top left panel) at 24 h post coculture. Assays were performed in triplicate (a, c) or quadruplicate (b, d). The presented data are expressed as the average ± standard deviation (SD). In (a–c), each dot indicates the result of an individual replicate. In (a–d), the dashed horizontal lines indicate the value of BA.2. In (a–c), statistically significant differences (*P < 0.05) versus BA.2 were determined by two-sided Student’s t tests. Red and blue asterisks, respectively, indicate increased and decreased values. In (d), statistically significant differences versus BA.2.75 across timepoints were determined by multiple regression. The familywise error rates (FWERs) calculated using the Holm method are indicated in the figures. Source data are provided with this paper.
Fig. 4
Fig. 4. Overall cryo-EM structure of XBB.1 S and ACE2.
a (Top) Cryo-EM maps of XBB.1 spike (S) protein trimer closed-1 state (left) and closed-2 state (right). Each protomer is colored brown, blue, green (closed-1) or pink, blue, green (closed-2). (Bottom) Superimposed structures of XBB.1 S protomers between closed-1 state (brown) and closed-2 state (pink). b Close-up and corresponding views of the closed-1 and closed-2 structures (same colors as m). (Top) A loop containing F375 at the protomer interface in the receptor binding domain (RBD) region. Each adjacent protomer is shown with the surface model (transparent, blue). (Middle) Interfaces between RBD and heptad repeat-1 (HR-1). Dashed lines represent hydrogen bonds. (Bottom) Structural difference around fusion peptides (shown in cartoon) surrounded by a circle. c Cryo-EM maps of XBB.1 S protein (same colors as m) bound to angiotensin-converting enzyme 2 (ACE2) (gray) in one-up state (left), two-up state (middle), or RBD-ACE2 interface (right). d Structure of RBD-ACE2 complex (same colors as o). In close-up views, corresponding five residues in the BA.2.75 RBD-ACE2 complex structure (PDB: 8ASY) different from that of XBB.1 (brown stick) are shown in pastel yellow sticks. Residues interacting with these five amino acid residues in the XBB.1 or the BA.2.75 RBD, as well as residues recognizing the N103-linked glycan of ACE2, are represented by stick models. Residues of the HEXXH motif in the active site of ACE2 are highlighted in yellow.
Fig. 5
Fig. 5. Growth kinetics of XBB.1.
Clinical isolates of BA.2, BA.2.75, XBB.1 and Delta (only in g, h) were inoculated into Vero cells (a), Calu-3 cells (b), the human airway organoid-derived air-liquid interface (AO-ALI) system (c), human induced pluripotent stem cell (iPSC)-derived airway epithelial cells (d), VeroE6/TMPRSS2 cells (e), iPSC-derived lung epithelial cells (f) and an airway-on-a-chip system (g). The copy numbers of viral RNA in the culture supernatant (a, b, e), the apical sides of cultures (c, d, f), and the top (g, left) and bottom (g, right) channels of an airway-on-a-chip were routinely quantified by RT–qPCR. In (h), the percentage of viral RNA load in the bottom channel per top channel at 6 days post-infection (d.p.i.) (i.e., % invaded virus from the top channel to the bottom channel) is shown. Assays were performed in triplicate (g, h) or quadruplicate (a–f). The presented data are expressed as the average ± standard error of mean (SEM). In (h), each dot indicates the result of an individual replicate. In (d–k), statistically significant differences across timepoints were determined by multiple regression. In (h), statistically significant differences versus XBB.1 were determined by two-sided Student’s t tests. The familywise error rates (FWERs) calculated using the Holm method (a–g) or P values (h) are indicated in the figures. Source data are provided with this paper.
Fig. 6
Fig. 6. Virological characteristics of XBB.1 in vivo.
Syrian hamsters were intranasally inoculated with BA.2.75, XBB.1 and Delta. Six hamsters of the same age were intranasally inoculated with saline (uninfected). Six hamsters per group were used to routinely measure the respective parameters (a). Four hamsters per group were euthanized at 2 and 5 days post-infection (d.p.i.) and used for virological and pathological analysis (b–e). a Body weight, enhanced pause (Penh), and the ratio of time to peak expiratory flow relative to the total expiratory time (Rpef) values of infected hamsters (n = 6 per infection group). b (Left) Viral RNA loads in the oral swab (n = 6 per infection group). (Middle and right) Viral RNA loads in the lung hilum (middle) and lung periphery (right) of infected hamsters (n = 4 per infection group). c Immunohistochemical (IHC) analysis of the viral nucleocapsid (N) protein in the lungs at 2 d.p.i. (top) and 5 d.p.i. (bottom) of infected hamsters. Representative figures (left, N-positive cells are shown in brown) and the percentage of N-positive cells in whole lung lobes (right, n = 4 per infection group) are shown. The raw data are shown in Supplementary Fig. 6. d, e, Hematoxylin and eosin (H&E) staining of the lungs of infected hamsters. Representative figures are shown in (d). Uninfected lung alveolar space and bronchioles are also shown. e Histopathological scoring of lung lesions (n = 4 per infection group). Representative pathological features are reported in our previous studies,,,–. In (a–c), data are presented as the average ± standard error of mean (SEM). In (a, b, c, e), statistically significant differences between XBB.1 and other variants across timepoints were determined by multiple regression. In (a), the 0 d.p.i. data were excluded from the analyses. The familywise error rates (FWERs) calculated using the Holm method are indicated in the figures. Scale bars, 500 μm (c); 200 μm (d). Source data are provided with this paper.

References

    1. WHO. Tracking SARS-CoV-2 variants (March 30, 2023) https://www.who.int/en/activities/tracking-SARS-CoV-2-variants. (2022).
    1. Ito, J. et al. Convergent evolution of the SARS-CoV-2 Omicron subvariants leading to the emergence of BQ.1.1 variant. Nat. Commun.14, 2671 (2023). - PMC - PubMed
    1. Focosi, D., Quiroga, R., McConnell, S. A., Johnson, M. C. & Casadevall, A. Convergent evolution in SARS-CoV-2 Spike creates a variant soup that causes new COVID-19 waves. BioRxiv, (2022) 10.1101/2022.1112.1105.518843. - PMC - PubMed
    1. Tuekprakhon A, et al. Antibody escape of SARS-CoV-2 Omicron BA.4 and BA.5 from vaccine and BA.1 serum. Cell. 2022;185:2422–2433. doi: 10.1016/j.cell.2022.06.005. - DOI - PMC - PubMed
    1. Kimura I, et al. Virological characteristics of the novel SARS-CoV-2 Omicron variants including BA.4 and BA.5. Cell. 2022;185:3992–4007. doi: 10.1016/j.cell.2022.09.018. - DOI - PMC - PubMed

Publication types

Substances

Supplementary concepts