. 2023 May 16;14(1):2799.
doi: 10.1038/s41467-023-38275-1.

Protection against SARS-CoV-2 Omicron BA.4/5 variant following booster vaccination or breakthrough infection in the UK

Collaborators, Affiliations

Protection against SARS-CoV-2 Omicron BA.4/5 variant following booster vaccination or breakthrough infection in the UK

Jia Wei et al. Nat Commun. .

Abstract

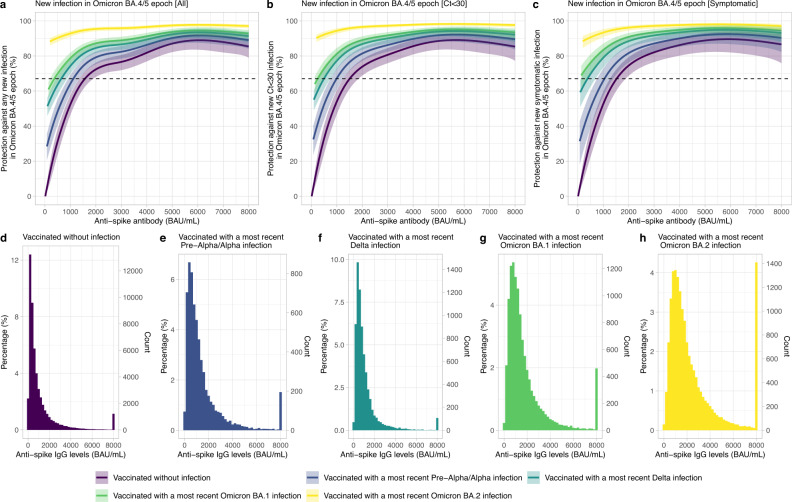
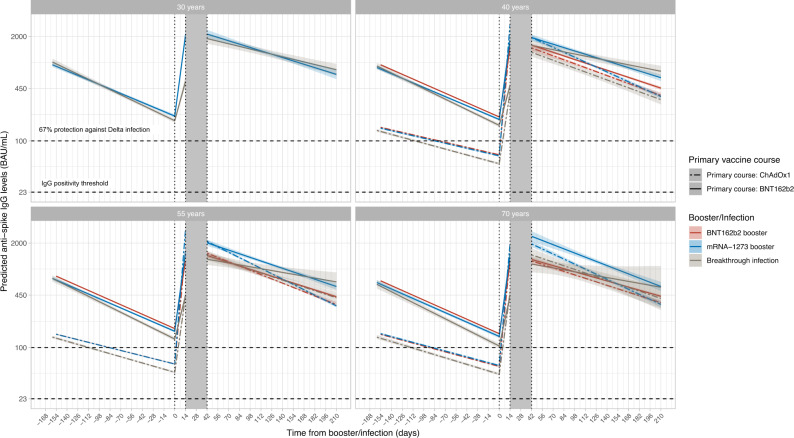
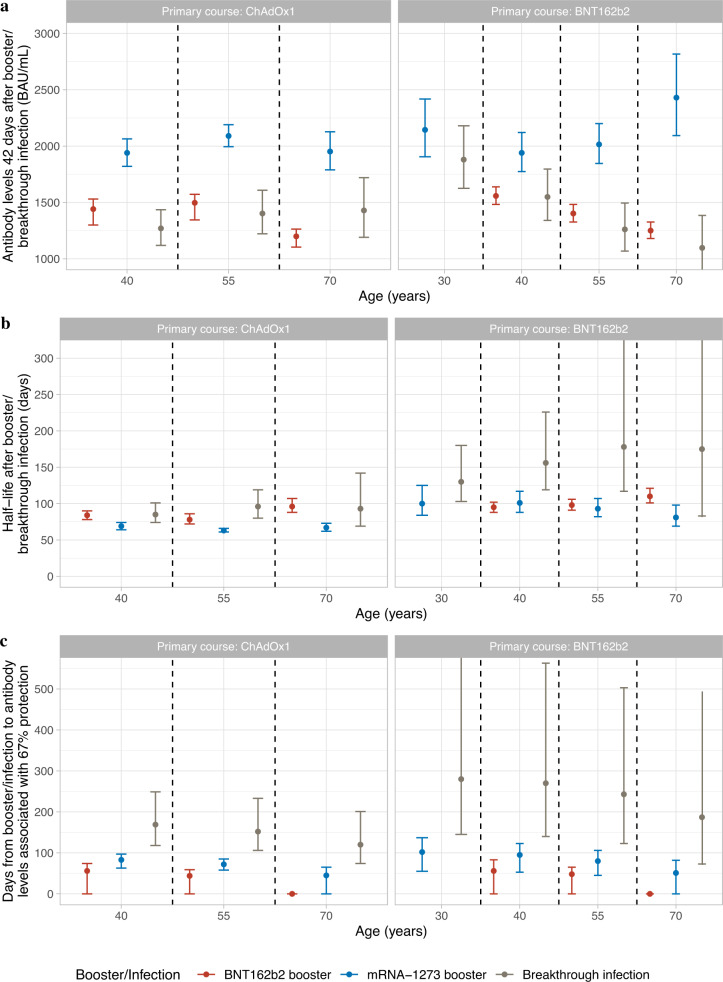
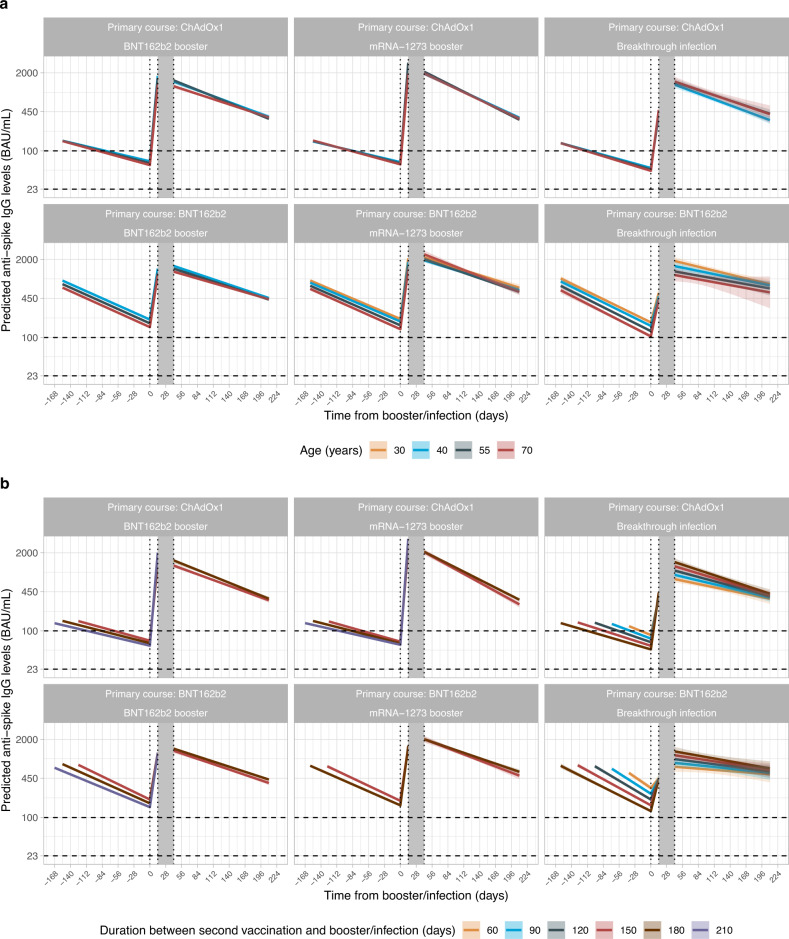
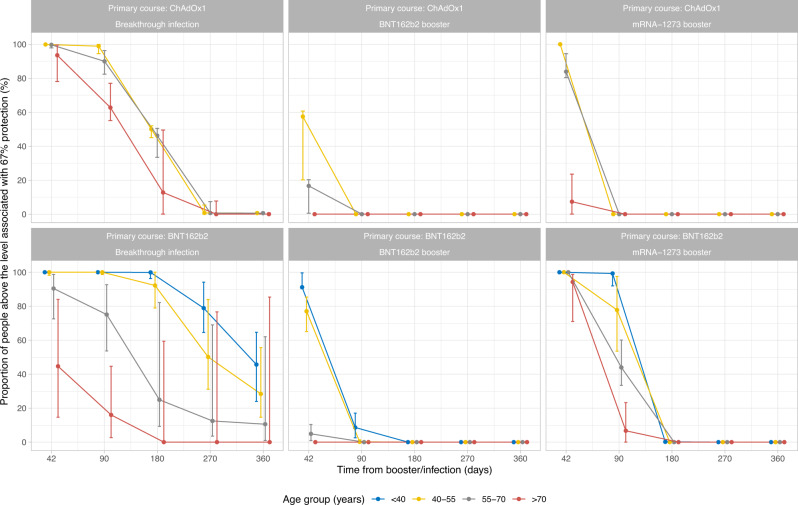
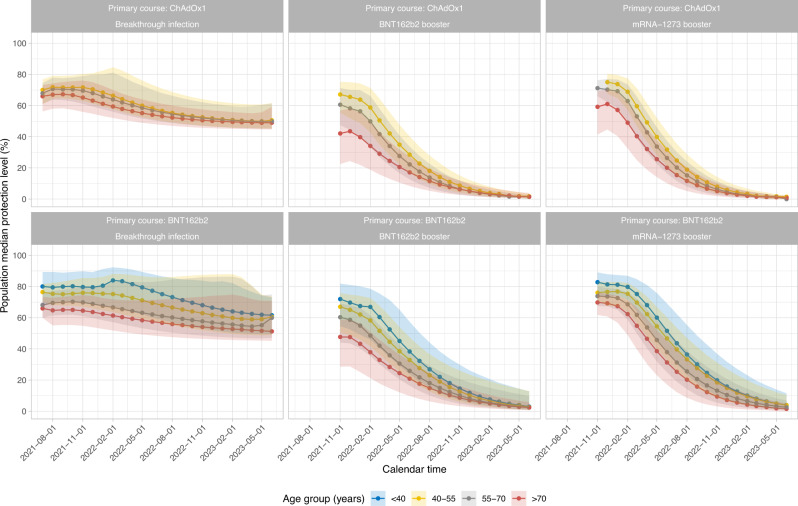
Following primary SARS-CoV-2 vaccination, whether boosters or breakthrough infections provide greater protection against SARS-CoV-2 infection is incompletely understood. Here we investigated SARS-CoV-2 antibody correlates of protection against new Omicron BA.4/5 (re-)infections and anti-spike IgG antibody trajectories after a third/booster vaccination or breakthrough infection following second vaccination in 154,149 adults ≥18 y from the United Kingdom general population. Higher antibody levels were associated with increased protection against Omicron BA.4/5 infection and breakthrough infections were associated with higher levels of protection at any given antibody level than boosters. Breakthrough infections generated similar antibody levels to boosters, and the subsequent antibody declines were slightly slower than after boosters. Together our findings show breakthrough infection provides longer-lasting protection against further infections than booster vaccinations. Our findings, considered alongside the risks of severe infection and long-term consequences of infection, have important implications for vaccine policy.


Conflict of interest statement

D.W.E. declares lecture fees from Gilead, outside the submitted work. P.C.M. receives GSK funding to support a PhD fellowship in her team. The remaining authors declare no competing interests.

Figures

Fig. 1
Fig. 1. Association between anti-spike IgG levels and protection from new SARS-CoV-2 infection using the most recent antibody measurement obtained 21–59 days before the current assessment.
a Mean protection against any new infection in the Omicron BA.4/5 epoch. b Mean protection against infection with a moderate to high viral load (Ct value <30) in the Omicron BA.4/5 epoch. c Mean protection against infection with self-reported symptoms in the Omicron BA.4/5 epoch. The 95% CIs are calculated by prediction ± 1.96 × standard error of the prediction. Five groups are investigated: vaccinated participants without evidence of prior infection, vaccinated participants with a most recent Pre-Alpha or Alpha infection, vaccinated participants with a most recent Delta infection, vaccinated participants with a most recent Omicron BA.1 infection and vaccinated participants with a most recent Omicron BA.2 infection. Participants with 1 (629 assessments, 0.3%), 2 (7657 assessments, 3.7%), 3 (171,650 assessments, 83.9%) or 4 (24,753 assessments, 12.1%) vaccinations were grouped together. Protection is defined as relative protection against baseline protection from 16 BAU/mL in those vaccinated without infection, which is the threshold for vaccine non-responders. In ac, antibody measurements were plotted after the first percentile overall in each previous infection group (16, 80, 100, 140 and 200 BAU/mL, respectively). The distribution and number of the most recent anti-spike IgG measurements for the four population groups are shown in dh. Results remained similar, restricting to those who had only one prior infection (84,034 assessments, 90%).
Fig. 2
Fig. 2. Posterior predicted trajectories of mean anti-spike IgG levels (95% CrI) from second vaccination through third/booster vaccination or infection using Bayesian linear mixed interval-censored models.
Time 0 indicates the earliest of the date each participant received their third/booster vaccination or their first breakthrough infection. For each group, two separate models were fitted: (1) piecewise model on antibody decline after the second vaccination and subsequent increase after third/booster vaccination or infection; (2) antibody decline 42 days after the third/booster vaccination or infection. The shaded area between 14- and 42-days post-third/booster vaccination or infection represents different timepoints individuals reach peak antibody levels. Models are adjusted for age, sex, ethnicity, time from second vaccination to booster/infection, long-term health conditions and healthcare role. Plotted at the reference categories (female, white ethnicity, 6 months between second vaccination and booster/infection, not reporting a long-term health condition, not working in healthcare). Line types indicate the primary vaccine course. Line colours indicate the booster type or infection. Lines prior to the booster/infection, i.e. before t = 0, are included to allow comparison of antibody declines prior to and following booster/infection. The ChAdOx1-BNT162b2 (red dotted line) and ChAdOx1-mRNA-1273 (blue dotted line) are overlapped before time 0. Plots are separated by age (30 y only estimated for those who had BNT162b2 as primary and were boosted by mRNA-1273 or infection due to low numbers in other groups). Predicted values are plotted on a log scale. Black dashed lines indicate the correlation for 67% protection against the Delta variant (100 BAU/mL) and the threshold of IgG positivity (23 BAU/mL).
Fig. 3
Fig. 3. Comparisons of antibody levels 42 days post-third/booster vaccination or infection, half-lives, and days from third/booster vaccination or infection to reaching antibody levels associated with 67% protection by primary vaccine course, third/booster vaccination or infection and age.
a Comparisons of antibody levels 42 days post-third/booster vaccination or infection. b Comparisons of half-lives after third/booster vaccination or infection. c Comparisons of days from third/booster vaccination or infection to reaching antibody levels associated with 67% protection. Median values with 95% credible intervals are plotted. 95% credible interval in panel c are calculated from posterior simulations from the GAM model estimating correlates of protection and posterior predictions from the Bayesian linear mixed models estimating antibody levels. Predictions are on specific ages (30, 40, 55 and 70 years). 30 y is not plotted for ChAdOx1 primary course because the majority of participants receiving the ChAdOx1 primary course are >40 y. Numbers are shown in Supplementary Table 3. Plotted at the reference categories (female, white ethnicity, 6 months between second vaccination and booster/infection, not reporting a long-term health condition and not working in healthcare).
Fig. 4
Fig. 4. Posterior predicted trajectories of mean anti-spike IgG levels (95%CrI) from third/booster vaccination or infection.
a By age. b By the time from second vaccination to third/booster vaccination or infection. For each group, two separate models are fitted: (1) piecewise model on antibody decline after the second vaccination and subsequent increase after third/booster vaccination or infection; (2) antibody decline 42 days after the third/booster vaccination or infection. The shaded area between 14- and 42-days post-third/booster vaccination or infection represents different timepoints individuals reach peak antibody levels. Models are adjusted for age, sex, ethnicity, time from second vaccination to booster/infection, long-term health conditions and healthcare role. Plotted at the reference categories (female, white ethnicity, time from second vaccination to booster/infection 6 months, not reporting a long-term health condition, not working in healthcare). Plots are separated by primary vaccine courses and booster types or infection. Predicted values are plotted on a log scale. Black dashed lines indicate the correlation for 67% protection against the Delta variant (100 BAU/mL) and the threshold of IgG positivity (23 BAU/mL).
Fig. 5
Fig. 5. Proportion of participants above the anti-spike IgG antibody threshold level associated with 67% protection by time from third/booster vaccination or infection.
The numbers of participants in each panel are [numbers in brackets represent <40, 40–55, 55–70 and >70 years]: ChAdOx1-Infection: n = 4214 [537, 2167, 1216, 294]; ChAdOx1-BNT162b2: n = 41,152 [1295, 8826, 19,232, 11,799]; ChAdOx1-mRNA-1273: n = 14,748 [738, 5341, 7859, 810]; BNT162b2-Infection: n = 1857 [956, 438, 313, 150]; BNT162b2-BNT162b2: n = 24,749 [2447, 3613, 8955, 9734]; BNT162b2-mRNA-1273: n = 4403 [1791, 889, 1,409, 314]. ‘< 40-year’ group is not plotted for ChAdOx1 primary course because the vast majority of those receiving ChAdOx1 were 40 years of age or older. Median values with 95% credible intervals are plotted.
Fig. 6
Fig. 6. Median protection level by calendar time.
Estimations were based on assumptions that participants did not receive another vaccination and were not infected after their third/booster vaccination or breakthrough infection. The numbers of participants in each panel are [numbers in brackets represent <40, 40–55, 55–70 and >70 years]: ChAdOx1-Infection: n = 4214 [537, 2167, 1216, 294]; ChAdOx1-BNT162b2: n = 41,152 [1295, 8826, 19,232, 11,799]; ChAdOx1-mRNA-1273: n = 14,748 [738, 5341, 7859, 810]; BNT162b2-Infection: n = 1857 [956, 438, 313, 150]; BNT162b2-BNT162b2: n = 24,749 [2447, 3613, 8955, 9734]; BNT162b2-mRNA-1273: n = 4,403 [1791, 889, 1409, 314]. The ‘<40-year’ group is not plotted for ChAdOx1 primary course because the vast majority of those receiving ChAdOx1 were 40 years of age or older. A 95% credible interval is calculated from posterior simulations from the GAM model estimating correlates of protection and posterior predictions from the Bayesian linear mixed models estimating antibody levels.

Similar articles

Cited by

References

    1. Tregoning JS, Flight KE, Higham SL, Wang Z, Pierce BF. Progress of the COVID-19 vaccine effort: viruses, vaccines and variants versus efficacy, effectiveness and escape. Nat. Rev. Immunol. 2021;21:626–636. doi: 10.1038/s41577-021-00592-1. - DOI - PMC - PubMed
    1. Bernal JL, et al. Effectiveness of the Pfizer-BioNTech and Oxford-AstraZeneca vaccines on covid-19 related symptoms, hospital admissions, and mortality in older adults in England: test negative case-control study. BMJ. 2021;373:n1088. doi: 10.1136/bmj.n1088. - DOI - PMC - PubMed
    1. Cerqueira-Silva T, et al. Effectiveness of CoronaVac, ChAdOx1 nCoV-19, BNT162b2, and Ad26.COV2.S among individuals with previous SARS-CoV-2 infection in Brazil: a test-negative, case-control study. Lancet Infect. Dis. 2022;22:791–801. doi: 10.1016/S1473-3099(22)00140-2. - DOI - PMC - PubMed
    1. Tseng HF, et al. Effectiveness of mRNA-1273 against SARS-CoV-2 Omicron and Delta variants. Nat. Med. 2022;28:1063–1071. doi: 10.1038/s41591-022-01753-y. - DOI - PMC - PubMed
    1. Goldberg Y, et al. Waning immunity after the BNT162b2 vaccine in Israel. N. Engl. J. Med. 2021;385:e85. doi: 10.1056/NEJMoa2114228. - DOI - PMC - PubMed

Publication types