. 2023 May 16;13(1):7899.
doi: 10.1038/s41598-023-34586-x.

Modulation of the gut microbiome with nisin

Affiliations

Modulation of the gut microbiome with nisin

Catherine O'Reilly et al. Sci Rep. .

Abstract

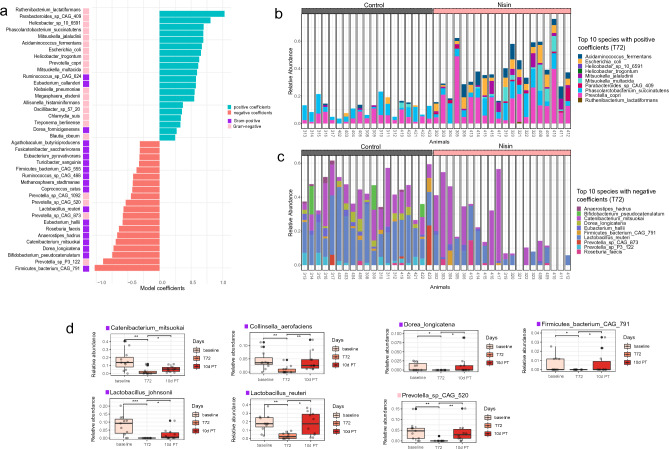
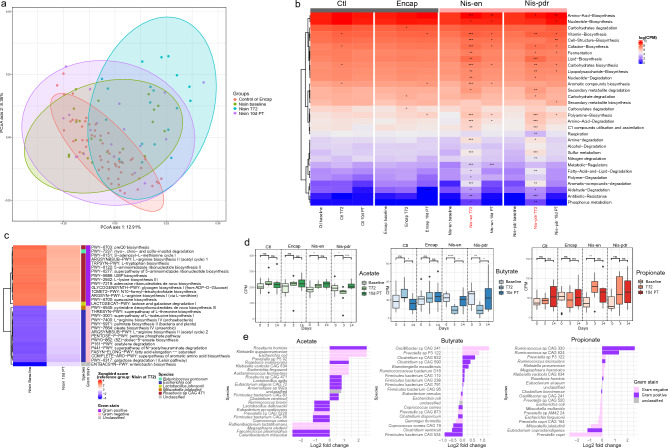
Nisin is a broad spectrum bacteriocin used extensively as a food preservative that was identified in Lactococcus lactis nearly a century ago. We show that orally-ingested nisin survives transit through the porcine gastrointestinal tract intact (as evidenced by activity and molecular weight determination) where it impacts both the composition and functioning of the microbiota. Specifically, nisin treatment caused a reversible decrease in Gram positive bacteria, resulting in a reshaping of the Firmicutes and a corresponding relative increase in Gram negative Proteobacteria. These changes were mirrored by the modification in relative abundance of pathways involved in acetate, butyrate (decreased) and propionate (increased) synthesis which correlated with overall reductions in short chain fatty acid levels in stool. These reversible changes that occur as a result of nisin ingestion demonstrate the potential of bacteriocins like nisin to shape mammalian microbiomes and impact on the functionality of the community.


Conflict of interest statement

The authors declare no competing interests.

Figures

Figure 1
Figure 1
Overview of the experiment, mass spectroscopy and metabolomics results. (a) Overview of the treatment groups and the sampling timeline. (b) MALDI TOF Mass spectrophotometry analysis and activity assays to detect nisin (pictures). Detection of intact nisin (red arrows) in the faeces of pig in the nisin powder treated group at Baseline (BL), 24 h following initial treatment (T24), 48 h following initial treatment (T48), 72 h following initial treatment (T72), 72 h after initial treatment stopped (3d PT) and 10 days after initial treatment stopped (10d PT). Smaller zones and Nisin masses were found in Day 7 and no zones or masses found on day 14 (1 in 10 dil). (c) Biological activity of nisin and nisin peak detection in porcine faecal samples, using Maldi TOF mass spectrophotometry. (d) SCFA concentration (mM) in control (here Ctl and Encap grouped together) versus nisin groups (here nis-en and nis-pdr grouped together) over BL, T72 and 10d PT (Wilcoxon Rank Sum test, *p < 0.05, **p < 0.01, ***p < 0.001).
Figure 2
Figure 2
Microbiome community composition and beta diversity are significantly different in nisin treatment at T72, while alpha-diversity is not. (a) Sankey plot showing the relative abundance of the microbiome in the different control versus nisin treatment groups at the Class level. The red arrows and the dotted line correspond to the highest dose of nisin in the samples. (b) Sankey plot showing the relative abundance of the microbiome in the different control versus nisin treatment groups at the Phylum level. The red arrows and the dotted line correspond to the highest dose of nisin in the samples. (c) Alpha diversity, measured using the Shannon index, changing significantly between groups at T72 (Wilcoxon Rank Sum test, *p  < 0.05, **p < 0.01). The grey and pink area denote the control groups (Encap and Ctl) and nisin treatment groups (Nis-en and Nis-pdr), respectively. (d) Alpha diversity, measured using the Shannon index, shown within each group. No significant differences were observed. (e) PCoA ordination (Bray–Curtis distance) showing that samples from Nis-en and Nis-pdr at T72 mostly group together (blue and pink ellipses, respectively). Ellipses represent a 95% CI around the cluster centroid for each study area group at T72. (f) PCoA ordination (Unifrac distance) showing that samples from Nis-en and Nis-pdr at T72 mostly group together (blue and pink ellipses, respectively). Ellipses represent a 95% CI around the cluster centroid for each study area group at T72.
Figure 3
Figure 3
Gram-positive bacteria are significantly decreased during nisin treatment while gram-negative bacteria significantly increase. (a) Model coefficients of the multinomial regression analysis made with Songbird (model: species ~ nisin treatment x days) ranked according to nis-pdr at T72. Species with high coefficients (positive and more abundant in nis-pdr T72, blue, or negative and less abundant in nis-pdr T72, red; pink, gram-positive, purple, gram-negative) were best able to distinguish nis-pdr group during treatment at T72. (b) Community composition at the individual level of the top 10 species with positive coefficients (grey, control groups, pink, nisin treatment). (c) Community composition at the individual level of the top 10 species with negative coefficients (grey, control groups, pink, nisin treatment). (d) Boxplot showing the relative abundance of the species that were significantly decreased during nis-pdr T72 only compared to both nis-pdr baseline and nis-pdr 10d PT (Wilcoxon Rank Sum test, *p < 0.05, **p < 0.01, ***p < 0.001). All are gram-positive (purple) except Prevotella sp CAG 520 (pink).
Figure 4
Figure 4
Functional analysis of the control versus treatment groups. (a) PCoA ordination (Bray–Curtis distance) of the HUMAnN gene counts (counts per million) for the Nis-en and Nis-pdr at T72 versus the other groups. (b) Heatmap showing the functional composition (log(HUMAnN count per million)) at the highest MetaCyc pathway level hierarchy of the different groups at the different time points (grey area, control groups, pink area, treatment groups; the red arrows correspond to the highest dose of nisin in the samples). The pathways are hierarchically clustered using Euclidean distance. (c) Heatmap showing the top 30 most differentially abundant HUManN pathways according to their Songbird scores (model: pathways ~ nisin treatment x days) for the groups Nisin (Nis-en and Nis-pdr) at Baseline versus T72 (left) and 10d PT versus T72 (right). These pathways are stratified by species (shown on the right bar). We show here the top 15 most positive (i.e., more associated with Nisin at Baseline (left) or 10d PT (right)) and the top 15 most negative pathways (i.e., more associated with Nisin at T72). (d) Abundance (HUMAnN count per million) of the pathways involved in SCFA production in the different groups at different time points and their differences (Wilcoxon Rank Sum test, *****p < 0.0001, ***p < 0.001, **p < 0.01, *p < 0.05, ns: non-significative). (e) Log2 fold changes of the top 20 species with highest and lowest gene abundance log2fold changes in nisin treated groups relative to their respective baseline.

References

    1. Maldonado-Barragán A, et al. Induction of bacteriocin production by coculture is widespread among plantaricin-producing Lactobacillus plantarum strains with different regulatory operons. Food Microbiol. 2013;33(1):40–47. doi: 10.1016/j.fm.2012.08.009. - DOI - PubMed
    1. Lubelski J, et al. Biosynthesis, immunity, regulation, mode of action and engineering of the model lantibiotic nisin. Cell. Mol. Life Sci. 2008;65(3):455–476. doi: 10.1007/s00018-007-7171-2. - DOI - PMC - PubMed
    1. De Arauz LJ, et al. Nisin biotechnological production and application: A review. Trends Food Sci. Technol. 2009;20(3–4):146–154. doi: 10.1016/j.tifs.2009.01.056. - DOI
    1. Younes M, et al. Safety of nisin (E 234) as a food additive in the light of new toxicological data and the proposed extension of use. EFSA J. 2017;15:5063. - PMC - PubMed
    1. Hagiwara A, et al. A 90-day oral toxicity study of nisin A, an anti-microbial peptide derived from Lactococcus lactis subsp. lactis, in F344 rats. Food Chem. Toxicol. 2010;48(8–9):2421–2428. doi: 10.1016/j.fct.2010.06.002. - DOI - PubMed

Publication types