

Epidemiology and molecular characterization of avian influenza A viruses H5N1 and H3N8 subtypes in poultry farms and live bird markets in Bangladesh
- PMID: 37193732
- PMCID: PMC10188517
- DOI: 10.1038/s41598-023-33814-8
Epidemiology and molecular characterization of avian influenza A viruses H5N1 and H3N8 subtypes in poultry farms and live bird markets in Bangladesh
Abstract
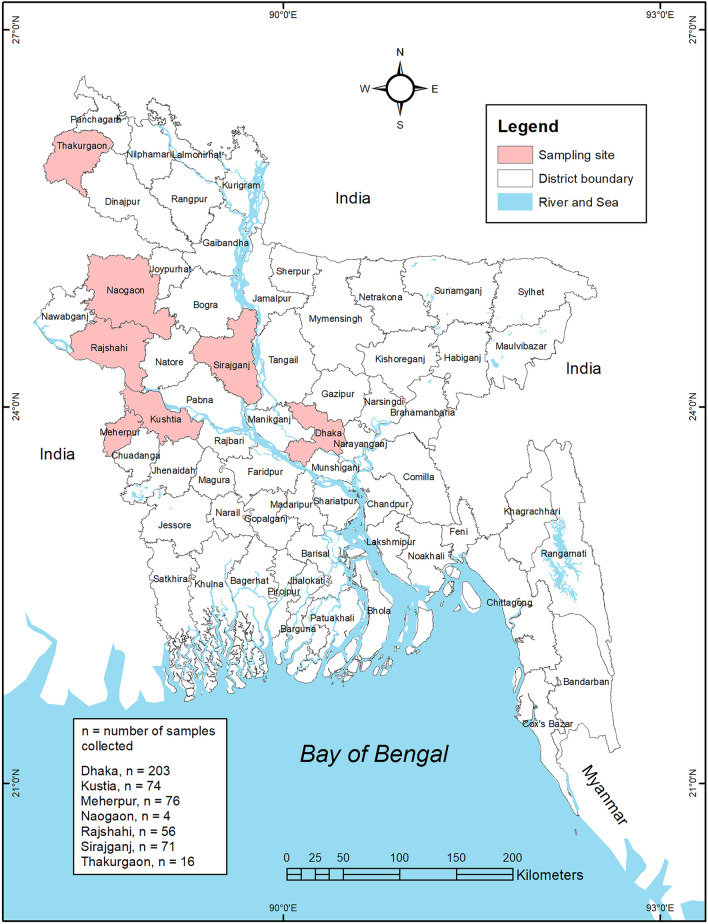
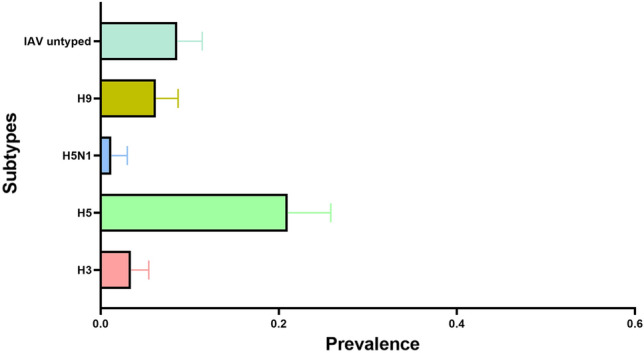
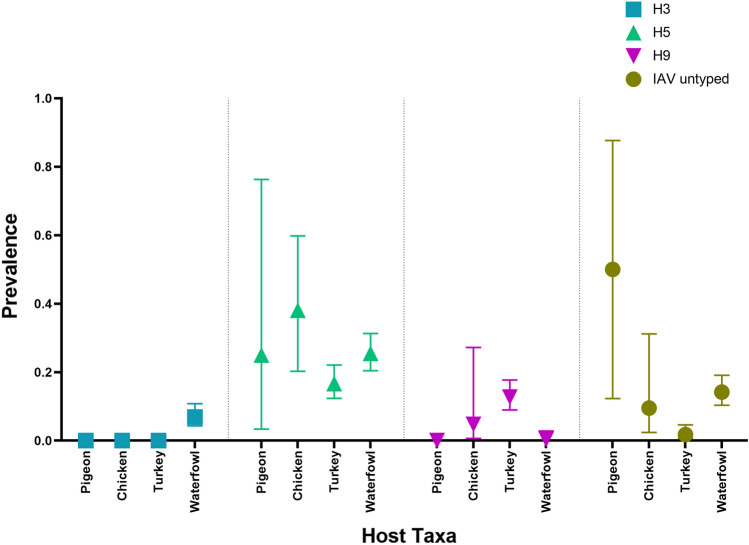
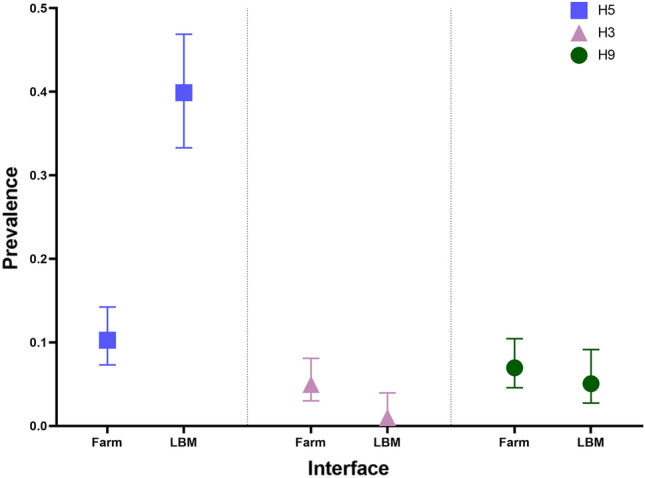
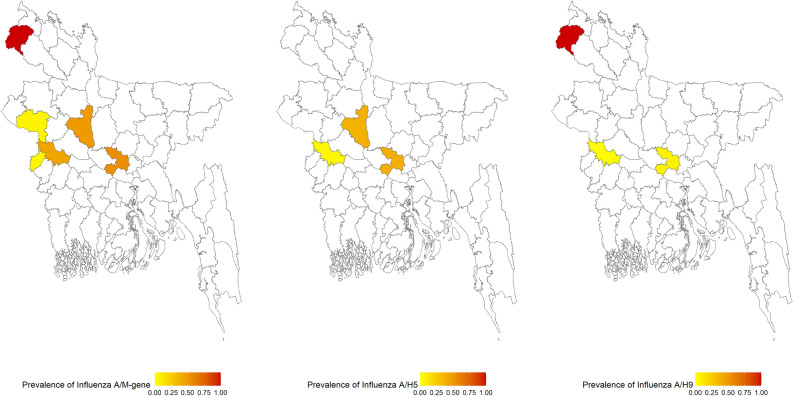
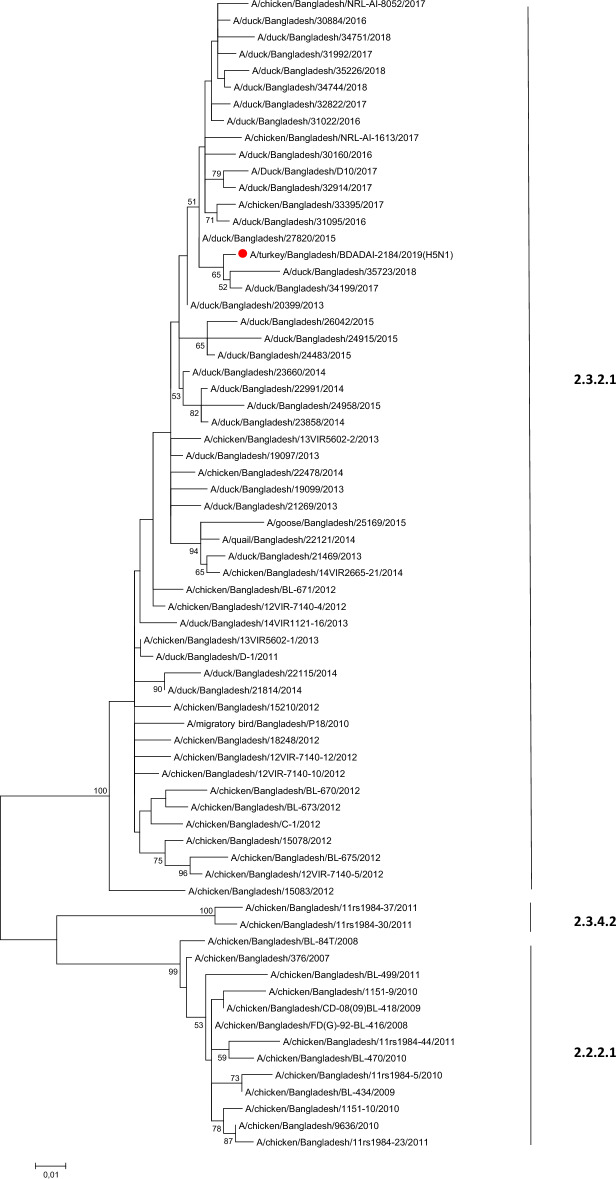
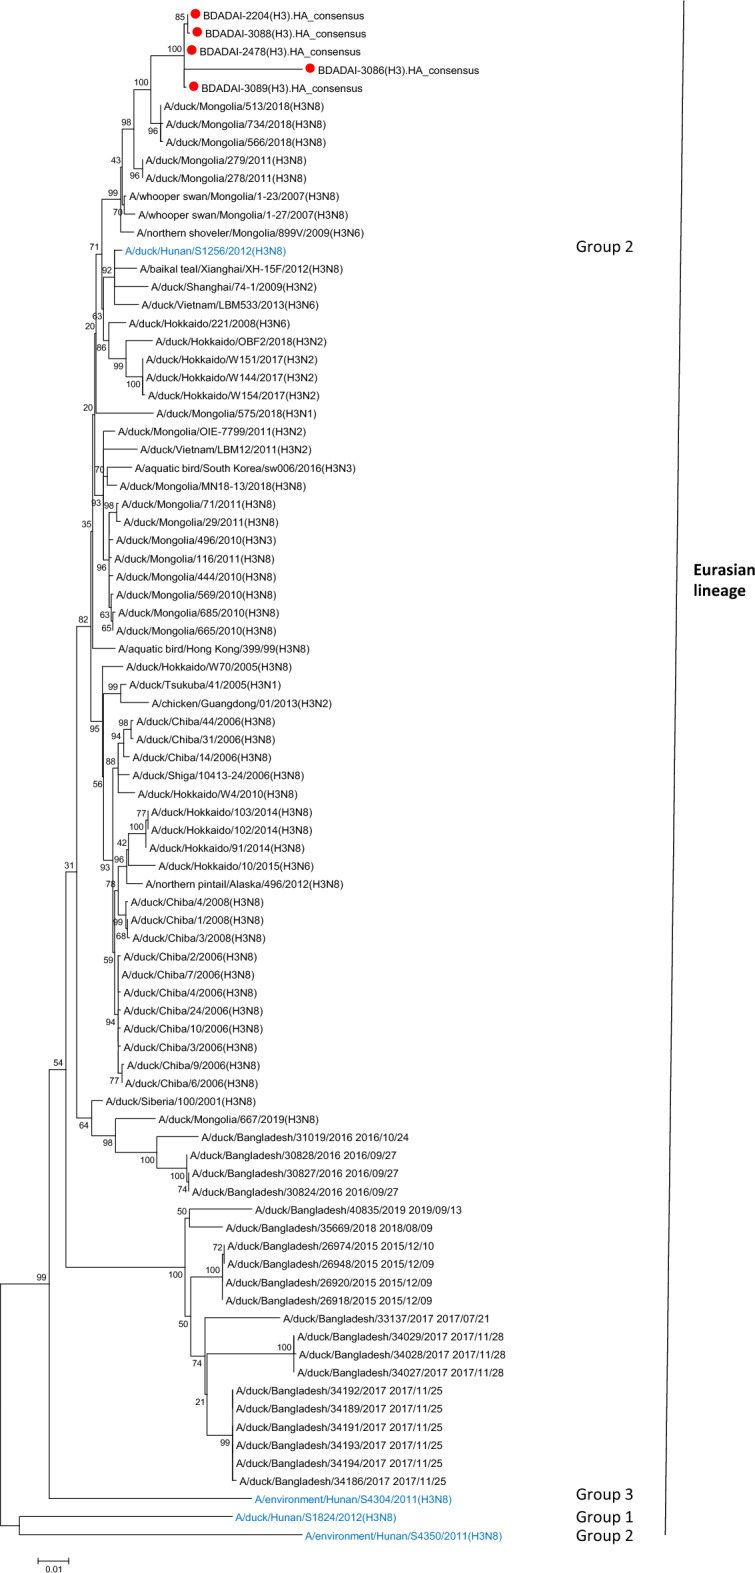
Avian influenza virus (AIV) remains a global threat, with waterfowl serving as the primary reservoir from which viruses spread to other hosts. Highly pathogenic avian influenza (HPAI) H5 viruses continue to be a devastating threat to the poultry industry and an incipient threat to humans. A cross-sectional study was conducted in seven districts of Bangladesh to estimate the prevalence and subtypes (H3, H5, and H9) of AIV in poultry and identify underlying risk factors and phylogenetic analysis of AIVs subtypes H5N1 and H3N8. Cloacal and oropharyngeal swab samples were collected from 500 birds in live bird markets (LBMs) and poultry farms. Each bird was sampled by cloacal and oropharyngeal swabbing, and swabs were pooled for further analysis. Pooled samples were analyzed for the influenza A virus (IAV) matrix (M) gene, followed by H5 and H9 molecular subtyping using real-time reverse transcription-polymerase chain reaction (rRT-PCR). Non-H5 and Non-H9 influenza A virus positive samples were sequenced to identify possible subtypes. Selected H5 positive samples were subjected to hemagglutinin (HA) and neuraminidase (NA) gene sequencing. Multivariable logistic regression was used for risk factor analysis. We found that IAV M gene prevalence was 40.20% (95% CI 35.98-44.57), with 52.38%, 46.96%, and 31.11% detected in chicken, waterfowl, and turkey, respectively. Prevalence of H5, H3, and H9 reached 22%, 3.4%, and 6.9%, respectively. Waterfowl had a higher risk of having AIV (AOR: 4.75), and H5 (AOR: 5.71) compared to chicken; more virus was detected in the winter season than in the summer season (AOR: 4.93); dead birds had a higher risk of AIVs and H5 detection than healthy birds, and the odds of H5 detection increased in LBM. All six H5N1 viruses sequenced were clade 2.3.2.1a-R1 viruses circulating since 2015 in poultry and wild birds in Bangladesh. The 12 H3N8 viruses in our study formed two genetic groups that had more similarity to influenza viruses from wild birds in Mongolia and China than to previous H3N8 viruses from Bangladesh. The findings of this study may be used to modify guidelines on AIV control and prevention to account for the identified risk factors that impact their spread.
© 2023. The Author(s).
Conflict of interest statement
The authors declare no competing interests.
Figures
Similar articles
-
Prevalence and risk factors for avian influenza virus (H5 and H9) contamination in peri-urban and rural live bird markets in Bangladesh.Front Public Health. 2023 Apr 20;11:1148994. doi: 10.3389/fpubh.2023.1148994. eCollection 2023. Front Public Health. 2023. PMID: 37151580 Free PMC article.
-
Epidemiology and phylodynamics of multiple clades of H5N1 circulating in domestic duck farms in different production systems in Bangladesh.Front Public Health. 2023 Jul 6;11:1168613. doi: 10.3389/fpubh.2023.1168613. eCollection 2023. Front Public Health. 2023. PMID: 37483933 Free PMC article.
-
Surveillance, epidemiological, and virological detection of highly pathogenic H5N1 avian influenza viruses in duck and poultry from Bangladesh.Vet Microbiol. 2016 Sep 25;193:49-59. doi: 10.1016/j.vetmic.2016.07.025. Epub 2016 Aug 2. Vet Microbiol. 2016. PMID: 27599930
-
Review analysis and impact of co-circulating H5N1 and H9N2 avian influenza viruses in Bangladesh.Epidemiol Infect. 2018 Jul;146(10):1259-1266. doi: 10.1017/S0950268818001292. Epub 2018 May 21. Epidemiol Infect. 2018. PMID: 29781424 Free PMC article.
-
The genetics of highly pathogenic avian influenza viruses of subtype H5 in Germany, 2006-2020.Transbound Emerg Dis. 2021 May;68(3):1136-1150. doi: 10.1111/tbed.13843. Epub 2020 Sep 29. Transbound Emerg Dis. 2021. PMID: 32964686 Review.
Cited by
-
Avian Influenza: Lessons from Past Outbreaks and an Inventory of Data Sources, Mathematical and AI Models, and Early Warning Systems for Forecasting and Hotspot Detection to Tackle Ongoing Outbreaks.Healthcare (Basel). 2024 Oct 1;12(19):1959. doi: 10.3390/healthcare12191959. Healthcare (Basel). 2024. PMID: 39408139 Free PMC article. Review.
-
Seroprevalence of Avian Influenza in Guinea Fowls in Some Districts in the Upper East Region of Ghana.Vet Med Sci. 2024 Nov;10(6):e70106. doi: 10.1002/vms3.70106. Vet Med Sci. 2024. PMID: 39474767 Free PMC article.
-
Active surveillance of avian influenza in the southwestern Poyang Lake area, China: Analyzing changes in wholesale and frozen fresh retail markets post-policy implementation.Poult Sci. 2025 Jan;104(1):104486. doi: 10.1016/j.psj.2024.104486. Epub 2024 Nov 1. Poult Sci. 2025. PMID: 39577173 Free PMC article.
-
Diversity of the H9N2 Avian Influenza Virus in Shandong Province, China.Transbound Emerg Dis. 2025 Jan 16;2025:1432483. doi: 10.1155/tbed/1432483. eCollection 2025. Transbound Emerg Dis. 2025. PMID: 40302737 Free PMC article.
-
Potential risk zones and climatic factors influencing the occurrence and persistence of avian influenza viruses in the environment of live bird markets in Bangladesh.One Health. 2023 Oct 13;17:100644. doi: 10.1016/j.onehlt.2023.100644. eCollection 2023 Dec. One Health. 2023. PMID: 38024265 Free PMC article.
References
-
- Swayne D, Pantin-Jackwood M. Pathogenicity of avian influenza viruses in poultry. Dev. Biol. (Basel) 2006;124:61–67. - PubMed
Publication types
MeSH terms
Grants and funding
LinkOut - more resources
Full Text Sources
Medical
