

Peroxisome proliferator-activated receptor α agonist induces mouse hepatomegaly through the spatial hepatocyte enlargement and proliferation
- PMID: 37193756
- PMCID: PMC10545716
- DOI: 10.1038/s41401-023-01096-5
Peroxisome proliferator-activated receptor α agonist induces mouse hepatomegaly through the spatial hepatocyte enlargement and proliferation
Abstract
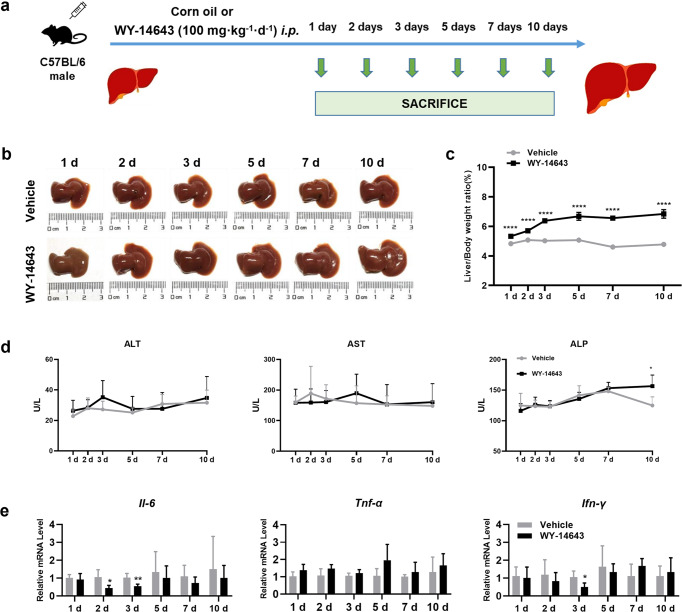
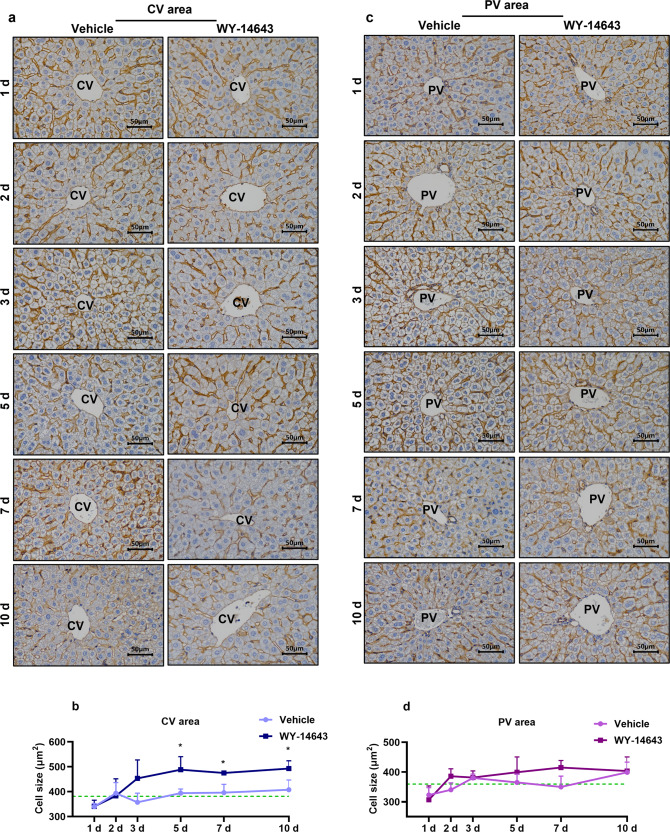
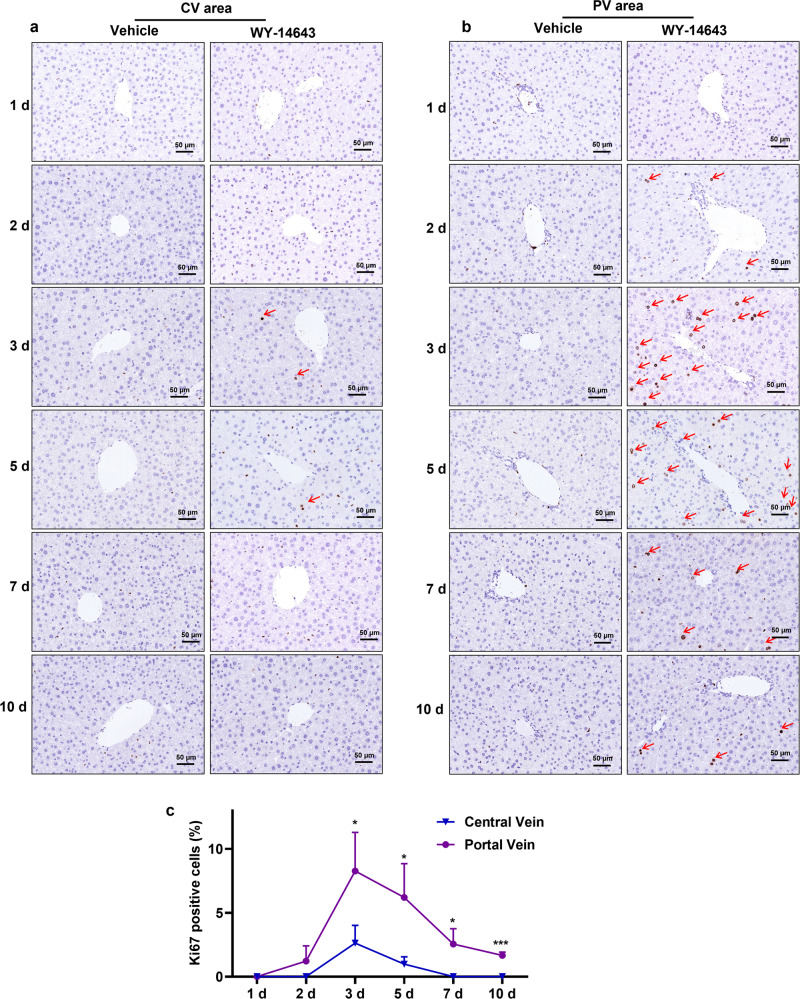
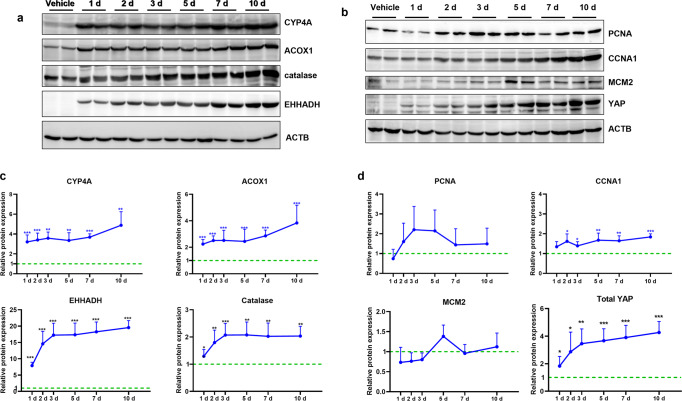
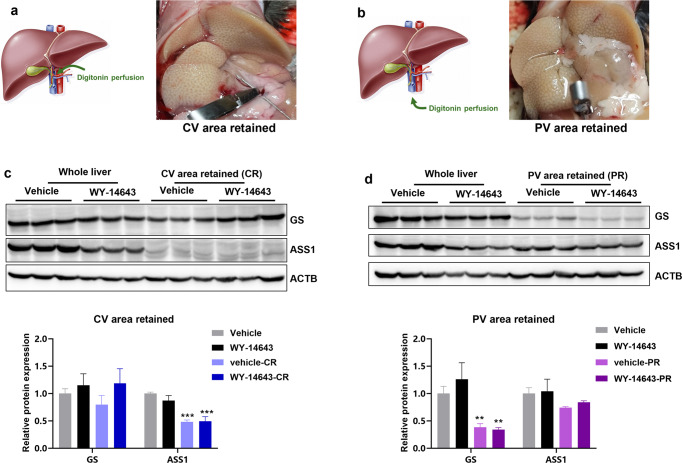
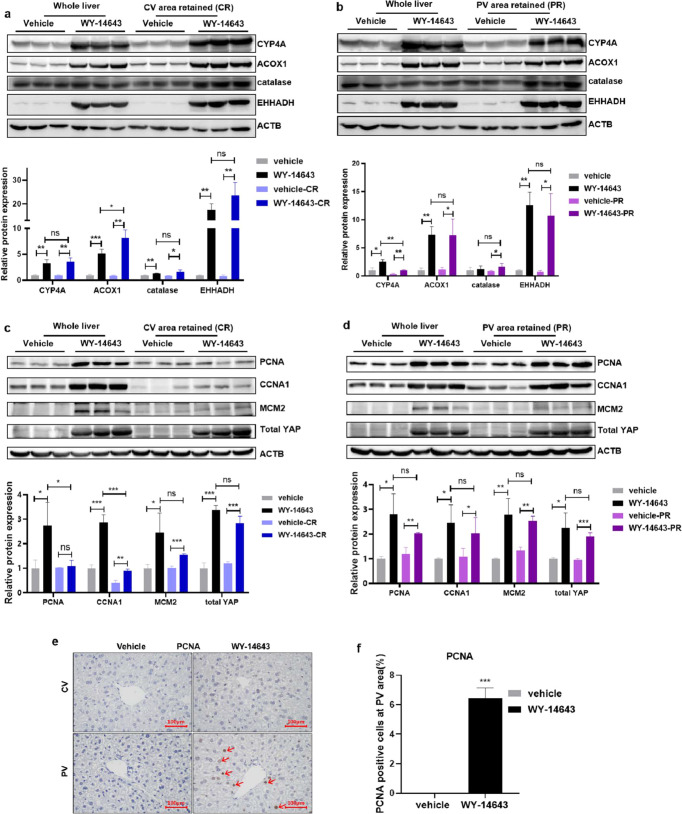
Peroxisome proliferator-activated receptor alpha (PPARα) activation-induced hepatomegaly is accompanied by hepatocyte hypertrophy around the central vein (CV) area and hepatocyte proliferation around the portal vein (PV) area. However, the molecular mechanisms underlying this spatial change of hepatocytes remains unclear. In this study, we examined the characteristics and possible reasons for the zonation distinction of hypertrophy and proliferation during PPARα activation-induced mouse liver enlargement. Mice were injected with corn oil or a typical mouse PPARα agonist WY-14643 (100 mg·kg-1·d-1, i.p.) for 1, 2, 3, 5 or 10 days. At each time point, the mice were sacrificed after the final dose, and liver tissues and serum were harvested for analysis. We showed that PPARα activation induced zonal changes in hepatocyte hypertrophy and proliferation in the mice. In order to determine the zonal expression of proteins related to hepatocyte hypertrophy and proliferation in PPARα-induced liver enlargement, we performed digitonin liver perfusion to separately destroy the hepatocytes around the CV or PV areas, and found that PPARα activation-induced increase magnitude of its downstream targets such as cytochrome P450 (CYP) 4 A and acyl-coenzyme A oxidase 1 (ACOX1) levels around the CV area were higher compared with those around the PV area. Upregulation of proliferation-related proteins such as cell nuclear antigen (PCNA) and cyclin A1 (CCNA1) after WY-14643-induced PPARα activation mainly occurred around the PV area. This study reveals that the zonal expression of PPARα targets and proliferation-related proteins is responsible for the spatial change of hepatocyte hypertrophy and proliferation after PPARα activation. These findings provide a new insight into the understanding of PPARα activation-induced liver enlargement and regeneration.
Keywords: hepatocyte hypertrophy; hepatocyte proliferation; hepatomegaly; peroxisome proliferator-activated receptor α; spatial distribution.
© 2023. The Author(s), under exclusive licence to Shanghai Institute of Materia Medica, Chinese Academy of Sciences and Chinese Pharmacological Society.
Conflict of interest statement
The authors declare no competing interests.
Figures
Similar articles
-
The reversal of PXR or PPARα activation-induced hepatomegaly.Toxicol Lett. 2024 Jun;397:79-88. doi: 10.1016/j.toxlet.2024.05.006. Epub 2024 May 10. Toxicol Lett. 2024. PMID: 38734220
-
Pregnane X receptor promotes liver enlargement in mice through the spatial induction of hepatocyte hypertrophy and proliferation.Chem Biol Interact. 2022 Nov 1;367:110133. doi: 10.1016/j.cbi.2022.110133. Epub 2022 Aug 27. Chem Biol Interact. 2022. PMID: 36030841
-
YAP-TEAD mediates PPAR α-induced hepatomegaly and liver regeneration in mice.Hepatology. 2022 Jan;75(1):74-88. doi: 10.1002/hep.32105. Epub 2021 Dec 15. Hepatology. 2022. PMID: 34387904 Free PMC article.
-
Hydrogen peroxide generation in peroxisome proliferator-induced oncogenesis.Mutat Res. 2000 Mar 17;448(2):159-77. doi: 10.1016/s0027-5107(99)00234-1. Mutat Res. 2000. PMID: 10725470 Review.
-
The PPARα-dependent rodent liver tumor response is not relevant to humans: addressing misconceptions.Arch Toxicol. 2018 Jan;92(1):83-119. doi: 10.1007/s00204-017-2094-7. Epub 2017 Dec 2. Arch Toxicol. 2018. PMID: 29197930 Free PMC article. Review.
Cited by
-
PPARα regulates YAP protein levels and activity by affecting its ubiquitination modification.BMC Biol. 2025 Feb 28;23(1):64. doi: 10.1186/s12915-025-02163-5. BMC Biol. 2025. PMID: 40022055 Free PMC article.
-
Molecular mechanisms in liver repair and regeneration: from physiology to therapeutics.Signal Transduct Target Ther. 2025 Feb 8;10(1):63. doi: 10.1038/s41392-024-02104-8. Signal Transduct Target Ther. 2025. PMID: 39920130 Free PMC article. Review.
-
Disrupting Poly(ADP-ribosyl)ating Pathway Creates Premalignant Conditions in Mammalian Liver.Int J Mol Sci. 2023 Dec 6;24(24):17205. doi: 10.3390/ijms242417205. Int J Mol Sci. 2023. PMID: 38139034 Free PMC article.
References
MeSH terms
Substances
LinkOut - more resources
Full Text Sources
Miscellaneous
