. 2023 May 16;6(1):528.
doi: 10.1038/s42003-023-04899-8.

Large libraries of single-chain trimer peptide-MHCs enable antigen-specific CD8+ T cell discovery and analysis

Affiliations

Large libraries of single-chain trimer peptide-MHCs enable antigen-specific CD8+ T cell discovery and analysis

William Chour et al. Commun Biol. .

Abstract

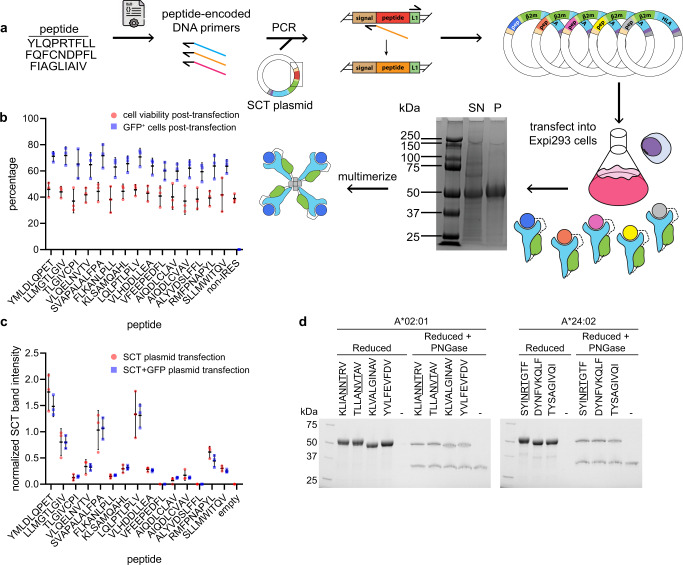
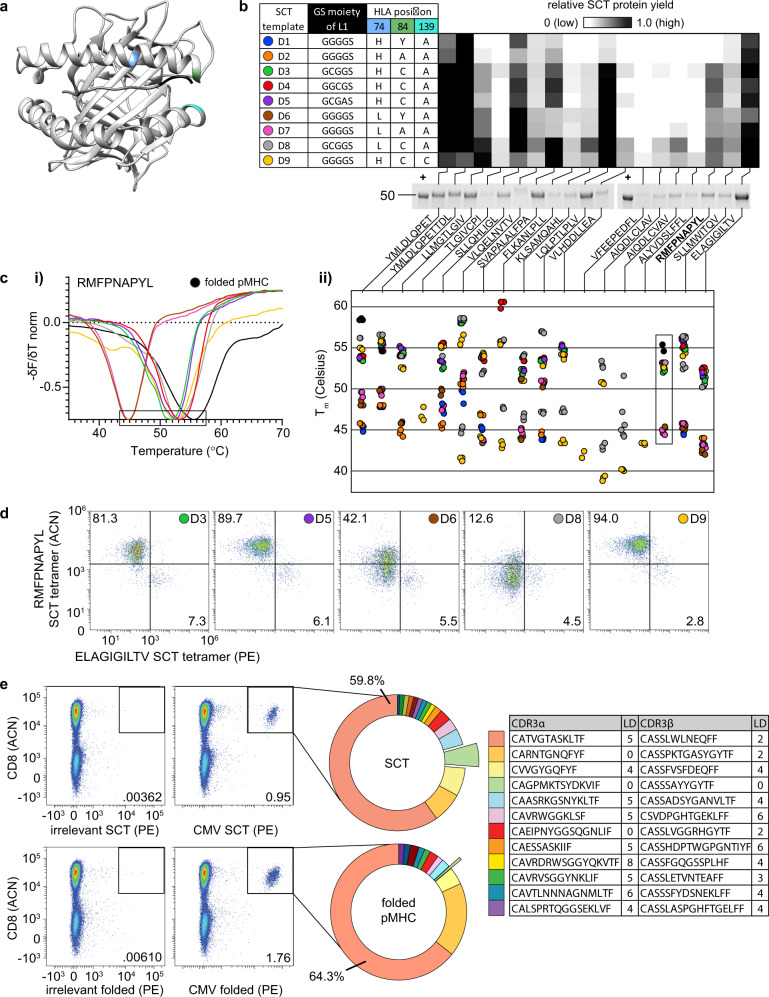
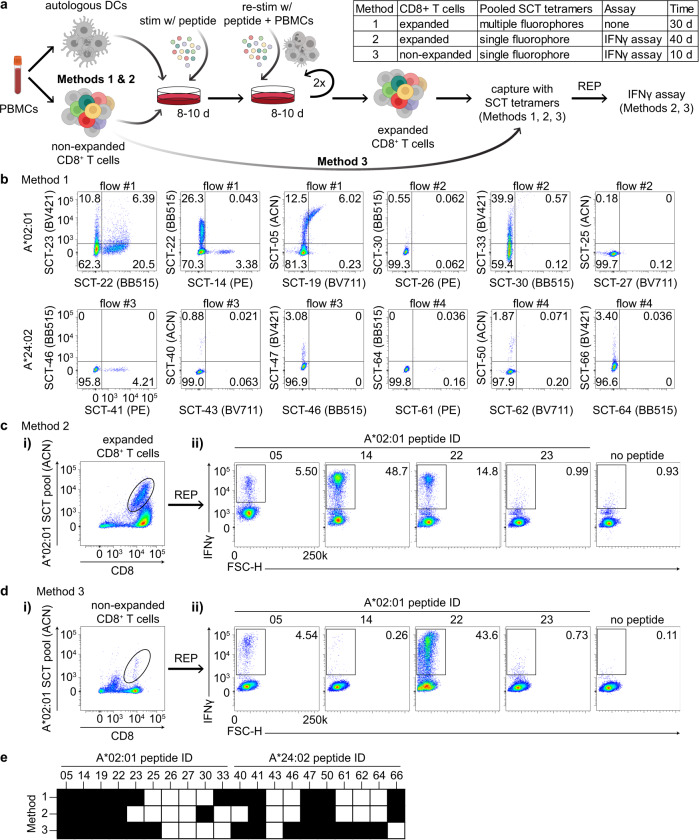
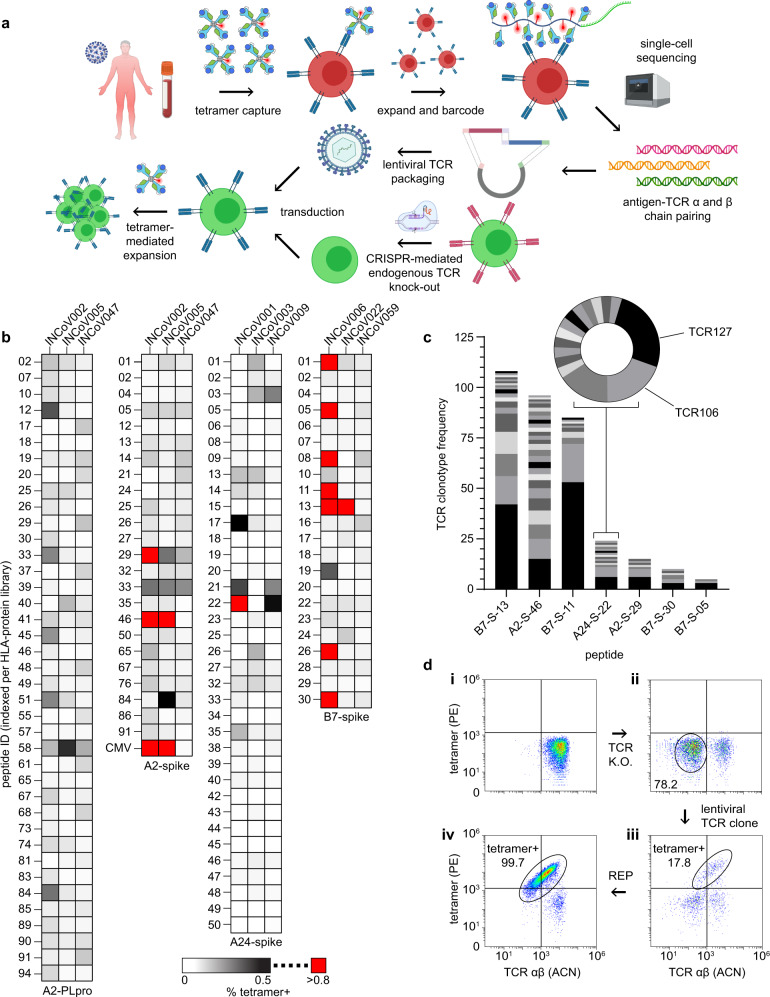
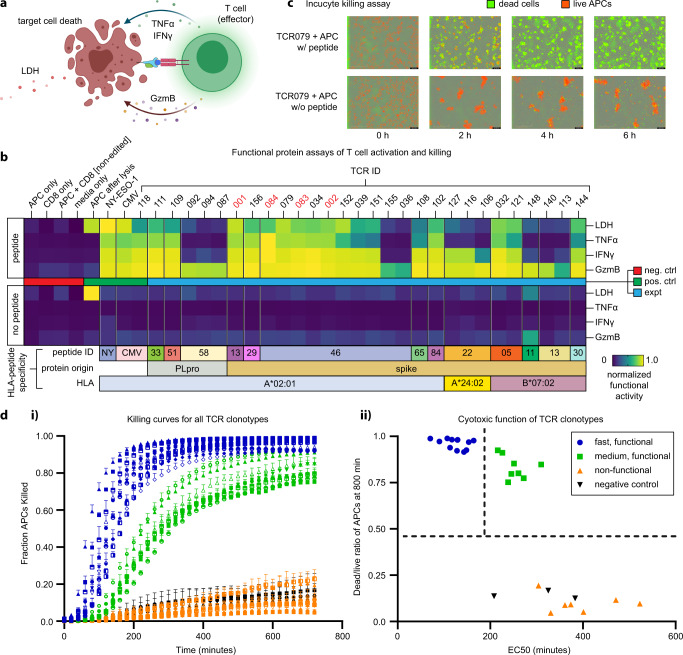
The discovery and characterization of antigen-specific CD8+ T cell clonotypes typically involves the labor-intensive synthesis and construction of peptide-MHC tetramers. We adapt single-chain trimer (SCT) technologies into a high throughput platform for pMHC library generation, showing that hundreds can be rapidly prepared across multiple Class I HLA alleles. We use this platform to explore the impact of peptide and SCT template mutations on protein expression yield, thermal stability, and functionality. SCT libraries were an efficient tool for identifying T cells recognizing commonly reported viral epitopes. We then construct SCT libraries to capture SARS-CoV-2 specific CD8+ T cells from COVID-19 participants and healthy donors. The immunogenicity of these epitopes is validated by functional assays of T cells with cloned TCRs captured using SCT libraries. These technologies should enable the rapid analyses of peptide-based T cell responses across several contexts, including autoimmunity, cancer, or infectious disease.


Conflict of interest statement

J.R.H. is a founder and board member of Isoplexis and PACT Pharma. P.D.G. is on the scientific advisory board of Celsius, Earli, Elpiscience, Immunoscape, Rapt, Metagenomi, and Nextech, was a scientific founder of Juno Therapeutics, and receives research support from Lonza. J.D.G. declared contracted research with Gilead, Lilly, and Regeneron and served on an advisory board for Gilead. The remaining authors declare no competing interests.

Figures

Fig. 1
Fig. 1. SCT production and quality control.
a Workflow of SCT production. Reduced SDS-PAGE gel showing expressed SCT protein (~50 kDa); SN supernatant, P His-Tag purified SCT. b Cell viability and transfection efficiency of SCT plasmid library. c SCT yield from each peptide element of the SCT plasmid library, with or without IRES-GFP reporter. Error bars represent standard deviation, n = 3 independent measurements. d Reduced SDS-PAGE gel of A*02:01 and A*24:02 SCTs pre- and post-PNGase treatment. NXT glycosylation motifs of peptides are underlined.
Fig. 2
Fig. 2. SCT optimization and characterization.
a Axial view of HLA-A*02:01 SCT crystal structure (RDB ID: 6APN). Highlighted regions of interest: H74 (blue), Y84 (green), A139 (cyan), and the first three amino acids of the L1 linker (black). b Table: L1 and HLA amino acid modifications for each SCT template. Heatmap: Relative expression of each SCT combination (n = 3), designated by template (row) and peptide (column), and exemplified by reduced SDS-PAGE of 18 SCTs constructed using design template D9. Previously expressed and a purified aliquot of WT1 SCT is used as a positive control (+) for band intensity quantification. c Thermal melting profiles of SCTs. The negative of the change in fluorescence over the change in temperature (−δF/δT) is measured for SCTs encoding WT1 peptide (c.i). Local minima representing Tm values (see the boxed region of WT1 plot) are plotted (c.ii) for each SCT template and peptide (n = 3). d WT1 SCTs constructed according to each of the six template designs were paired with a MART-1 SCT (D3 template) to identify cognate TCR-transduced cells. The number/color at the top right of each plot indicates the SCT template used for WT1 SCT tetramer in the flow assay. Percentages indicate the proportion of the total cell population captured in the WT1 SCT-positive quadrant. e Capture of CMV-specific T cells using SCT or refolded pMHC format. Unique paired TCR clonotypes identified by 10× single-cell sequencing of tetramer-positive cells. CDR3a and CDR3b sequences of the twelve most frequently captured clonotypes from SCT tetramer along with LD to publicly reported CMV-specific clonotypes from VDJdb are reported in the Table. L1 linker 1, WT1 RMFPNAPYL, MART-1 ELAGIGILTV, CMV NLVPMVATV, LD Levenshtein distance, VDJdb VDJ database, ACN allophycocyanin, PE phycoerythrin.
Fig. 3
Fig. 3. Identification of immunogenic peptides from non-expanded PBMCs using pooled SCT tetramers.
a Workflow of antigen-specific T-cell identification using SCT tetramers (created with BioRender.com). b Representative flow cytometry plots of CD8+ T cells captured by 5-color pooled SCT tetramers from peptide-stimulated and expanded CD8+ T cells (Method 1) (n = 10). c, d Representative flow cytometry plots of CD8+ T cells initially captured by single-color pooled SCT tetramers from peptide-stimulated and expanded CD8+ T cells (ci) (Method #2) or from non-stimulated, non-expanded CD8+ T cells (d.i) (Method #3). Subsequent flow plots represent IFNγ+ cells after peptide stimulation of expanded cells from the previously captured tetramer-positive subset (c.ii, d.ii). e, Binary mapping of peptides which elicit positive signal based upon tetramer binding (Method 1) or IFNγ release (Methods 2 and 3). Values in flow cytometry plots indicate the percentage of the total cell population captured within the quadrant or outlined box. Peptide sequences are found in Supplementary Table 2. REP rapid expansion protocol, BV421 Brilliant Violet 421 nm, BB515 Brilliant Blue 515 nm, PE phycoerythrin, ACN allophycocyanin, BV711 Brilliant Violet 711 nm.
Fig. 4
Fig. 4. Isolation and cloning of TCRs specific to SARS-CoV-2 epitopes across three Class I HLA alleles.
a Workflow for SCT-facilitated capture of SARS-CoV-2 antigen-specific CD8+ T cells, single-cell TCR sequencing, and TCR cloning into autologous T cells (created with BioRender.com). b SCT tetramer-positive CD8+ T cells from HLA-matched COVID participants for SCT libraries (n = 1). c Frequency of unique TCR clonotypes against peptides whose SCTs produced high % tetramer binding (red boxes of (b)). d Representative flow cytometry plots of T cell cloning workflow. Autologous T cells (d.i), T cells after CRISPR-mediated TCR knockout (d.ii), tetramer+ T cells after lentiviral TCR cloning (d.iii), tetramer+ T cells after sort and REP (d.iv). Peptide sequences are found in Supplementary Tables 3–6. A2 A*02:01, A24 A*24:02, B7 B*07:02, PLpro papain-like protease, P PLpro, S spike, PE phycoerythrin, ACN allophycocyanin, REP rapid expansion protocol.
Fig. 5
Fig. 5. Functional characterization of SARS-CoV-2-specific TCRs.
a Illustration of functional assays, including T cell-secreted markers of activation and cytotoxicity following antigen-specific activation, as well as the release of LDH following T cell killing of APCs (created with BioRender.com). b Heatmap representing measured levels of secreted or released proteins from T cell clonotypes with or without peptide stimulation (n = 2). TCRs indicated in red font were identified from healthy donors. c IncuCyte live-cell imaging of peptide stimulation and cell-killing activity. Scale bars in each panel represent 400 μm. d.i. Measurements of the fraction of dead APCs from IncuCyte kinetic imaging analysis of the TCR-engineered T cell clonotypes co-cultured with APCs. Error bars represent standard deviation from independent triplicate measurements. d.ii. Classification of T cell clonotypes by killing activities. TCR sequences are found in Supplementary Table 7. LDH lactate dehydrogenase, TNFα tumor necrosis factor α, IFNγ interferon γ, GzmB granzyme B, NY SLLMWITQC (NY-ESO-1), CMV NLVPMVATV, A2 A*02:01, B7 B*07:02, APC antigen-presenting cell, P PLpro, S spike.

Update of

References

    1. van Montfoort N, Aa van der E, Woltman AM. Understanding MHC class I presentation of viral antigens by human dendritic cells as a basis for rational design of therapeutic vaccines. Front. Immunol. 2014;5:182. - PMC - PubMed
    1. He X-H, Xu L-H, Liu Y. Procedure for preparing peptide-major histocompatibility complex tetramers for direct quantification of antigen-specific cytotoxic T lymphocytes. World J. Gastroenterol. 2005;11:4180–4187. doi: 10.3748/wjg.v11.i27.4180. - DOI - PMC - PubMed
    1. Rodenko B, et al. Generation of peptide–MHC class I complexes through UV-mediated ligand exchange. Nat. Protoc. 2006;1:1120–1132. doi: 10.1038/nprot.2006.121. - DOI - PubMed
    1. Toebes M, et al. Design and use of conditional MHC class I ligands. Nat. Med. 2006;12:246–251. doi: 10.1038/nm1360. - DOI - PubMed
    1. Bakker AH, et al. Conditional MHC class I ligands and peptide exchange technology for the human MHC gene products HLA-A1, -A3, -A11, and -B7. Proc. Natl Acad. Sci. USA. 2008;105:3825–3830. doi: 10.1073/pnas.0709717105. - DOI - PMC - PubMed

Publication types