. 2023 May 16;118(1):19.
doi: 10.1007/s00395-023-00989-0.

In-ovo echocardiography for application in cardiovascular research

Affiliations

In-ovo echocardiography for application in cardiovascular research

Niklas Hegemann et al. Basic Res Cardiol. .

Abstract

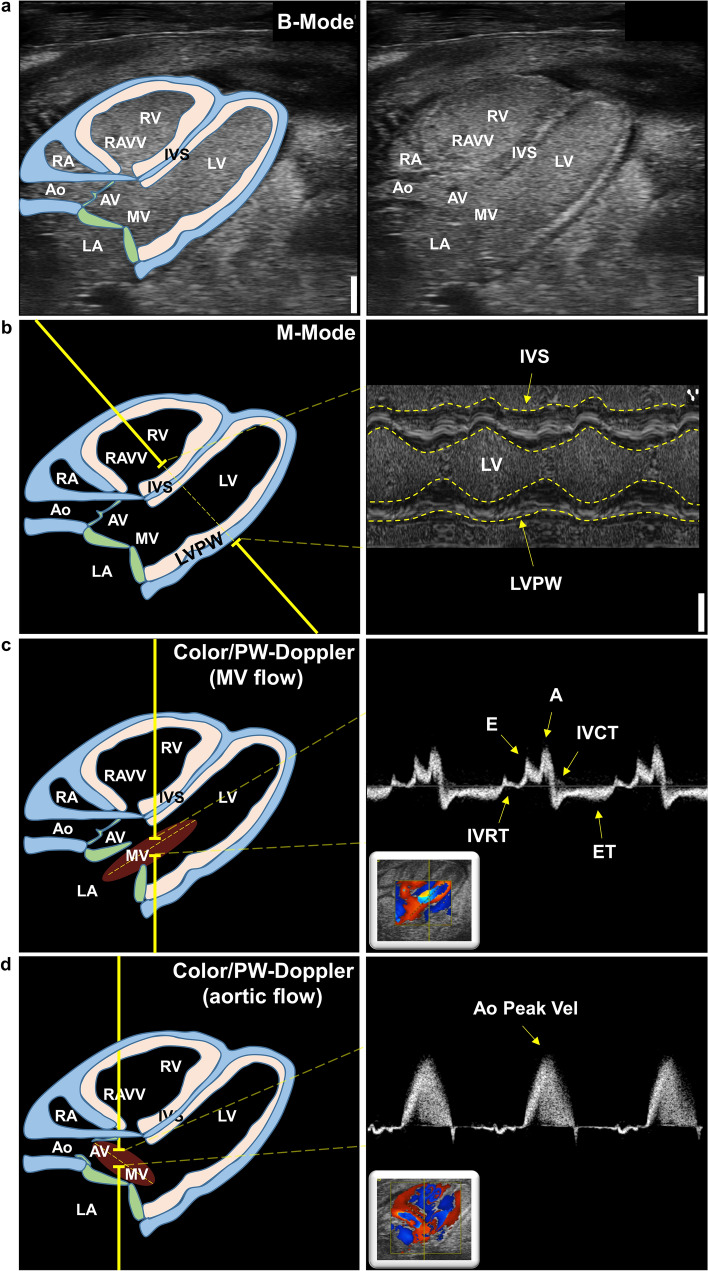
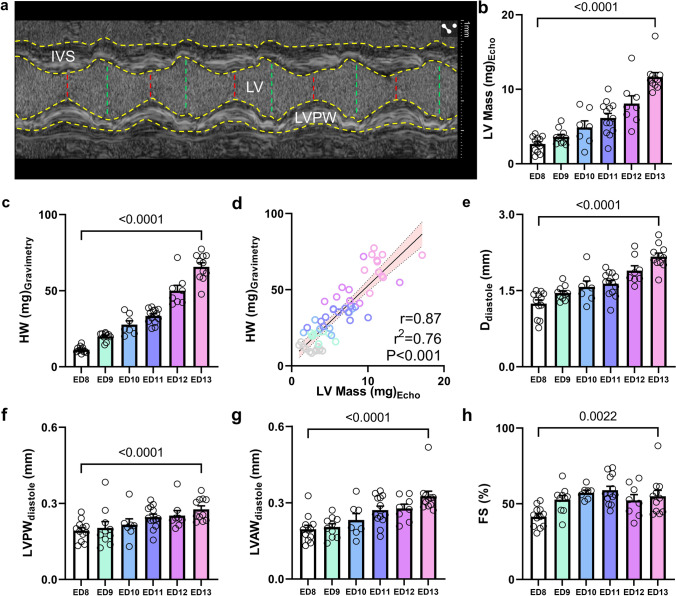
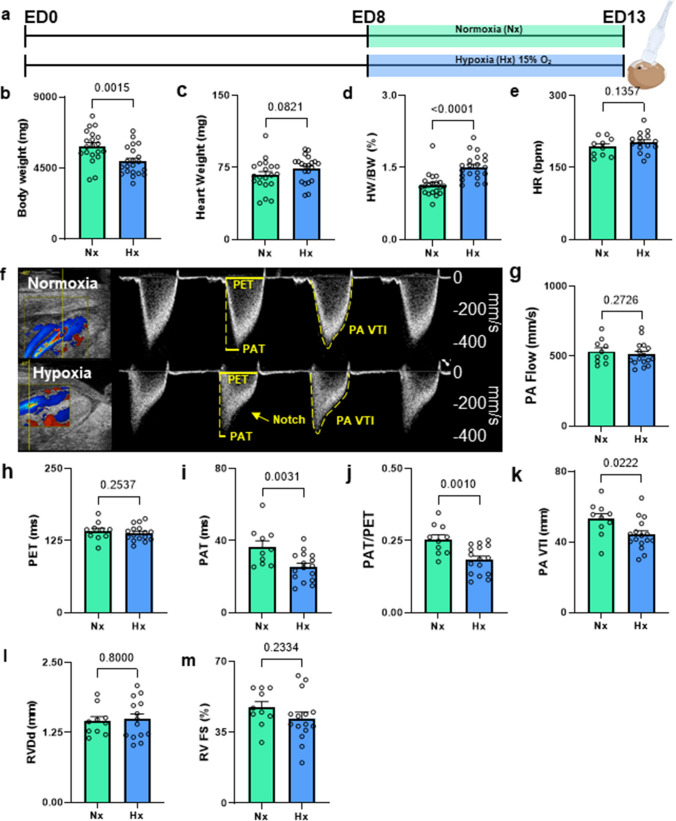
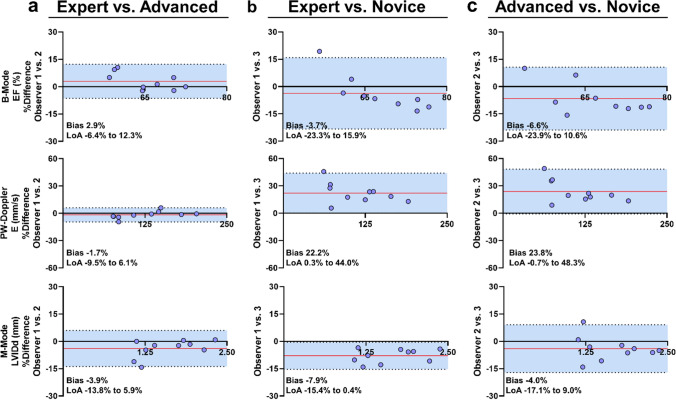
Preclinical cardiovascular research relies heavily on non-invasive in-vivo echocardiography in mice and rats to assess cardiac function and morphology, since the complex interaction of heart, circulation, and peripheral organs are challenging to mimic ex-vivo. While n-numbers of annually used laboratory animals worldwide approach 200 million, increasing efforts are made by basic scientists aiming to reduce animal numbers in cardiovascular research according to the 3R's principle. The chicken egg is well-established as a physiological correlate and model for angiogenesis research but has barely been used to assess cardiac (patho-) physiology. Here, we tested whether the established in-ovo system of incubated chicken eggs interfaced with commercially available small animal echocardiography would be a suitable alternative test system in experimental cardiology. To this end, we defined a workflow to assess cardiac function in 8-13-day-old chicken embryos using a commercially available high resolution ultrasound system for small animals (Vevo 3100, Fujifilm Visualsonics Inc.) equipped with a high frequency probe (MX700; centre transmit: 50 MHz). We provide detailed standard operating procedures for sample preparation, image acquisition, data analysis, reference values for left and right ventricular function and dimensions, and inter-observer variabilities. Finally, we challenged incubated chicken eggs with two interventions well-known to affect cardiac physiology-metoprolol treatment and hypoxic exposure-to demonstrate the sensitivity of in-ovo echocardiography. In conclusion, in-ovo echocardiography is a feasible alternative tool for basic cardiovascular research, which can easily be implemented into the small animal research environment using existing infrastructure to replace mice and rat experiments, and thus, reduce use of laboratory animals according to the 3R principle.

Keywords: 3R; Alternative methods; Chicken embryo; Echocardiography; Preclinical research.


Conflict of interest statement

The authors declare no competing interest.

Figures

Fig. 1
Fig. 1
iCE incubation scheme and experimental outline. a iCEs were incubated starting ED 0 in a special incubator at 37.8 °C and > 58% humidity (Hm). On ED 3, the egg poles were pierced, and 6 ml of albumin were removed to lower the chorioallantoic membrane. b, c On ED 8 to ED 13 iCEs were subject to transthoracic echocardiography in-ovo. d Representative echocardiographic B-Mode images in the modified five-chamber view (mod5CV) of iCEs on ED 8 to ED 13. Yellow contours depict left-ventricular endocardial borders. RV  right ventricle, LV  left ventricle. Scale bar = 1 mm
Fig. 2
Fig. 2
Echocardiographic image acquisition in iCEs. a Representative B-Mode image in the modified five-chamber view (mod5CV) with schematic outline of relevant structures (left panel). b Schematic B-Mode image of the mod5CV with instructions for left-ventricular (LV) M-Mode imaging (left panel) and representative M-Mode tracing of interventricular septum, LV lumen, and LV posterior wall (right panel). c Schematic B-Mode image of the mod5CV with instructions for color/pulsed-wave Doppler of the trans-mitral inflow (left panel) with representative color Doppler and flow profile (right panel). d Schematic B-Mode image of the mod5CV with instructions for color/pulsed-wave Doppler of the aortic flow (left panel) with representative color Doppler and flow profile (right panel). Ao  aorta, AV  aortic valve, MV  mitral valve, LA  left atrium, LV  left ventricle, RA  right atrium, RV  right ventricle, RAVV  right atrioventricular valve, IVS  interventricular septum, LVPW  left-ventricular posterior wall, E  early (passive) diastolic inflow, A  active inflow due to atrial contraction, IVRT  isovolumic relaxation time, IVCT  isovolumic contraction time, ET  ejection time, Ao Peak Vel  peak aortic velocity. Scale bar = 1 mm
Fig. 3
Fig. 3
M-Mode imaging of the left ventricle on ED 8 to ED 13. a Representative M-mode tracing of the left ventricle (LV) with interventricular septum (IVS), LV lumen and LV posterior wall (LVPW). Yellow contours indicate myocardial borders. LV diameters in diastole are shown in green, systole in red. b Echocardiography-derived calculated LV mass. c Gravimetrically measured heart weight (HW). d Pearson’s correlation between the two measurements from (b) and (c). e LV diameter (D) in diastole. f LVPW thickness in diastole. g LV anterior wall (LVAW) thickness in diastole. h Fractional shortening of the LV (%). N = 7–13 per group. Data are presented as mean ± SEM. Statistical analysis was performed for ED 8 vs ED 13 using student’s t test or, where applicable, Mann–Whitney test
Fig. 4
Fig. 4
B-Mode imaging of the left ventricle in the modified five-chamber view (mod5CV) on ED 8 to ED 13. a Representative B-Mode modified five chamber views (mod5CV) with tracing of the LV endocardial borders (yellow) and LV area (blue) in systole and diastole. b Heart rate (HR) in beats per minute (bpm). c Stroke volume (SV). d Cardiac output (CO). e) Left-ventricular ejection fraction (LVEF). f) LV fractional shortening (FS). g LV end-diastolic volume (Vdiastole). h LV end-systolic volume (Vsystole). Ao  aorta, LA  left atrium, LV  left ventricle, RA  right atrium, RV  right ventricle. N = 7–13 per group. Data are presented as mean ± SEM. Statistical analysis was performed for ED 8 vs ED 13 using student’s t test or, where applicable, Mann–Whitney test
Fig. 5
Fig. 5
Pulsed-wave Doppler analysis of transmitral blood flow. a Representative transmitral flow profiles at ED 8 and ED 13 of incubation. b Early diastolic inflow – E wave (E). c Late diastolic inflow due to atrial contraction—A wave (A). d E/A ratio. e Ejection time (ET) during which blood is ejected towards the aorta. f Isovolumic relaxation time (IVRT). g Isovolumic contraction time (IVCT). N = 7–13 per group. Data are presented as mean ± SEM. Statistical analysis was performed for ED 8 vs ED 13 using student’s t test or, where applicable, Mann–Whitney test
Fig. 6
Fig. 6
Echocardiographic right-ventricular image acquisition in iCEs. a Schematic mod5CV as described earlier in Fig. 2 with left ventricle (LV), left atrium (LA), right ventricle (RV), right atrium (RA) and aorta (Ao) (left panel) and RV M-Mode tracing (right panel). b B-Mode image of the mod5CV with focus shifted to the pulmonary artery (PA). c Schematic B-Mode image of the mod5CV with focus shifted to the PA with instructions for color/pulsed-wave Doppler of the pulmonary flow (left panel) with representative color Doppler and flow profile (right panel). Ao  aorta, AV  aortic valve, MV  mitral valve, LA  left atrium, LV  left ventricle, RA  right atrium, RV  right ventricle, RAVV  right atrioventricular valve, IVS  interventricular septum, LVPW  left-ventricular posterior, PV  pulmonary valve, PA  pulmonary artery, RVFW  RV free wall, IVS  interventricular septum, LV  left ventricle, MV  mitral valve, LA  left atrium, PET  pulmonary ejection time, PAT  pulmonary acceleration time, PA Peak Vel = pulmonary peak velocity, PA VTI  PA velocity time integral. Scale bar = 1 mm
Fig. 7
Fig. 7
Echocardiographic right-ventricular and pulmonary artery measurements in iCEs ED 8 to ED 13. a Representative right-ventricular (RV) M-Mode. b RV diastolic diameter (RVDd). c RV fractional shortening (RV FS). d Representative pulmonary artery (PA) flow with pulmonary ejection time (PET), pulmonary acceleration time (PAT) and peak pulmonary flow velocity (PA peak Vel). e PA peak flow velocity, f PAT. g PET h PAT/PET ratio and i) PA Velocity Time Integral (VTI). N = 7–10 for (b) and (c); N = 5–7 fpor (e) to (h). Data are presented as mean ± SEM. Statistical analysis in (b) and (c) was performed for ED8 vs ED 13 using student’s t test or, where applicable, Mann–Whitney test. RV  right ventricle, PA  pulmonary artery, RVFW  RV free wall, PET  pulmonary ejection time, PAT  pulmonary acceleration time, PA Peak Vel  pulmonary peak velocity, PA VTI  PA velocity time integral
Fig. 8
Fig. 8
Echocardiographic evaluation of acute β1-selective adrenergic inhibition by metoprolol in the iCE on ED 13. a Experimental outline. Eggs were incubated for 13 days as described earlier. After acquisition of baseline images (approx. 5 min duration), animals were treated with a single 400 µg dose of metoprolol pipetted onto the chorioallantoic membrane. After 10 min, post-treatment image acquisition was performed. b Representative B-Mode five-chamber view images at baseline and after metoprolol (Meto) treatment showing left ventricular endocardial borders (yellow dotted line) at end-diastole and end-systole. Orange arrows indicate myocardial contraction. Scale bar = 1 mm. c Stroke volume (SV). d Heart rate in beats per minute (bpm). e Cardiac output (CO). f Left-ventricular ejection fraction (EF). g LV fractional shortening (acquired in B-Mode) (FSB-Mode). h End-diastolic volume (EDV). i End-systolic volume (ESV). j Representative color (left) and pulsed-wave Doppler recordings (right) of the transmitral blood flow from eggs at baseline and after metoprolol treatment. k Early diastolic inflow – E wave (E). l Late diastolic inflow due to atrial contraction – A wave (A). m E/A ratio. n Isovolumic relaxation time (IVRT). o Representative color (left) and pulsed-wave Doppler recordings (right) of the aortic blood flow at baseline and after metoprolol treatment. p Peak aortic velocity. N = 6–8 per group. Left panels represent paired data at baseline and after Meto treament, right panels present data as mean ± SEM. Statistical analysis was performed by paired student’s t test
Fig. 9
Fig. 9
Gravimetric and echocardiographic evaluation of iCE after 5 days of hypoxic exposure. a Experimental outline. On ED 8, a subset of iCEs was placed into a hypoxic incubator with 15% O2. On ED 13, echocardiography was performed. b Total iCE body weight. c Total heart weight. d Heart weight (HW) to body weight (BW) ratio. e Heart rate (HR) in beats per minute (bpm). f Representative Color-Doppler and pulsed-wave Doppler images of the pulmonary artery flow in normoxic (Nx) and hypoxic (Hx) eggs. g Pulmonary artery (PA) flow. h Pulmonary ejection time (PET). i Pulmonary acceleration time (PAT). j PAT/PET ratio. k Pulmonary artery velocity time integral. l RV diastolic diameter (RVDd). m RV fractional shortening (RV FS). N = 20–21 per group for (a) and N = 10–16 for (b–m). Data are presented as mean ± SEM. Statistical analysis was performed by one-tailed unpaired student’s t test or Mann–Whitney test where applicable. PET  pulmonary ejection time, PAT  pulmonary acceleration time, PA Peak Vel   pulmonary peak velocity, PA VTI  PA velocity time integral, RVDd   RV diastolic diameter, RV FS   RV fractional shortening
Fig. 10
Fig. 10
Echocardiography inter-observer analysis between three independent users. Inter-observer analysis was performed by Blant–Altmann analysis. Three independent echocardiography users of different training levels (observer 1: expert observer 2: advanced observer 3: novice) assessed images from iCEs at ED 9 and ED 13 for left ventricular (LV) ejection fraction (EF) from B-Mode images, early mitral inflow velocity (E) from pulsed wave (PW) Doppler recordings in the LV, and LV inner diameter in diastole (LVIDd) in M-Mode images of the LV (N = 10). a Comparison between expert and advanced user. b Comparison between expert and novice user. c Comparison between advanced and novice user. Statistical analysis was performed by Blant–Altmann plots with indication of observer bias and 95% limits of agreement (LoA)

References

    1. Arkles JS, Opotowsky AR, Ojeda J, Rogers F, Liu T, Prassana V, Marzec L, Palevsky HI, Ferrari VA, Forfia PR. Shape of the right ventricular Doppler envelope predicts hemodynamics and right heart function in pulmonary hypertension. Am J Respir Crit Care Med. 2011;183:268–276. doi: 10.1164/rccm.201004-0601OC. - DOI - PubMed
    1. Benslimane FM, Alser M, Zakaria ZZ, Sharma A, Abdelrahman HA, Yalcin HC. Adaptation of a mice doppler echocardiography platform to measure cardiac flow velocities for embryonic chicken and adult zebrafish. Front Bioeng Biotechnol. 2019;7:96. doi: 10.3389/fbioe.2019.00096. - DOI - PMC - PubMed
    1. Beyhoff N, Brix S, Betz IR, Klopfleisch R, Foryst-Ludwig A, Krannich A, Stawowy P, Knebel F, Grune J, Kintscher U (2017) Application of speckle-tracking echocardiography in an experimental model of isolated subendocardial damage. J Am Soc Echocardiogr 30:1239–1250 e1232 10.1016/j.echo.2017.08.006 - PubMed
    1. Bhattacharya PT, Troutman GS, Mao F, Fox AL, Tanna MS, Zamani P, Grandin EW, Menachem JN, Birati EY, Chirinos JA, Mazimba S, Smith KA, Kawut SM, Forfia PR, Vaidya A, Mazurek JA. Right ventricular outflow tract velocity time integral-to-pulmonary artery systolic pressure ratio: a non-invasive metric of pulmonary arterial compliance differs across the spectrum of pulmonary hypertension. Pulm Circ. 2019;9:2045894019841978. doi: 10.1177/2045894019841978. - DOI - PMC - PubMed
    1. Burggren W, Khorrami S, Pinder A, Sun T. Body, eye, and chorioallantoic vessel growth are not dependent on cardiac output level in day 3–4 chicken embryos. Am J Physiol Regul Integr Comp Physiol. 2004;287:R1399–1406. doi: 10.1152/ajpregu.00086.2004. - DOI - PubMed

Publication types

LinkOut - more resources