. 2023 Jul 5;31(7):2220-2239.
doi: 10.1016/j.ymthe.2023.05.012. Epub 2023 May 16.

Extracellular communication between brain cells through functional transfer of Cre mRNA mediated by extracellular vesicles

Affiliations

Extracellular communication between brain cells through functional transfer of Cre mRNA mediated by extracellular vesicles

David Rufino-Ramos et al. Mol Ther. .

Abstract

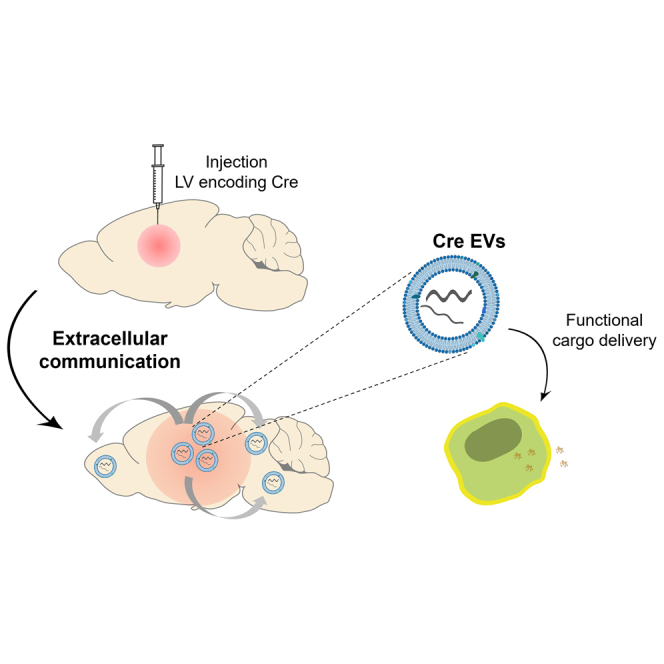
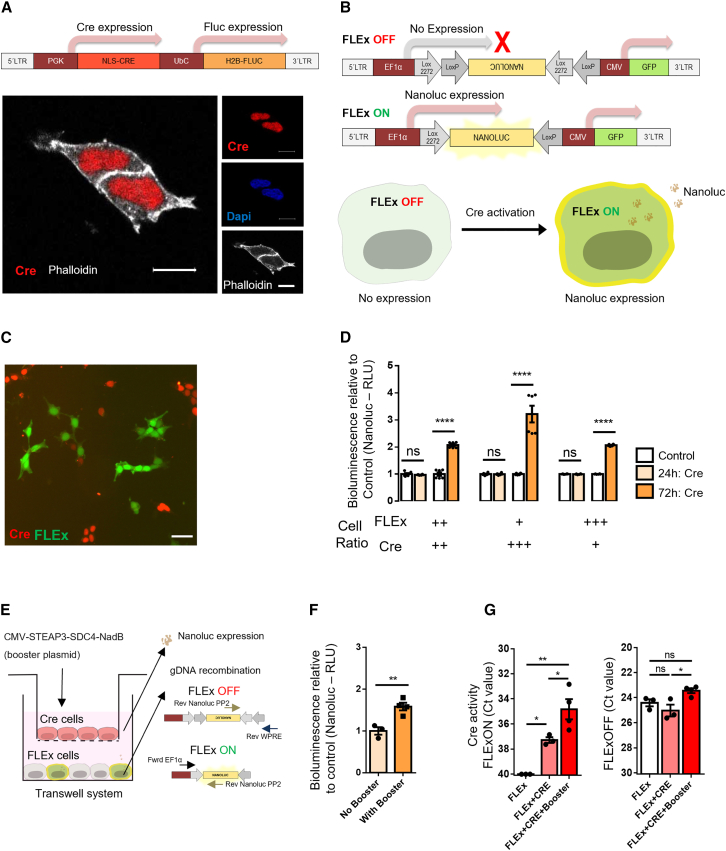
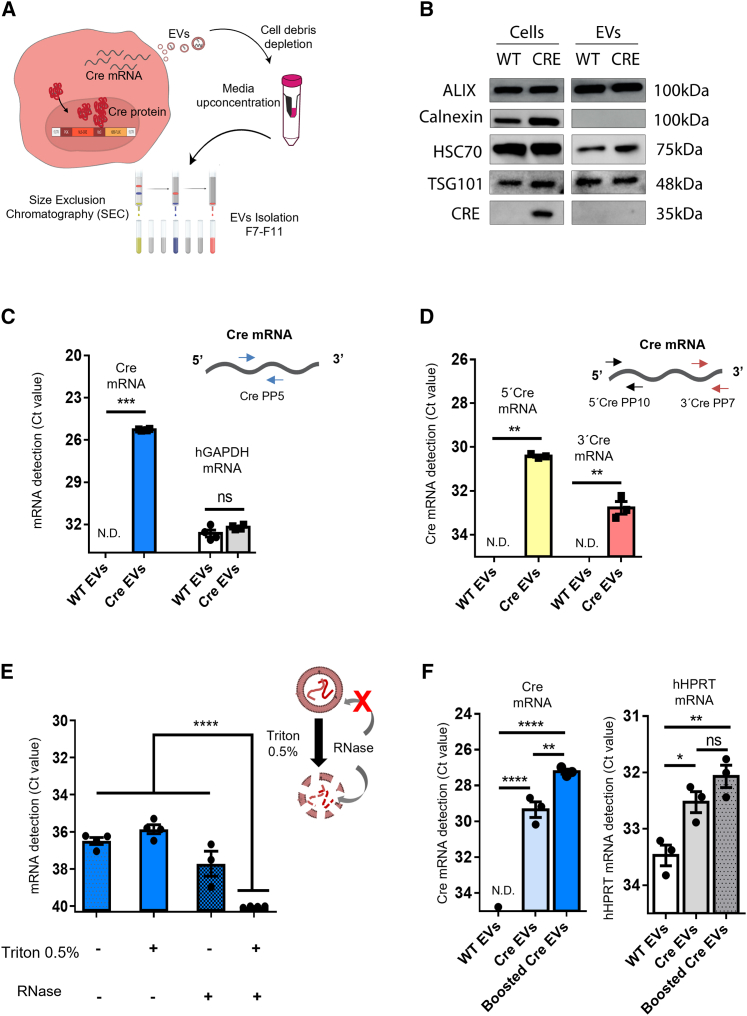
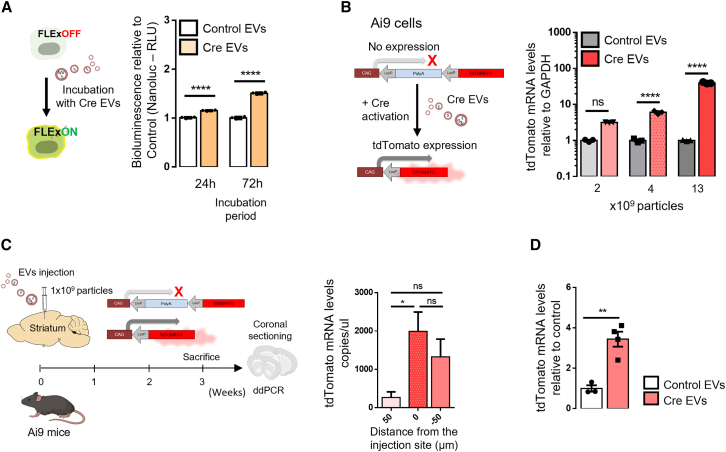
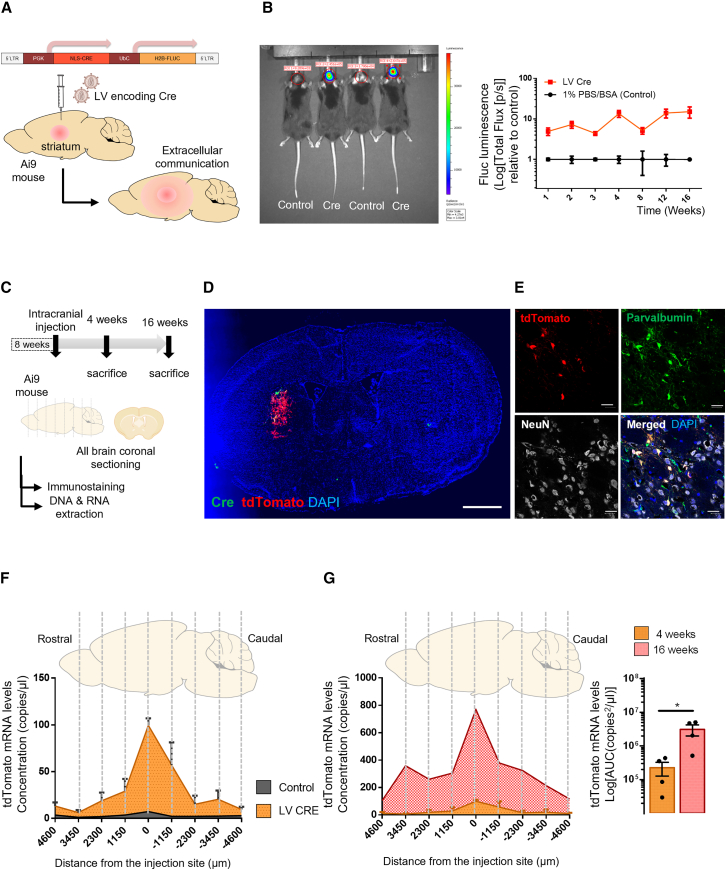
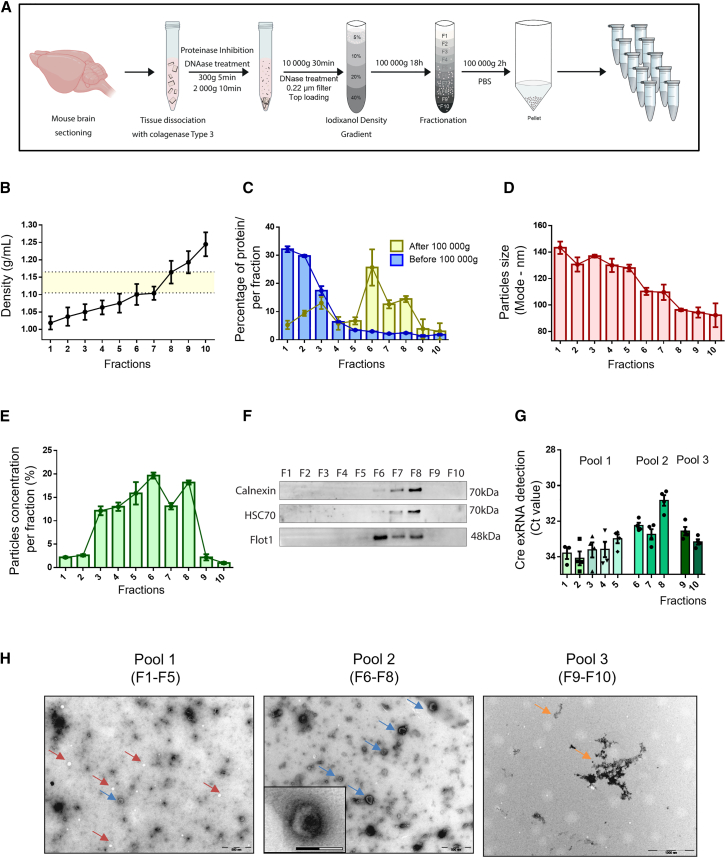
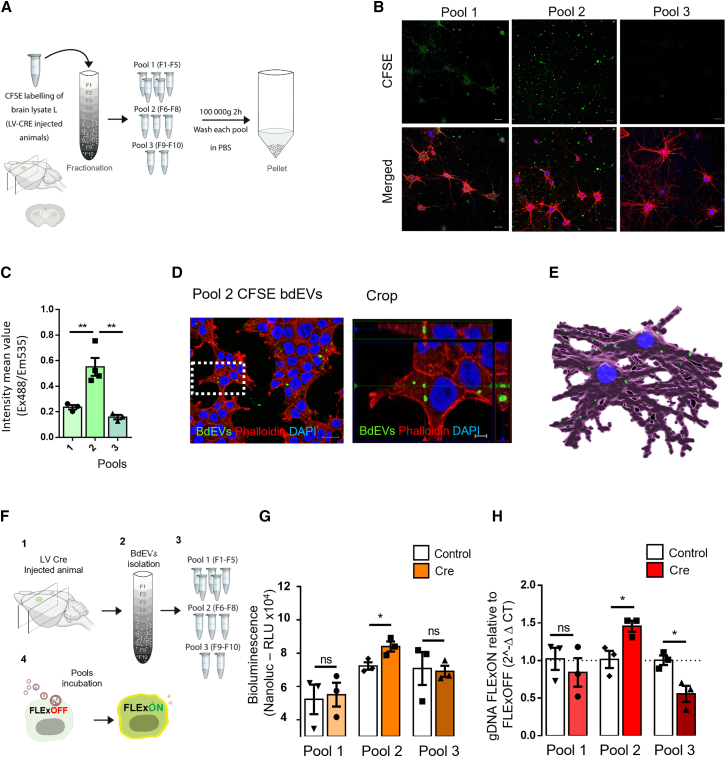
In the central nervous system (CNS), the crosstalk between neural cells is mediated by extracellular mechanisms, including brain-derived extracellular vesicles (bdEVs). To study endogenous communication across the brain and periphery, we explored Cre-mediated DNA recombination to permanently record the functional uptake of bdEVs cargo over time. To elucidate functional cargo transfer within the brain at physiological levels, we promoted the continuous secretion of physiological levels of neural bdEVs containing Cre mRNA from a localized region in the brain by in situ lentiviral transduction of the striatum of Flox-tdTomato Ai9 mice reporter of Cre activity. Our approach efficiently detected in vivo transfer of functional events mediated by physiological levels of endogenous bdEVs throughout the brain. Remarkably, a spatial gradient of persistent tdTomato expression was observed along the whole brain, exhibiting an increment of more than 10-fold over 4 months. Moreover, bdEVs containing Cre mRNA were detected in the bloodstream and extracted from brain tissue to further confirm their functional delivery of Cre mRNA in a novel and highly sensitive Nanoluc reporter system. Overall, we report a sensitive method to track bdEV transfer at physiological levels, which will shed light on the role of bdEVs in neural communication within the brain and beyond.

Keywords: Cre-loxP; Nanoluc; brain; central nervous system; exRNA; exosomes; extracellular communication; extracellular vesicles; tdTomato.


Conflict of interest statement

Declaration of interests The authors declare no competing interests.

Figures

None
Graphical abstract
Figure 1
Figure 1
Extracellular communication shown through functional transfer of Cre activity in vitro (A) Top: schematic representation of the lentiviral construct expressing nuclear localization signal (NLS) CRE (1,026 bp) under control of PGK promoter, and H2B firefly luciferase (Fluc) (1,650 bp) under control of UBC promoter. Cre and Fluc genes contain a NLS and H2B, respectively, at the N terminus that shuttles the proteins to the nucleus. Bottom: representative immunofluorescent image from confocal microscopy of HEK293T cells stably expressing Cre protein (red) mainly in the nucleus (blue). Actin filaments in cytoplasm were stained with phalloidin (white). Scale bar, 10 μm. (B) Schematic representation of FLExNanoluc switch used to generate a sensitive Cre reporter system. The FLExNanoluc in the OFF-state does not allow Nanoluciferase (Nanoluc) expression, because the gene is backward in the construct. Upon Cre activation, the Nanoluc gene flips and becomes in frame with the EF1α promoter in the ON-state. The resulting Nanoluc expression generates detectable bioluminescence in both cells and medium. (C) Co-culture of HEK293T cells stably expressing Cre (red) and HEK293T cells stably expressing FLExNanoluc and GFP (green) for 72 h. Scale bar, 20 μm. (D) Bioluminescence evaluation of Nanoluc secreted in medium. Nanoluc signal in the cell medium detected after 24 and 72 h of co-culture. Cells were cultured in three FLExNanoluc:Cre ratios (1:1, 1:3, and 3:1). The white bars represent a control condition in which FLExNanoluc reporter cells were co-cultured with WT HEK293T cells (no expression of Cre). Cre activity is represented by a bioluminescence signal relative to control (n = 6). Data are presented as mean ± SEM and compared by unpaired t test, ∗∗∗∗p < 0.0001. (E) Transwell system (1 μm pore inserts) with Cre cells seeded on the apical side of the upper chamber and previously transfected with CMV-STEAP3-SDC4-NadB plasmid to boost small EV production and FLExNanoluc reporter cells seeded in the lower chamber, with the latter showing recombination mediated by EVs. (F) Cre activity in boosted condition relative to non-boosted condition is represented by Nanoluc bioluminescence (RLU) in FLEx cells (n = 3). Data are presented as mean ± SEM and compared by unpaired t test, ∗∗p < 0.01. (G) Evaluation of gDNA recombination by RT-PCR showing Ct values of non-recombined DNA (FLExOFF) and recombined DNA (FLExON) (n = 3/4). FLEx condition (white bar) was used to establish a baseline condition corresponding to no recombination. Data represented as Ct values obtained in each sample condition. Data are presented as mean ± SEM and compared by one-way ANOVA followed by Tukey’s multiple comparison test (F = 19.72, F = 6.956); ∗p < 0.05, ∗∗p < 0.01.
Figure 2
Figure 2
Cre activity is mediated by transfer of Cre mRNA through EVs (A) Schematic representation of EV isolation by size exclusion chromatography (SEC). In brief, EVs were isolated from the medium of HEK293T stably expressing Cre, cell debris was removed (300 × g × 10 min) and medium concentrated (100 kDa filter) to a final volume of 500 μL and then loaded onto a qEV Original SEC column. Five EV-enriched fractions of 500 μL were collected (fractions 7–11). (B) Western blotting of equimolar amounts of protein from cells and their derived EVs shows the positive markers Alix, HSC70, and TSG101 and undetectable levels of the ER marker calnexin. Cre protein is present in Cre donor cells but was not detectable in EVs from those cells. (C) Cre mRNA is detected in Cre EVs, but not WT EVs (n = 4). hGAPDH was detected in both conditions. Data are presented as Ct values, mean ± SEM and compared by unpaired t test with Welch’s correction. ∗∗∗p < 0.001; ns, not significant. (D) 5′ and-3′ regions of Cre exRNA are detected in Cre EVs, but not in WT EVs (n = 3). Data are presented as Ct values, mean ± SEM and compared by unpaired t test with Welch’s correction. ∗∗p < 0.01. (E) Cre EVs treated with RNase A in the presence or absence of 0.5% Triton X-100 showed that Cre-exRNA is predominantly protected inside EVs (n = 4). Data are presented as mean ± SEM and compared by ordinary one-way ANOVA followed by Dunnett’s multiple comparison test (F = 493.4). ∗∗∗∗p < 0.0001. (F) CMV-STEAP3-SDC4-NadB booster plasmid increases EV production and Cre exRNA detection. hHPRT was used as a housekeeping control. Data are presented as mean ± SEM and compared by ordinary one-way ANOVA followed by Sidak’s multiple comparisons test (F = 192.4). ∗p < 0.05, ∗∗p < 0.01, ∗∗∗p < 0.001; ns, not significant.
Figure 3
Figure 3
Concentrated EVs transfer functional Cre mRNA in vitro and in vivo (A) Cre EVs transfer functional Cre mRNA to FLEx reporter cells over time. FLEx reporter cells were incubated with Cre EVs and Nanoluc bioluminescence evaluated in culture medium 24 and 72 h after incubation. Cre activity is represented by bioluminescence signal relative to control (incubated with WT EVs). Data are presented as means ± SEM and compared by unpaired t test. ∗∗∗∗p < 0.0001. (B) Cre EVs transfer functional Cre exRNA to Ai9 cells in a dose-dependent manner. Schematic illustration of Ai9 reporter in which tdTomato expression is prevented by a stop cassette between the promoter and the coding sequence. Removal of the stop cassette by Cre activation results in tdTomato expression. Bar graphs represent tdTomato expression levels evaluated by RT-digital droplet PCR (ddPCR) post-incubation with three different doses of Cre-EVs (2.2, 4.4, and 13.1 × 109 particles) for 72 h. Data are presented as means ± SEM and compared unpaired t test. ∗∗∗∗p < 0.0001. (C) Cre mRNA is functionally delivered to the brain of Ai9 mice. Schematic illustration of Cre EVs intracranially injected in Ai9 reporter mice. Three weeks post-injection, tdTomato mRNA levels in coronal brain sections were evaluated through ddPCR to detect the injection site of Cre EVs (n = 4). Data are presented as tdTomato copies/μL mean ± SEM and compared by one-way ANOVA followed by Tukey’s multiple comparisons test (F = 5.641). ∗p < 0.05; ns, not significant. (D) Cre activity of exogenous EVs in brain. Control EVs (from HEK293T) or Cre EVs injected intracranially into Ai9 mice were compared for Cre activity in the coronal sections at the injection site in the brain. tdTomato expression at the injection site in the striatum of animals were evaluated by ddPCR (control n = 3 and Cre EVs n = 4). Data are presented as mean ± SEM and compared by unpaired t test. ∗∗p < 0.01.
Figure 4
Figure 4
Cre activity within the brain is shown through long-term transduction of neurons in vivo (A) Generation of an endogenous brain source of Cre EVs upon intracranial injection of lentiviral vectors (LVs) into the striatum of Ai9 mice. (B) Firefly luciferase bioluminescence was used to monitor transduced brain cells in living mice. Stable production of Cre and Fluc in the brain was monitored by bioluminescence in vivo from 1 to 16 weeks following intracranial injection of LVs. (C) Brain sample processing. Ai9 animals intracranially injected with LV encoding Cre were sacrificed 4 and 16 weeks post-injection. Whole-brain coronal sectioning was performed, and sections processed for immunostaining or DNA/RNA extraction. (D) Immunofluorescence of coronal sections at the injection site at 4 weeks post-intracranial transduction. Brain cells expressing Cre (green) and tdTomato (red) upon intracranial injection of lentivirus encoding Cre in the striatum. Analysis performed with a Keyence BZ-X810 microscope 20×. Scale bar, 200 μm (injection site). (E) tdTomato-positive cells co-localize with parvalbumin and NeuN suggesting the majority of the transduced cells are inhibitory neurons. Nucleus is represented by DAPI staining. Images are representative of a group of five Ai9 animals. Analysis performed with a laser confocal microscopy equipped with Plan-Apochromat 40×/1.40 Oil DIC M27 (420782-9900). Scale bar, 20 μm (neurons). (F) Cre activity profile in the Ai9 mouse brain 4 weeks after LV injection. Whole-brain coronal sections were used to compare tdTomato mRNA expression levels in the brains of Ai9 mice injected with LV Cre (orange) or 1% PBS/BSA (gray). The highest tdTomato signal was detected at the injection site, decreasing in distal rostral and caudal regions (n = 4). Data are presented as tdTomato copies/μL, means ± SEM. (G) Cre activity in the Ai9 mouse brain increases over time. Comparison between tdTomato expression in the whole brain of LV Cre-injected mice after 4 weeks (orange) or 16 weeks (red). Area under the curve (AUC) of tdTomato expression among the two conditions is shown in copies × μm/μL, means ± SEM and compared by unpaired t test. ∗p < 0.05.
Figure 5
Figure 5
Cre mRNA is detected in brain-derived EVs extracted from the brain (A) Schematic illustration of the protocol used to isolate brain-derived EVs (bdEVs). (B) Density distribution of 10 fractions as result of iodixanol gradient centrifugation at 100,000 × g for 18 h. EV-enriched fractions were isolated in densities ranging from 1.105 to 1.165 g/mL (middle region) (n = 10). (C) Quantification of protein amount per fraction (in percentage) before and after 100,000 × g purification step. Before 100,000 × g purification step (blue bars), protein is highly enriched in the first fractions decreasing until fraction 10. After 100,000 × g purification step (yellow bars), the majority of free protein was washed out and the highest percentage of protein was located in EV fractions 6, 7, and 8 (n = 4). (D) Particle size distribution of each fraction (represented by mode) was evaluated by nanoparticle tracking analysis (NTA) (red bars). Fraction 1 showed the higher mode with 140 nm and decreasing in each fraction until fraction 10, which showed the mode of 90 nm (n = 3). (E) Particle concentration in each fraction was evaluated by NTA (green bars), with fractions 6, 7, and 8 accounting for more than 50% of total particles, while fractions 1 and 2 and 9 and 10 showed a lower concentration (n = 3). (F) Representative western blotting of 10 fractions obtained after ODG and ultracentrifugation of each fraction in PBS (loaded per volume) show the presence of positive EV markers HSC70 and Flotilin-1. The endoplasmic reticulum protein calnexin was detected in low levels in EV-enriched fractions. (G) Distribution of Cre exRNA in bdEV fractions was evaluated by qRT-PCR (Ct value). Fractions 6, 7, and 8 showed higher levels of Cre exRNA when compared with the other fractions (n = 4) (same volume was used as starting point). (H) Transmission electron microscopy of pool 1 (fractions 1–5) showed lipoproteins (red arrow) and few canonical bdEVs (blue arrow), pool 2 (fractions 6–8) was highly enriched in bdEVs (blue arrow) with cup-shaped format, and pool 3 (fractions 9–10) presented very low number of particles and some protein aggregates (orange arrows). Scale bars, 500 nm (big pictures) and 200 nm (pool 2, crop). Values are presented as mean ± SEM.
Figure 6
Figure 6
Brain-derived EVs (bdEVs) are taken up by neurons and deliver functional Cre mRNA (A) Schematic illustration of the protocol used to isolate bdEVs labeled with carboxyfluorescein succinimidyl ester (CFSE) from Cre-injected mice. Thick coronal sections containing the injection sites were used as starting material for the EV extraction. (B) CFSE-loaded bdEVs were exposed to neurons. The 10 fractions of CFSE-labeled EVs were divided in 3 pools: pool 1 (fractions 1–5), pool 2 (fractions 6–8), and pool 3 (fractions 9–10) after density gradient separation. Each pool was incubated with cultured primary hippocampal neurons and total CFSE fluorescence was measured. Scale bar, 5 μm. (C) Pool 2 presented the highest fluorescence signal when compared with the other two pools (n = 3/4). Data are presented as means ± SEM and compared by ordinary one-way ANOVA followed by Dunnett’s multiple comparisons test (F = 17.41). ∗∗p < 0.01. Scale bar, 20 μm. (D) Incubation of pool 2 of CFSE-labeled bdEVs (green) with HEK293T cells (red) in culture (left), followed by high-magnification image (right) of primary neurons internalizing bdEVs (green). Cells were stained with phalloidin (red) and DAPI (blue) and analyzed by laser confocal microscopy equipped with Plan-Apochromat 40×/1.40 Oil DIC M27 (420782-9900). Scale bars, 20 μm (left) and 5 μm (crop, right). (E) Imaris 3D rendering showing individual bdEVs (green) being internalized in primary hippocampal neurons in culture. Scale bar, 20 μm. (F) Schematic representation of bdEVs delivering functional Cre mRNA to FLExNanoluc reporter cells. (G) Detection of Cre activity by measurement of Nanoluc bioluminescence in FLExNanoluc reporter cells. The same number of particles was incubated in control (white bars) and Cre conditions (orange bars). The highest luminescent peak was detected in pool 2 containing Cre when compared with control pool 2 carrying the same number of bdEVs without Cre. Values are presented as mean ± SEM and compared by unpaired t test. ∗p ≤ 0.05; ns, not significant. (H) Detection of Cre activity was confirmed at DNA level by analyzing the ratio between FLExON (recombined) and FLExOFF (non-recombined) between control and Cre samples. Values are presented as mean ± SEM and compared by unpaired t test. ∗p ≤ 0.05; ns, not significant.

Update of

References

    1. Li Q., Barres B.A. Microglia and macrophages in brain homeostasis and disease. Nat. Rev. Immunol. 2018;18:225–242. doi: 10.1038/nri.2017.125. - DOI - PubMed
    1. Chu A.J., Williams J.M. Astrocytic MicroRNA in ageing, inflammation, and neurodegenerative disease. Front. Physiol. 2021;12:826697. doi: 10.3389/fphys.2021.826697. - DOI - PMC - PubMed
    1. Hill A.F. NeuroEVs : characterizing extracellular vesicles generated in the neural domain, by extracellular vesicles and neurodegenerative diseases. J. Neurosci. 2019;39:9269–9273. - PMC - PubMed
    1. Khattar K.E., Safi J., Rodriguez A.M., Vignais M.L. Intercellular communication in the brain through tunneling nanotubes. Cancers. 2022;14:1207. doi: 10.3390/cancers14051207. - DOI - PMC - PubMed
    1. Rustom A., Saffrich R., Markovic I., Walther P., Gerdes H.H. Nanotubular highways for intercellular organelle transport. Science. 2004;303:1007–1010. doi: 10.1126/science.1093133. - DOI - PubMed

Publication types

LinkOut - more resources