. 2023 May 25;127(20):4441-4459.
doi: 10.1021/acs.jpcb.3c01292. Epub 2023 May 17.

Time-Dependent Material Properties of Aging Biomolecular Condensates from Different Viscoelasticity Measurements in Molecular Dynamics Simulations

Affiliations

Time-Dependent Material Properties of Aging Biomolecular Condensates from Different Viscoelasticity Measurements in Molecular Dynamics Simulations

Andrés R Tejedor et al. J Phys Chem B. .

Abstract

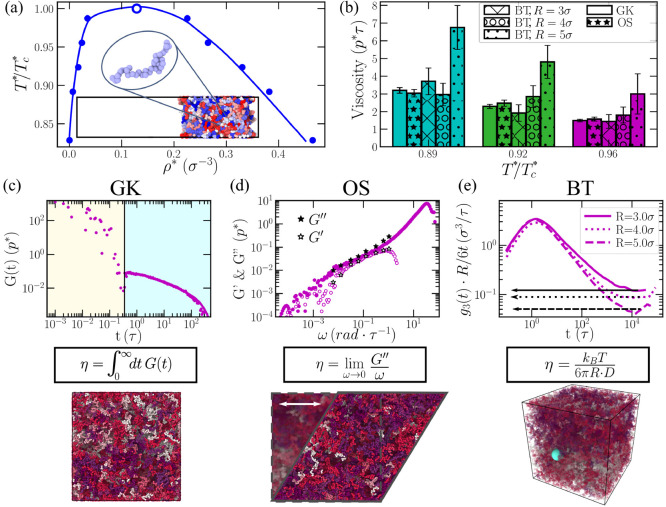
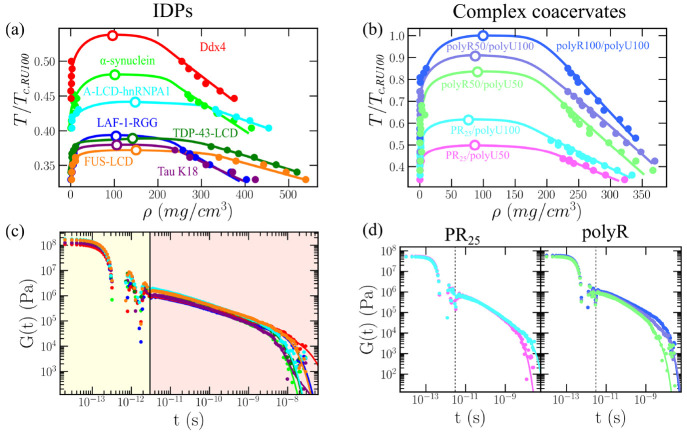
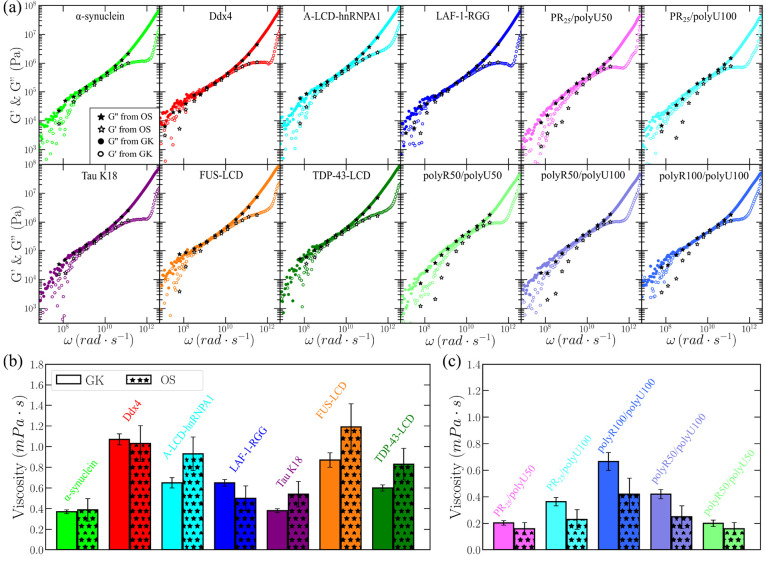
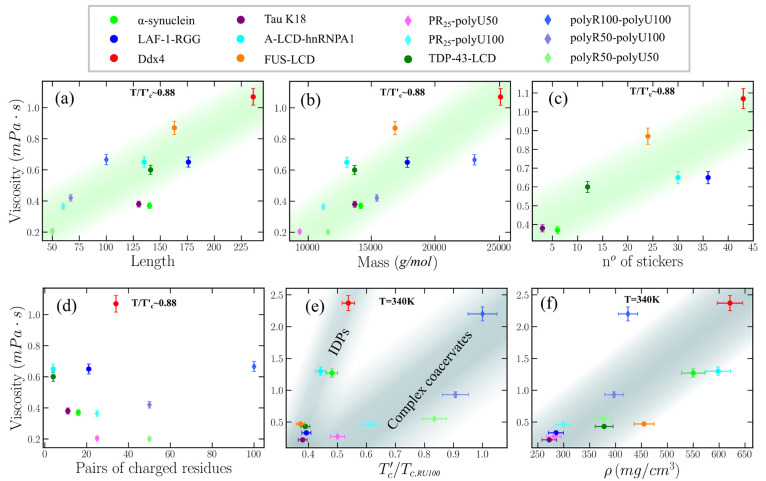
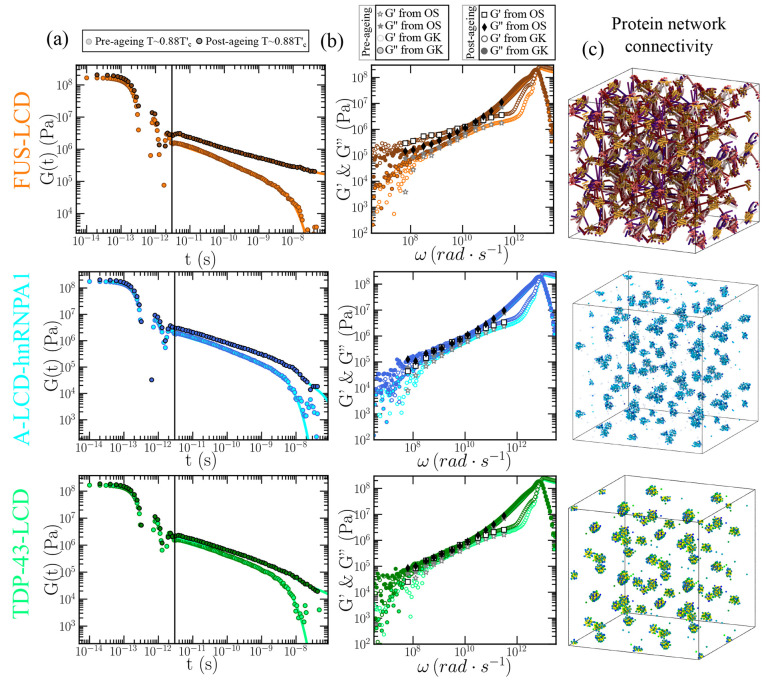
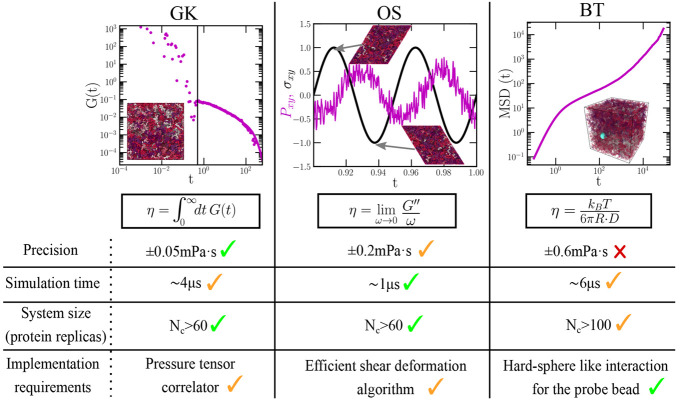
Biomolecular condensates are important contributors to the internal organization of the cell material. While initially described as liquid-like droplets, the term biomolecular condensates is now used to describe a diversity of condensed phase assemblies with material properties extending from low to high viscous liquids, gels, and even glasses. Because the material properties of condensates are determined by the intrinsic behavior of their molecules, characterizing such properties is integral to rationalizing the molecular mechanisms that dictate their functions and roles in health and disease. Here, we apply and compare three distinct computational methods to measure the viscoelasticity of biomolecular condensates in molecular simulations. These methods are the Green-Kubo (GK) relation, the oscillatory shear (OS) technique, and the bead tracking (BT) method. We find that, although all of these methods provide consistent results for the viscosity of the condensates, the GK and OS techniques outperform the BT method in terms of computational efficiency and statistical uncertainty. We thus apply the GK and OS techniques for a set of 12 different protein/RNA systems using a sequence-dependent coarse-grained model. Our results reveal a strong correlation between condensate viscosity and density, as well as with protein/RNA length and the number of stickers vs spacers in the amino acid protein sequence. Moreover, we couple the GK and the OS technique to nonequilibrium molecular dynamics simulations that mimic the progressive liquid-to-gel transition of protein condensates due to the accumulation of interprotein β-sheets. We compare the behavior of three different protein condensates, i.e., those formed by either hnRNPA1, FUS, or TDP-43 proteins, whose liquid-to-gel transitions are associated with the onset of amyotrophic lateral sclerosis and frontotemporal dementia. We find that both the GK and OS techniques successfully predict the transition from functional liquid-like behavior to kinetically arrested states once the network of interprotein β-sheets has percolated through the condensates. Overall, our work provides a comparison of different modeling rheological techniques to assess the viscosity of biomolecular condensates, a critical magnitude that provides information on the behavior of biomolecules inside condensates.


Conflict of interest statement

The authors declare no competing financial interest.

Figures

Figure 1
Figure 1
Applied computational methods to evaluate the viscosity in biomolecular condensates. (a) Phase diagram in the T*−ρ* plane for our IDP coarse-grained model using 50-bead chains obtained through Direct Coexistence (DC) simulations. Filled circles indicate the coexisting densities obtained from DC simulations (the inset shows a phase-separated condensate in a DC simulation), whereas the empty circle accounts for the system critical temperature (Tc* = 3.14) obtained through the law of rectilinear diameters and critical exponents. (b) Condensate viscosity at different temperatures obtained through GK, OS, and BT calculations as indicated in the legend. For the BT technique, we include results with different probe bead radii as specified in the legend. (c) Top: Shear stress relaxation modulus as a function of time for an IDP condensate at T*/Tc* = 0.96. The vertical black line separates the time scale corresponding to the computed term via numerical integration at short-times and the part evaluated via the Maxwell modes fit at long time scales. Middle: General equation to obtain viscosity through the GK relation. Bottom: IDP condensate simulation box in the canonical ensemble (at the condensate coexisting density) employed to compute G(t). Different IDPs are colored with different tones (as in (d) and (e) bottom panels). (d) Top: Elastic (G′) and viscous (G″) moduli as a function of frequency (ω) from OS calculations (empty and filled stars respectively) and from GK (empty and filled purple circles respectively) at T*/Tc* = 0.96. Middle: General equation to obtain viscosity through the OS technique. Bottom: IDP condensate simulation box in the canonical ensemble (at the condensate coexisting density) after applying a shear deformation (γxy). (e) Top: Mean-squared displacement (referred as g3(t)) of an inserted bead within an IDP condensate (T*/Tc* = 0.96) multiplied by R/6t (referring R to the bead radius and t to time) as a function of time for beads with different radii as indicated in the legend. The plateau at long time scales (denoted by horizontal lines) shows the value of R·D (being D the diffusion coefficient) at the diffusive regime. Middle: Stokes–Einstein equation for computing viscosity through the BT method. Bottom: IDP condensate simulation box in the canonical ensemble (at the condensate coexisting density) containing a single-bead with a radius of 5σ (green sphere).
Figure 2
Figure 2
Phase diagram and shear stress relaxation modulus for a set of IDP/polyU phase-separated condensates. (a) Phase diagram in the T–ρ plane for Ddx4, α-synuclein, Tau K18, LAF-1-RGG, A-LCD-hnRNPA1, FUS-LCD, and TDP-43-LCD using the HPS-cation-π force field., (b) Phase diagram in the T–ρ plane for PR25/polyU50, PR25/polyU100, polyR50/polyU50, polyR50/polyU100, and polyR100/polyU100 using the HPS-cation-π force field., In both panels (a) and (b), filled symbols represent the coexistence densities obtained via DC simulations, while empty symbols depict the estimated critical points by means of the law of rectilinear diameters and critical exponents. Moreover, temperature has been renormalized by the critical temperature (Tc,RU100Tc,polyR100/polyU100) of the system with highest Tc, which is the charge-matched polyR100/polyU100. The statistical error is of the same order of the symbol size. (c) and (d) Shear stress relaxation modulus G(t) of the systems shown in panel (a) and (b) at T/Tc ∼ 0.88 (referring Tc to the critical temperature of each system) and at the bulk condensate density at such temperature. The vertical continuous (c) and dashed (d) lines separate the time scale corresponding to the computed term via numerical integration at short time scales and the part evaluated via the Maxwell modes fit at long time scales (eq 6).
Figure 3
Figure 3
Condensate viscosity for different IDP and RNA complex coacervates evaluated through the GK relation and the oscillatory shear (OS) method. (a) Elastic (G′) and viscous (G″) moduli as a function of frequency (ω) from OS calculations at T/Tc ∼ 0.88 (empty and filled stars respectively) and from GK method (empty and filled colored circles respectively) for different IDP condensates and complex coacervates as indicated in the legend. (b) Viscosity computed via the GK and OS methods for the distinct IDP condensates. (c) Viscosity obtained through the same two methods for the different complex coacervates.
Figure 4
Figure 4
Correlation between condensate viscosity (obtained via the GK method) and chain length (a), molecular weight (b), number of stickers (Y, F, and R) across the sequence (c), and number of charged residue pairs of opposite charge (d) at constant T/Tc ∼ 0.88. In contrast, the correlation between viscosity and condensate critical temperature (e) and density (f) is plotted for a constant T = 340 K. In complex coacervates, we take the average chain length and molecular weight of the two cognate molecules. In panel (e), we note that each critical temperature has been renormalized by the highest critical temperature of the studied set (Tc,RU100, which corresponds to that of polyR100/polyU100). Since the complex coacervates by construction do not contain aromatic residues, their results have not been considered for the correlation shown in panel (c).
Figure 5
Figure 5
Viscoelasticity measurements and condensate network connectivity analysis of FUS-LCD, A-LCD-hnRNPA1, and TDP-43-LCD aged protein condensates. (a) Shear stress relaxation modulus of FUS-LCD (top), A-LCD-hnRNPA1 (middle), and TDP-43-LCD (bottom) condensates at T ∼ 0.88Tc prior maturation (light colors; reference model HPS-cation-π), and after 400 ns of maturation (dynamical aging model). (b) Elastic modulus G′ (empty symbols) and loss modulus G″ (filled symbols) of FUS-LCD (top), A-LCD-hnRNPA1 (middle), and TDP-43-LCD (bottom) condensates from computational oscillatory shear simulations prior (stars) and after maturation (squares and diamonds). G′ (empty circles) and G″ (filled circles) evaluated through the Fourier transform of G(t) via the GK relation pre-aging (light colors) and post-aging (dark colors) are also included. (c) Network connectivity of aged FUS-LCD (top), A-LCD-hnRNPA1 (middle), and TDP-43-LCD (bottom) condensates at T ∼ 0.88Tc after 400 ns of maturation computed using the primitive path analysis.
Figure 6
Figure 6
Comparison of the three different employed computational techniques to evaluate viscosity in phase-separated condensates. In the top panels we show the following: (left) decay over time of the shear stress relaxation modulus for computing η through the GK method; (middle) applied shear deformation (σxy; black curve) and stress response (Pxy; purple curve) as a function of time evaluated through the oscillatory shear method; (right) mean squared displacement of the probe bead (blue particle in the inset) to determine η through the Stokes–Einstein relation. Importantly, we note that GK and OS calculations do not depend on the system size as long as protein self-interactions are avoided through the periodic boundary conditions, whereas in BT simulations, such conditions might not be enough to prevent finite system-size effects in cases where the probe bead radius is greater than the protein radius of gyration. The specified data in the table applies for IDPs as those studied in this work.

Similar articles

Cited by

References

    1. Brangwynne C. P.; Eckmann C. R.; Courson D. S.; Rybarska A.; Hoege C.; Gharakhani J.; Jülicher F.; Hyman A. A. Germline P granules are liquid droplets that localize by controlled dissolution/condensation. Science 2009, 324, 1729–1732. 10.1126/science.1172046. - DOI - PubMed
    1. Li P.; Banjade S.; Cheng H.-C.; Kim S.; Chen B.; Guo L.; Llaguno M.; Hollingsworth J. V.; King D. S.; Banani S. F.; et al. Phase transitions in the assembly of multivalent signalling proteins. Nature 2012, 483, 336–340. 10.1038/nature10879. - DOI - PMC - PubMed
    1. Hyman A. A.; Weber C. A.; Jülicher F. Liquid-liquid phase separation in biology. Annual review of cell and developmental biology 2014, 30, 39–58. 10.1146/annurev-cellbio-100913-013325. - DOI - PubMed
    1. Banani S. F.; Lee H. O.; Hyman A. A.; Rosen M. K. Biomolecular condensates: organizers of cellular biochemistry. Nat. Rev. Mol. Cell Biol. 2017, 18, 285–298. 10.1038/nrm.2017.7. - DOI - PMC - PubMed
    1. Shin Y.; Brangwynne C. P. Liquid phase condensation in cell physiology and disease. Science 2017, 357, eaaf4382.10.1126/science.aaf4382. - DOI - PubMed

Publication types