. 2023 Jul 4;32(14):2399-2407.
doi: 10.1093/hmg/ddad086.

Time-varying effects are common in genetic control of gestational duration

Affiliations

Time-varying effects are common in genetic control of gestational duration

Julius Juodakis et al. Hum Mol Genet. .

Abstract

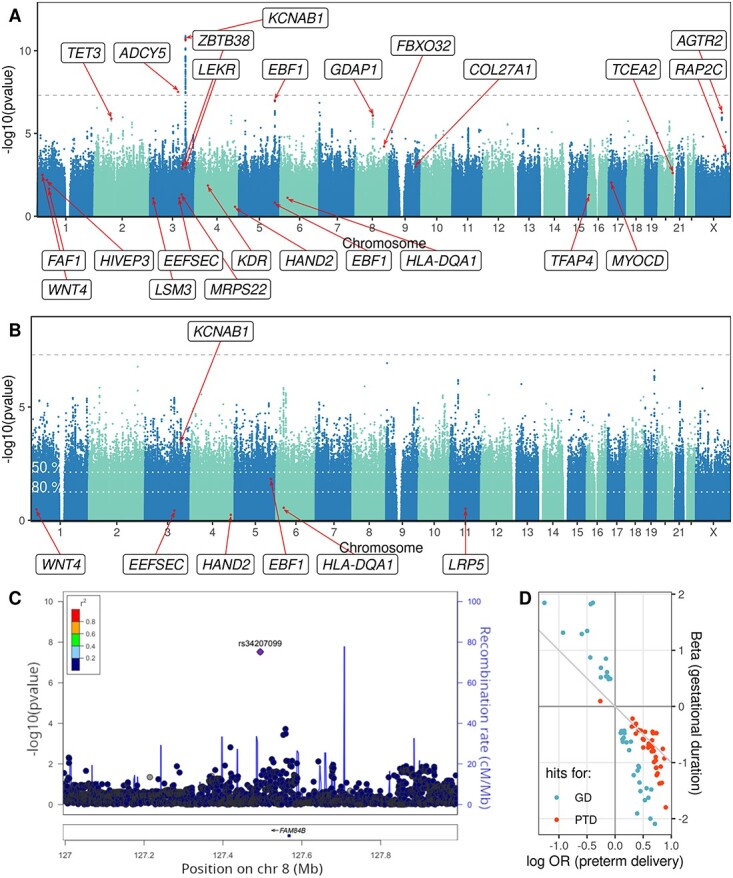
Preterm birth is a major burden to neonatal health worldwide, determined in part by genetics. Recently, studies discovered several genes associated with this trait or its continuous equivalent-gestational duration. However, their effect timing, and thus clinical importance, is still unclear. Here, we use genotyping data of 31 000 births from the Norwegian Mother, Father and Child cohort (MoBa) to investigate different models of the genetic pregnancy 'clock'. We conduct genome-wide association studies using gestational duration or preterm birth, replicating known maternal associations and finding one new fetal variant. We illustrate how the interpretation of these results is complicated by the loss of power when dichotomizing. Using flexible survival models, we resolve this complexity and find that many of the known loci have time-varying effects, often stronger early in pregnancy. The overall polygenic control of birth timing appears to be shared in the term and preterm, but not very preterm, periods and exploratory results suggest involvement of the major histocompatibility complex genes in the latter. These findings show that the known gestational duration loci are clinically relevant and should help design further experimental studies.


Figures

Figure 1
Figure 1
(A, B) Manhattan plots illustrating the maternal GWAS results for gestational duration (A) and preterm delivery (B). The dashed line marks the significance threshold. The variants marked in red, and the corresponding loci, were reported as significant for the respective phenotype in the largest previous GWAS meta-analysis (6). Under the liability model, the GWAS in (B) has lower power: for a variant that can be detected genome-wide with 80% power in (A), the significance thresholds in (B) should be reduced to the dotted white lines to achieve 50% or 80% detection power. (C) LocusZoom plot showing the region around the only genome-wide significant association identified in the fetal GWAS. Shown P-values are for gestational duration. The significant variant is the purple diamond while all other variants are colored based on their linkage disequilibrium with it. Variants not available in the reference panel are colored in gray. (D) Effect size comparison for the suggestive variants in the maternal GWASs (P-value < 10−5 for either outcome). Shown are the log odds ratios (ORs) and linear regression betas in the same position. The identity line is marked.
Figure 2
Figure 2
Effects of 20 genetic variants on delivery timing throughout gestation, estimated by a flexible PAMM. For each week of gestation, the line is the estimated instantaneous log hazard ratio (positive = risk of birth is currently increased) and its 95% confidence interval is shaded. The preterm limit of 37 weeks is highlighted. Note that the minor allele count was used as a continuous covariate in the analysis, so the effects of 1 and 2 minor alleles are constrained to be proportional.
Figure 3
Figure 3
(A) Effects of the gestational duration PGS throughout gestation, estimated by a flexible PAMM. For each week of gestation, the line is the estimated instantaneous log hazard ratio (positive = risk of birth is currently increased), and its 95% confidence interval is shaded. (B) Unadjusted risks of preterm delivery (left) and vPTD (right) in each PGS quintile. Lines show the 95% confidence intervals.
Figure 4
Figure 4
(A) Boxplots showing counts of rare alleles (left) or minor homozygous genotypes (right) across groups of gestational duration PGS. Only variants with estimated negative effects are shown here. Also shown are the correlation r between the count and the PGS and the P-value for the count term in a model of vPTD. (B) Variant loadings of the vPTD-associated principal component 3. Boxplots show the loadings across chromosomes, excluding any with magnitudes smaller than 1. Chromosome 6 is higshlighted, and the inset shows all its loadings. The MHC region 6p22.1–6p21.3 is highlighted in the inset.

Update of

References

    1. Vogel, J.P., Chawanpaiboon, S., Moller, A.-B., Watananirun, K., Bonet, M. and Lumbiganon, P. (2018) The global epidemiology of preterm birth. Best Pract. Res. Clin. Obstet. Gynaecol., 52, 3–12. - PubMed
    1. Blencowe, H., Cousens, S., Oestergaard, M.Z., Chou, D., Moller, A.-B., Narwal, R., Adler, A., Vera Garcia, C., Rohde, S., Say, L. and Lawn, J.E. (2012) National, regional, and worldwide estimates of preterm birth rates in the year 2010 with time trends since 1990 for selected countries: a systematic analysis and implications. Lancet, 379, 2162–2172. - PubMed
    1. Jing, S., Chen, C., Gan, Y., Vogel, J. and Zhang, J. (2020) Incidence and trend of preterm birth in China, 1990-2016: a systematic review and meta-analysis. BMJ Open, 10, e039303. - PMC - PubMed
    1. Wadon, M., Modi, N., Wong, H.S., Thapar, A. and O’Donovan, M.C. (2020) Recent advances in the genetics of preterm birth. Ann. Hum. Genet., 84, 205–213. - PMC - PubMed
    1. Liu, X., Helenius, D., Skotte, L., Beaumont, R.N., Wielscher, M., Geller, F., Juodakis, J., Mahajan, A., Bradfield, J.P., Lin, F.T.J. et al. (2019) Variants in the fetal genome near pro-inflammatory cytokine genes on 2q13 associate with gestational duration. Nat. Commun., 10, 1–13. - PMC - PubMed

Publication types

LinkOut - more resources