. 2023 Jun 28;194(1):38-52.
doi: 10.1093/toxsci/kfad044.

Per- and polyfluoroalkyl substances (PFAS) in mixtures show additive effects on transcriptomic points of departure in human liver spheroids

Affiliations

Per- and polyfluoroalkyl substances (PFAS) in mixtures show additive effects on transcriptomic points of departure in human liver spheroids

Gregory C Addicks et al. Toxicol Sci. .

Abstract

Per- and polyfluoroalkyl substances (PFAS) are a wide range of chemicals that are used in a variety of consumer and industrial products leading to direct human exposure. Many PFAS are chemically nonreactive and persistent in the environment, resulting in additional exposure from water, soil, and dietary intake. While some PFAS have documented negative health effects, data on simultaneous exposures to multiple PFAS (PFAS mixtures) are inadequate for making informed decisions for risk assessment. The current study leverages data from previous work in our group using Templated Oligo-Sequencing (TempO-Seq) for high-throughput transcriptomic analysis of PFAS-exposed primary human liver cell spheroids; herein, we determine the transcriptomic potency of PFAS in mixtures. Gene expression data from single PFAS and mixture exposures of liver cell spheroids were subject to benchmark concentration (BMC) analysis. We used the 25th lowest gene BMC as the point of departure to compare the potencies of single PFAS to PFAS mixtures of varying complexity and composition. Specifically, the empirical potency of 8 PFAS mixtures were compared to predicted mixture potencies calculated using the principal of concentration addition (ie, dose addition) in which mixture component potencies are summed by proportion to predict mixture potency. In this study, for most mixtures, empirical mixture potencies were comparable to potencies calculated through concentration addition. This work supports that the effects of PFAS mixtures on gene expression largely follow the concentration addition predicted response and suggests that effects of these individual PFAS in mixtures are not strongly synergistic or antagonistic.

Keywords: PFAS; TempO-Seq; benchmark concentration; liver spheroids; mixture toxicity; new approach methodology.


Figures

Figure 1.
Figure 1.
Graphical representation of the components of the 7 PFAS mixtures. Each column represents one mixture denoted by a point at top portion of figure. The components (ie, specific PFAS) used in each mixture are denoted by colored points in the bottom portion of figure. Colors for PFAS and mixtures are maintained across figures throughout article.
Figure 2.
Figure 2.
Cytotoxicity determination of PFAS exposures using lactose dehydrogenase (LDH). Relative mean LDH levels (luminescence) between DMSO control and PFAS exposed liver spheroid media following 24-hour (top) and 10-day (bottom) exposures expressed as fold change over control. Red dashed lines indicate the 10-fold cytotoxicity threshold applied in our study. Exposures are indicated by black dots. Exposure concentrations vary between mixture and single PFAS exposures (see Table 1). Mixture exposure levels are indicated as total additive molarity of all PFAS in mixtures. Mixture and single PFAS exposures are indicated at top of figure facets. Error bars indicate standard deviation of 4 exposures (n = 4).
Figure 3.
Figure 3.
Graphical depiction of experimental setup and inclusion or exclusion of individual PFAS exposure data in downstream analysis. Graphical depictions of inclusion and exclusion of individual PFAS exposure data in downstream analysis for 24-hour (top) and 10-day exposures (bottom). Individual points represent single PFAS exposures and their exposure concentrations. PFAS exposures that were removed due to cytotoxicity are depicted in red. PFAS exposures that were excluded due to R-ODAF quality control failures are depicted in orange. PFAS exposures that passed all R-ODAF quality control parameters and were used for downstream analysis are depicted in blue. Facet titles at top of each graph indicate the PFAS or mixture studied. Points are aligned to their corresponding exposure concentrations with mixtures and PFAS having varying exposures. All experimental exposures are indicated.
Figure 4.
Figure 4.
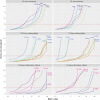
Accumulation plots of gene BMC responses. Accumulation graph of the lowest 100 gene BMCs of PFAS-exposed liver spheroids shown for PFAS mixtures and single PFAS. Note that the top of the line ends at the total number of genes fitting BMCs if there were <100 BMCs. 24-hour (left column) and 10-day exposures (right column) are divided into mixtures (top row), carboxylate-type PFAS (center row), and sulfonate and other types of PFAS (bottom row) for presentation. Accumulation graphs show number of genes with a concentration response of one standard deviation over control (BMCs) at all PFAS concentration levels as medians of 10 000 bootstrap experiments for PFAS mixtures and single PFAS. The red dashed line indicates the 25th gene BMC tPOD for each chemical or mixture.
Figure 5.
Figure 5.
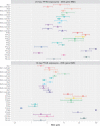
Empirical and predicted BMCs for each mixture based on concentration addition for the 25th gene BMC tPOD. The 25th lowest ranked gene BMC tPOD for each single PFAS exposure, mixture, and predicted concentration based on concentration addition of mixture components is shown. Empirical BMC values are indicated by open circles. Predicted BMC values are indicated by open triangles. Values of single PFAS and mixtures are median values of 10 000 bootstrap experiments. 95% confidence intervals that reflect the center range of 95% of 10 000 BMDExpress bootstrap experiments are shown.
Figure 6.
Figure 6.
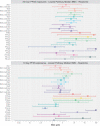
Empirical and predicted BMCs for each mixture based on concentration addition for the lowest pathway median BMC tPOD. The lowest pathway median BMC tPOD for each single PFAS exposure, mixture, and predicted BMC based on concentration addition of individual mixture components are shown. Empirical BMC values are indicated by open circles. Predicted BMC values are indicated by open triangles. Values of single PFAS and mixtures are median values of 10 000 bootstrap experiments. 95% confidence intervals are shown to indicate the center range of 95% of 10 000 BMDExpress bootstrap experiments.

References

    1. Altenburger R., Backhaus T., Boedeker W., Faust M., Scholze M., Grimme L. H. (2000). Predictability of the toxicity of multiple chemical mixtures to Vibrio fischeri: Mixtures composed of similarly acting chemicals. Environ. Toxicol. Chem. 19, 2341–2347.
    1. Auerbach S., Parham F., Wolfe M., and Bucher J. (2018). National Toxicology Program. NTP Research Report on National Toxicology Program Approach to Genomic Dose-Response Modeling: Research Report 5, National Toxicology Program, Durham, NC. - PubMed
    1. Backhaus T., Altenburger R., Boedeker W., Faust M., Scholze M., Grimme L. H. (2000). Predictability of the toxicity of a multiple mixture of dissimilarly acting chemicals to Vibrio fischeri. Environ. Toxicol. Chem. 19, 2348–2356.
    1. Bassler J., Ducatman A., Elliott M., Wen S., Wahlang B., Barnett J., Cave M. C. (2019). Environmental perfluoroalkyl acid exposures are associated with liver disease characterized by apoptosis and altered serum adipocytokines. Environ. Pollut. 247, 1055–1063. - PMC - PubMed
    1. Behr A.-C., Plinsch C., Braeuning A., Buhrke T. (2020). Activation of human nuclear receptors by perfluoroalkylated substances (PFAS). Toxicol. In Vitro 62, 104700. - PubMed

Publication types