. 2023 May 17;19(5):e1011158.
doi: 10.1371/journal.ppat.1011158. eCollection 2023 May.

Integrated post-genomic cell wall analysis reveals floating biofilm formation associated with high expression of flocculins in the pathogen Pichia kudriavzevii

Affiliations

Integrated post-genomic cell wall analysis reveals floating biofilm formation associated with high expression of flocculins in the pathogen Pichia kudriavzevii

María Alvarado et al. PLoS Pathog. .

Abstract

The pathogenic yeast Pichia kudriavzevii, previously known as Candida krusei, is more distantly related to Candida albicans than clinically relevant CTG-clade Candida species. Its cell wall, a dynamic organelle that is the first point of interaction between pathogen and host, is relatively understudied, and its wall proteome remains unidentified to date. Here, we present an integrated study of the cell wall in P. kudriavzevii. Our comparative genomic studies and experimental data indicate that the general structure of the cell wall in P. kudriavzevii is similar to Saccharomyces cerevisiae and C. albicans and is comprised of β-1,3-glucan, β-1,6-glucan, chitin, and mannoproteins. However, some pronounced differences with C. albicans walls were observed, for instance, higher mannan and protein levels and altered protein mannosylation patterns. Further, despite absence of proteins with high sequence similarity to Candida adhesins, protein structure modeling identified eleven proteins related to flocculins/adhesins in S. cerevisiae or C. albicans. To obtain a proteomic comparison of biofilm and planktonic cells, P. kudriavzevii cells were grown to exponential phase and in static 24-h cultures. Interestingly, the 24-h static cultures of P. kudriavzevii yielded formation of floating biofilm (flor) rather than adherence to polystyrene at the bottom. The proteomic analysis of both conditions identified a total of 33 cell wall proteins. In line with a possible role in flor formation, increased abundance of flocculins, in particular Flo110, was observed in the floating biofilm compared to exponential cells. This study is the first to provide a detailed description of the cell wall in P. kudriavzevii including its cell wall proteome, and paves the way for further investigations on the importance of flor formation and flocculins in the pathogenesis of P. kudriavzevii.


Conflict of interest statement

The authors have declared that no competing interests exist.

Figures

Fig 1
Fig 1. Tertiary (3D) structure analysis of P. kudriavzevii adhesins by AlphaFold modeling of putative ligand-binding domains.
Predicted domain structures are shown in rainbow-color representation from blue (N-terminus) to red (C-terminus) with the first and last amino acids indicated. P. kudriavzevii ORFs with similarity to (A) S. cerevisiae flocculins Flo1,5,9 and 10 (five ORFs), (B) S. cerevisiae flocculin Flo11 (three ORFs), or (C) containing a β-sandwich similar to the structure present in C. albicans adhesin Als3 (three ORFs).
Fig 2
Fig 2. P. kudriavzevii cell wall composition and aggregation analysis.
(A and B) Flow cytometry (FC) and colorimetric analysis of (A) Concanavalin A (ConA) α-mannan binding and Alcian blue phosphomannan binding and (B) Calcofluor white (CFW) and Wheat germ agglutinin (WGA) chitin binding. (C) Aggregation. Events associated to aggregates were quantified by flow cytometry, measuring 10,000 cell particles per strain in the presence or absence of Concanavalin A (ConA), FSC-A, particle size; SSC-A, particle complexity. Percentage of cell particles in each quadrant is indicated. Cell aggregation data was supported by optical microscopy. Cells used in these experiments were grown to exponential phase (OD600 = 1.8). C. albicans (A, B, and C) and S. cerevisiae (A and B) are added for comparative reasons. Data in (A) and (B) are normalized against S. cerevisiae. Statistically significant differences (p<0.05), indicated by ANOVA and post hoc LSD test analysis, are marked by asterisks. Error bars indicate standard deviations.
Fig 3
Fig 3. Cell surface properties of P. kudriavzevii compared to C. albicans.
(A) Spot assays to determine sensitivity to cell wall-perturbing agents Congo red (CR; 100 μg/mL) and Calcofluor white (CFW; 100 μg/mL). (B) Zymolyase sensitivity of cells grown to early exponential phase (OD600 = 1). Error bars indicate standard deviations.
Fig 4
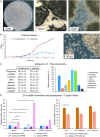
Fig 4. Adhesion and biofilm-forming properties of P. kudriavzevii.
(A) P. kudriavzevii floating biofilm formation after 24 h static incubation in YPD at 37°C. Left, Petri dish showing floating biofilm; Middle and right, light microscopy images. (B) Growth kinetics. Right-hand side, representative image (light microscopy) of floc formation of P. kudriavzevii after 12 h. (C) Percentage of cells adhering to polystyrene and different cell wall and host surface molecules after 4 h of incubation measured by flow cytometry. In the histogram, P. kudriavzevii data are normalized to C. albicans under the same condition. (D) Biofilm biomass after 24 h measured by Crystal Violet staining. In both histograms (left, non-shaking conditions; right, shaking), data are normalized against C. albicans in YPD without adding mannan or mannose. Statistically significant differences (p<0.05), as analyzed by Student’s t-tests or ANOVA followed by post hoc LSD test analysis, are indicated by asterisks. Error bars and ± indicate standard deviations.
Fig 5
Fig 5. Comparative proteomic analysis of P. kudriavzevii cell walls.
(A) Venn diagram showing comparative analysis of exponential phase cells and biofilms. (B) Volcano plot analysis of individual protein abundance in biofilms versus exponential phase cells. Indicated are proteins with at least twofold and statistically significant changes in abundance. (C and D) Peptide counts of putative adhesins and hydrolytic enzymes, respectively. Statistically significant differences (p<0.05) between the two conditions as indicated by Student’s t-tests are marked by asterisks.
Fig 6
Fig 6. Schematic model showing cell wall protein mannosylation.
(A) C. albicans protein mannosylation as described [60]. (B) Protein mannosylation in P. kudriavzevii as proposed in this study. Indicated in clouds are protein families expanded (pink) or reduced (grey) compared to C. albicans.

References

    1. Quindos G. Epidemiology of candidaemia and invasive candidiasis. A changing face. Rev Iberoam Micol. 2014;31(1):42–8. doi: 10.1016/j.riam.2013.10.001 - DOI - PubMed
    1. McCarty TP, Pappas PG. Invasive Candidiasis. Infect Dis Clin North Am. 2016;30(1):103–24. doi: 10.1016/j.idc.2015.10.013 - DOI - PubMed
    1. Pappas PG, Lionakis MS, Arendrup MC, Ostrosky-Zeichner L, Kullberg BJ. Invasive candidiasis. Nat Rev Dis Primers. 2018;4:18026. doi: 10.1038/nrdp.2018.26 - DOI - PubMed
    1. Gomez-Gaviria M, Mora-Montes HM. Current Aspects in the Biology, Pathogeny, and Treatment of Candida krusei, a Neglected Fungal Pathogen. Infect Drug Resist. 2020;13:1673–89. - PMC - PubMed
    1. Yadav JS, Bezawada J, Yan S, Tyagi RD, Surampalli RY. Candida krusei: biotechnological potentials and concerns about its safety. Can J Microbiol. 2012;58(8):937–52. - PubMed

Publication types

Supplementary concepts