. 2023 Oct 3;28(10):e910-e920.
doi: 10.1093/oncolo/oyad120.

Comparative Genomic Landscape of Urothelial Carcinoma of the Bladder Among Patients of East and South Asian Genomic Ancestry

Affiliations

Comparative Genomic Landscape of Urothelial Carcinoma of the Bladder Among Patients of East and South Asian Genomic Ancestry

Taylor Peak et al. Oncologist. .

Abstract

Background: Despite the low rate of urothelial carcinoma of the bladder (UCB) in patients of South Asian (SAS) and East Asian (EAS) descent, they make up a significant portion of the cases worldwide. Nevertheless, these patients are largely under-represented in clinical trials. We queried whether UCB arising in patients with SAS and EAS ancestry would have unique genomic features compared to the global cohort.

Methods: Formalin-fixed, paraffin-embedded tissue was obtained for 8728 patients with advanced UCB. DNA was extracted and comprehensive genomic profiling was performed. Ancestry was classified using a proprietary calculation algorithm. Genomic alterations (GAs) were determined using a 324-gene hybrid-capture-based method which also calculates tumor mutational burden (TMB) and determines microsatellite status (MSI).

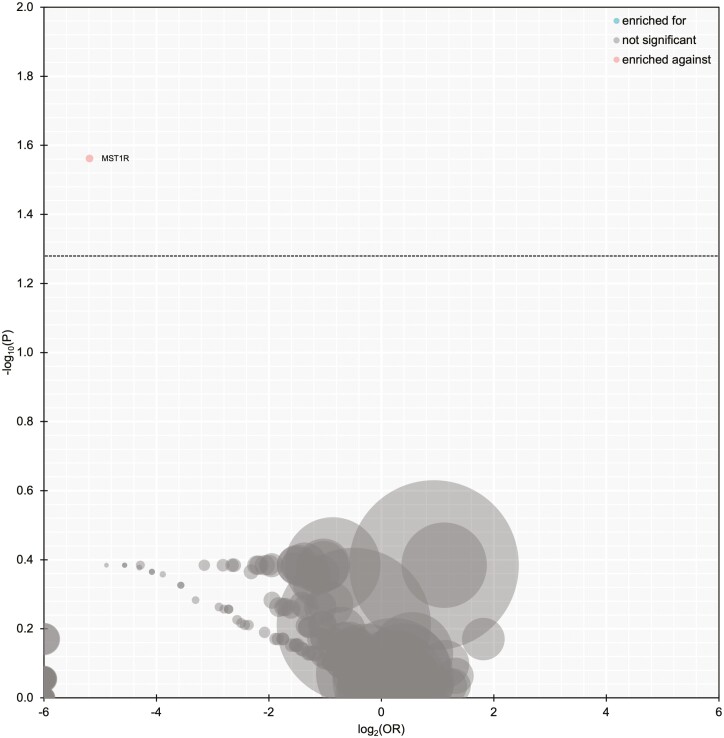
Results: Of the cohort, 7447 (85.3%) were EUR, 541 (6.2%) were AFR, 461 (5.3%) were of AMR, 74 (0.85%) were SAS, and 205 (2.3%) were EAS. When compared with EUR, TERT GAs were less frequent in SAS (58.1% vs. 73.6%; P = .06). When compared with non-SAS, SAS had less frequent GAs in FGFR3 (9.5% vs. 18.5%, P = .25). TERT promoter mutations were significantly less frequent in EAS compared to non-EAS (54.1% vs. 72.9%; P < .001). When compared with the non-EAS, PIK3CA alterations were significantly less common in EAS (12.7% vs. 22.1%, P = .005). The mean TMB was significantly lower in EAS vs. non-EAS (8.53 vs. 10.02; P = .05).

Conclusions: The results from this comprehensive genomic analysis of UCB provide important insight into the possible differences in the genomic landscape in a population level. These hypothesis-generating findings require external validation and should support the inclusion of more diverse patient populations in clinical trials.


Conflict of interest statement

Roger Li: Predicine, Veracyte, CG Oncology, Valar Labs (research support), CG Oncology (clinical trial protocol committee), BMS, Merck, Fergene, Arquer Diagnostics, Urogen Pharma, Lucence (scientific advisor/consultant). Petros Grivas: Aadi Bioscience, AstraZeneca, Astellas Pharma, Boston Gene, Bristol Myers Squibb, CG Oncology Inc., Dyania Health, EMD Serono, Exelixis, Fresenius Kabi, Genentech/Roche, Gilead Sciences, Guardant Health, Infinity Pharmaceuticals, Janssen, Lucence Health, MSD, Mirati Therapeutics, Pfizer, PureTech, QED Therapeutics, Regeneron Pharmaceuticals, Seattle Genetics, Silverback Therapeutics, 4D Pharma PLC, UroGen (consulting), Bavarian Nordic, Bristol Myers Squibb, Clovis Oncology, Debiopharm, EMD Serono, G1 Therapeutics, Gilead Sciences, GlaxoSmithKline, MSD, Mirati Therapeutics, Pfizer, QED Therapeutics (institutional research funding). Andrea Necchi: Merck, AstraZeneca, Janssen, Incyte, Roche, Rainier Therapeutics, Clovis Oncology, Bayer, Astellas/Seattle Genetics, Ferring, Immunomedics (consulting/advisory relationships), Merck, Ipsen, AstraZeneca (research funding). Dean Pavlick, Richard S.P. Huang, Douglas Lin, Natalie Danziger, Jeffrey S. Ross: Foundation Medicine Inc., a wholly owned subsidiary of Roche (employment) and Roche (ownership interest). Joseph M. Jacob: Janssen and Urogen (consulting). Taylor Peak, Philippe E. Spiess, and Gennady Bratslavsky indicated no financial relationships.

Figures

Figure 1.
Figure 1.
(A) Paired longtail of genomic alterations found in 205 patients of East Asian (EAS) and 7447 patients of European (EUR) genomic ancestry with UCB. Mutations in TERT promoter (73.60% vs. 54.15%; P = 6.34E−08) and PIK3CA (22.09% vs. 12.68%; P = 6.34E−08) are enriched in the EUR group. The most frequent 25 genes ordered by combined frequency in both cohorts are shown. (B) Tile plot of pathogenic genomic alterations identified in 205 patients with UCB of East Asian genomic ancestry. MSI-high was detected in 1.5% of patients were MSI-high and 7.3% were TMB-high (>20 mut/Mbp). (C) Volcano plot showing enrichment (P < .05) for pathogenic gene alterations between EAS and non-EAS groups. EMSY, NSD3, FGFR1, and PAX5 are significantly enriched in the EAS group while TERT promoter and PIK3CA are enriched in the non-EAS group.
Figure 1.
Figure 1.
(A) Paired longtail of genomic alterations found in 205 patients of East Asian (EAS) and 7447 patients of European (EUR) genomic ancestry with UCB. Mutations in TERT promoter (73.60% vs. 54.15%; P = 6.34E−08) and PIK3CA (22.09% vs. 12.68%; P = 6.34E−08) are enriched in the EUR group. The most frequent 25 genes ordered by combined frequency in both cohorts are shown. (B) Tile plot of pathogenic genomic alterations identified in 205 patients with UCB of East Asian genomic ancestry. MSI-high was detected in 1.5% of patients were MSI-high and 7.3% were TMB-high (>20 mut/Mbp). (C) Volcano plot showing enrichment (P < .05) for pathogenic gene alterations between EAS and non-EAS groups. EMSY, NSD3, FGFR1, and PAX5 are significantly enriched in the EAS group while TERT promoter and PIK3CA are enriched in the non-EAS group.
Figure 2.
Figure 2.
(A) Paired longtail of genomic alterations found in 75 patients of South Asian and 7447 patients of European genomic ancestry with UCB. No mutations were enriched in either group. The most frequent 25 genes ordered by combined frequency in both cohorts are shown. (B) Tile plot of pathogenic genomic alterations identified in 75 UCB patients of South Asian genomic ancestry. MSI-high was detected in 0% of patients were MSI-high and 12.2% were TMB-high (>20 mut/Mbp). (C) Volcano plot showing enrichment (P < .05) for pathogenic gene alterations between SAS and non-SAS groups. MST1R is significantly enriched in the SAS group while no genes are enriched in the non-SAS group.
Figure 2.
Figure 2.
(A) Paired longtail of genomic alterations found in 75 patients of South Asian and 7447 patients of European genomic ancestry with UCB. No mutations were enriched in either group. The most frequent 25 genes ordered by combined frequency in both cohorts are shown. (B) Tile plot of pathogenic genomic alterations identified in 75 UCB patients of South Asian genomic ancestry. MSI-high was detected in 0% of patients were MSI-high and 12.2% were TMB-high (>20 mut/Mbp). (C) Volcano plot showing enrichment (P < .05) for pathogenic gene alterations between SAS and non-SAS groups. MST1R is significantly enriched in the SAS group while no genes are enriched in the non-SAS group.
Figure 3.
Figure 3.
Trans urethral resection of bladder tumor (TURBT) of a deeply invasive UCB that presented with metastatic disease in a 64-year-old man of South Asian genomic ancestry. PD-L1 expression by IHC showed CPS score 10. CGP revealed this MSS tumor had TMB 14 mut/Mbp and harbored and FGFR3-TACC3 fusion along with pathogenic short variant mutations in APC, ARID1A, CDKN1A, GATA3, RB1, TERT, TP53, TSC1, and homozygous deletion of RAD51B. The FGFR3-TACC3 fusion involved a chr4 duplication event yielding a 5ʹ-FGFR3(ex1-17 NM_000142)-TACC3(ex8-16 NM_006342) chimera.

References

    1. Richters A, Aben KKH, Kiemeney LALM.. The global burden of urinary bladder cancer: an update. World J Urol. 2020;38(8):1895-1904. 10.1007/s00345-019-02984-4 - DOI - PMC - PubMed
    1. Sung H, Ferlay J, Siegel RL, et al. . Global Cancer Statistics 2020: GLOBOCAN estimates of incidence and mortality worldwide for 36 cancers in 185 countries. CA Cancer J Clin. 2021;71(3):209-249. 10.3322/caac.21660 - DOI - PubMed
    1. Loriot Y, Necchi A, Park SH, et al. . Erdafitinib in locally advanced or metastatic urothelial carcinoma. N Engl J Med. 2019;381(4):338-348. 10.1056/NEJMoa1817323 - DOI - PubMed
    1. Maher VE, Fernandes LL, Weinstock C, et al. . Analysis of the association between adverse events and outcome in patients receiving a programmed death protein 1 or programmed death ligand 1 antibody. J Clin Oncol. 2019;37(30):2730-2737. 10.1200/jco.19.00318 - DOI - PubMed
    1. Hoffman-Censits J, Kanesvaran R, Bangs R, Fashoyin-Aje L, Weinstock C.. Breaking barriers: addressing issues of inequality in trial enrollment and clinical outcomes for patients with kidney and bladder cancer. Am Soc Clin Oncol Educ Book. 2021;41:e174-ee81. - PubMed