. 2023 May 17;15(696):eadg0675.
doi: 10.1126/scitranslmed.adg0675. Epub 2023 May 17.

Clonally expanded, thyrotoxic effector CD8+ T cells driven by IL-21 contribute to checkpoint inhibitor thyroiditis

Affiliations

Clonally expanded, thyrotoxic effector CD8+ T cells driven by IL-21 contribute to checkpoint inhibitor thyroiditis

Melissa G Lechner et al. Sci Transl Med. .

Abstract

Autoimmune toxicity occurs in up to 60% of patients treated with immune checkpoint inhibitor (ICI) therapy for cancer and represents an increasing clinical challenge for expanding the use of these treatments. To date, human immunopathogenic studies of immune-related adverse events (IRAEs) have relied on sampling of circulating peripheral blood cells rather than affected tissues. Here, we directly obtained thyroid specimens from individuals with ICI-thyroiditis, one of the most common IRAEs, and compared immune infiltrates with those from individuals with spontaneous autoimmune Hashimoto's thyroiditis (HT) or no thyroid disease. Single-cell RNA sequencing revealed a dominant, clonally expanded population of thyroid-infiltrating cytotoxic CXCR6+ CD8+ T cells (effector CD8+ T cells) present in ICI-thyroiditis but not HT or healthy controls. Furthermore, we identified a crucial role for interleukin-21 (IL-21), a cytokine secreted by intrathyroidal T follicular (TFH) and T peripheral helper (TPH) cells, as a driver of these thyrotoxic effector CD8+ T cells. In the presence of IL-21, human CD8+ T cells acquired the activated effector phenotype with up-regulation of the cytotoxic molecules interferon-γ (IFN-γ) and granzyme B, increased expression of the chemokine receptor CXCR6, and thyrotoxic capacity. We validated these findings in vivo using a mouse model of IRAEs and further demonstrated that genetic deletion of IL-21 signaling protected ICI-treated mice from thyroid immune infiltration. Together, these studies reveal mechanisms and candidate therapeutic targets for individuals who develop IRAEs.


Conflict of interest statement

A.R. has received honoraria from consulting with Amgen, Bristol-Myers Squibb, Chugai, Genentech, Merck, Novartis, Roche, Sanofi and Vedanta, is or has been a member of the scientific advisory board and holds stock in Advaxis, Appia, Apricity, Arcus, Compugen, CytomX, Highlight, ImaginAb, Isoplexis, Kalthera, Kite-Gilead, Merus, PACT Pharma, Pluto, RAPT, Rgenix, Synthekine and Tango, has received research funding from Agilent and from Bristol-Myers Squibb through Stand Up to Cancer (SU2C), and patent royalties from Arsenal Bio. A.D. has consulted for Bristol-Myers Squibb, AstraZeneca, Radmetrix, Seattle Genetics, Janssen, PACT Pharma, Merck, Roche/Genetech, Exelixis, Dyania Health, and has received research funding Kite/Gilead, AstraZeneca, Roche/Genetech, BMS, Merck, Jounce Therapeutics, Infinity Pharmaceuticals, Seattle Genetics. All other authors declare that they have no competing interests.

Figures
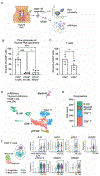
Fig. 1.
Fig. 1.. Thyroid-infiltrating immune populations in ICI-thyroiditis patients are T cell-predominant and include IL-21+ CD4+ Tfh and Tph cells.
(A) Shown is a schema of thyroid specimen collection by FNA. (B) Immune populations were analyzed by flow cytometry in thyroid FNA specimens (n=6 patients). Mono, monocytes. Data were analyzed with an ANOVA with Welch’s correction. (C) T cell populations were analyzed by flow cytometry in thyroid FNA specimens (n=4 patients). Data were analyzed with a t test with Welch’s correction. In (B and C), data are presented as mean±SD. (D) Shown is a UMAP representing scRNAseq analysis of thyroid infiltrating CD45+ immune cells (n=5 patients). (E) Shown is the distribution of intrathyroidal cells by major immune population. (F) UMAP of subclustered CD4+ T cells (left) and violin plots show genes associated with T follicular (Tfh) and peripheral (Tph) helper populations (right). ***p<0.001; ns, not significant.
Fig. 2.
Fig. 2.. CD8+ T cells are expanded in ICI-thyroiditis compared to HT.
(A) Thyroid immune infiltrates were compared in samples from individuals with ICI-thyroiditis (IRAE, n=5), Hashimoto’s thyroiditis (HT, n=5) and healthy controls (n=3, pooled) by scRNAseq. Shown is a UMAP of integrated CD45+ cells across conditions (left), with UMAP plots split by condition on the right. (B) Gene expression across immune cell clusters in ICI-thyroiditis is shown. Stacked violin plot show gene expression by cell cluster for CD4+ and CD8+ T cells (left) and other immune cell populations (right), including γδ T, NK, myeloid (M), and B cell populations. (C) Shown is pathway analysis of differentially expressed genes in thyroid-infiltrating CD45+ cells between IRAE and HT. Bolded pathways indicate those associated with immune activation. Arrowheads indicate pathways related to effector CD8+ T cell functions. (D) Shown is the distribution of intrathyroidal cells by major immune population by condition, presented as mean±SEM. Data were analyzed by ANOVA; p=ns (E) The frequency of clonotype expansion of intrathyroidal CD3+ T cells is shown by thyroid state. (F) Shown are UMAPs of thyroid-infiltrating CD3+ cells (left) and clonotype distribution split by thyroid condition (right). The arrow indicates a cluster with medium to large clonal expansion.
Fig. 3.
Fig. 3.. Clonally expanded CXCR6+ IFNG+ GZMB+ effector CD8+ T cells distinguish ICI-thyroiditis.
(A) CD8+ T cell gene expression is shown by thyroid state (HT, n=5; IRAE, n=5; and HC, n=3, pooled). (B) Shown is a UMAP of subclustered thyroid-infiltrating CD8+ T cells. Mem, memory. (C) Gene expression is shown across the CD8+ subclusters. (D) Slingshot trajectory analysis of CD8+ T cell populations is shown. Effector population Cluster 4 is boxed. (E) Transcriptional transitions in CD8+ T cells are shown along the pseudotime trajectory. (F) Density distribution of CD8+ T cell along the pseudotime trajectory are shown split by thyroid state. (G) Shown is a comparison of the subset frequency between IRAE and HT; pooled HC specimens are also shown. Data are presented as mean±SEM. (H) STARTRAC clonal expansion index is shown by CD8+ subcluster. The box and whisker plots indicate median, 1.5 times the interquartile range, minimum, and maximum values. Data were analyzed with ANOVA with Welch correction (A), asymptotic Kolmogorov-Smirnov test (F), Student’s t test with correction for multiple comparisons (G), or ANOVA with Tukey’s multiple comparison’s test (H); *p<0.05, ***p<0.001, ****p<0.0001.
Fig. 4.
Fig. 4.. IL-21+ CD4+ T follicular helper (Tfh) and peripheral helper (Tph) cells are enriched in ICI-thyroiditis and promote CD8+ T cell thyrotoxicity.
(A) Shown is a UMAP of subclustered thyroid infiltrating CD4+ T cells in human FNA specimens by scRNAseq (HT, n=5; IRAE, n=5; and HC, n=3, pooled). (B) Expression of Tfh and Tph marker genes are shown by cluster. (C) Trajectory analysis of CD4+ T cells by Slingshot and density distribution along the pseudotime trajectory are shown by condition for two lineages: Tph (left) and Tfh (right). (D) Proposed action of Tfh and Tph cells on effector CD8+ T cells in ICI-thyroiditis. (E) Granzyme B (GZMB) expression on human CD8+ T cells (median fluorescence intensity, MFI) and the frequency of CXCR6+ cells of CD8+ T cells were quantified following in vitro stimulation with anti-CD3/CD28 beads and recombinant human IL-21; samples evaluated after 3 days by flow cytometry. Each set of linked points represents data from one participant; data shown from two experiments. Data were analyzed with asymptotic Kolmogorov-Smirnov test (C) or repeated measure ANOVA and subsequent Tukey’s multiple pairwise comparisons (E). *p<0.05, **p<0.01, ***p<0.001, ****p<0.0001.
Fig. 5.
Fig. 5.. CD8+ effector T cells and IL-21+ Tfh and Tph cells are increased in a mouse model of ICI-associated autoimmunity.
(A) Schematic of mouse model, where non-obese diabetic (NOD) mice are treated with anti-PD-1 + anti-CTLA-4 (ICI) or isotype control (ISO) for four weeks (wk) (n=6–7 per group). (B) Shown is the frequency of effector mediator CD8+ T cells in spleen of ICI treated mice; representative flow plots are shown on the right. FSC, forward scatter; FITC, fluorescein isothiocyanate; PE, phycoerythrin; APC, allophycocyanin. (C) Shown are the frequencies and representative flow plots of T peripheral (Tph: CD4+ PD-1+ ICOS+ CXCR5) and T follicular (Tfh: CD4+ PD-1+ ICOS+ CXCR5+) helper cells in spleen. (D) Shown is the frequency of IL-21+ CD4+ T cells in spleen; representative flow plots are shown on the right. Each point represents data from one animal (B to D), and representative data shown from one of two independent experiments. Data are presented as mean±SEM and were analyzed by unpaired Student’s t test with Welch correction (B to D); *p<0.05, **p<0.01, ***p<0.001, ****p<0.0001.
Fig. 6.
Fig. 6.. IL-21 signaling is required for ICI-related thyroid autoimmunity in a mouse model.
(A and B) Shown is expression of effector molecules IFN-γ and GZMB by CD8+ T cells (A) and the frequency of CXCR6+ cells of murine CD8+ T cells (B) stimulated 3 days in vitro with anti-CD3/CD28 and recombinant murine IL-21, and then analyzed by flow cytometry (n=3 per group). Data from one representative experiment shown. (C) Proposed mechanism of ICI-thyroiditis and inhibition by deletion of IL-21 signaling. (D) Shown is a schematic of anti-PD-1 + anti-CTLA-4 (ICI) treatment in NOD wild type (WT) or IL-21R KO mice. (E) Shown is the frequency of CXCR6+ CD8+ T cells of total CD8+ T cells in ICI (n=13) or isotype (ISO)-treated WT (n=12) and IL-21R KO mice spleens (n=5). (F) Thyroid-infiltrating CD45+ and CD3+ cells were quantified in ICI (n=7) or ISO-treated WT (n=7) and ICI-treated IL-21R KO mice (n=13). Each dot represents data from one animal, and data are pooled from three experiments. Data are presented as mean±SD (A,B) or mean±SEM (E,F) and were analyzed with ANOVA with Welch’s correction and subsequent Tukey’s pairwise comparison (A, B, E, and F), *p<0.05, **p<0.01, ***p<0.001, ****p<0.0001. (G) Shown is a schematic of ICI treatment of NOD.SCID mice after adoptive transfer of CD4+ and CD8+ T cells from WT or IL-21R KO mice. (H) Shown are representative thyroid histology sections of ICI or ISO-treated reconstituted NOD.SCID mice (left; H&E staining, original magnification 100x) and cumulative incidence of thyroiditis by histology (right; black = immune infiltrate, white = no infiltrate). The arrow indicates area of immune infiltrate.

References

    1. Wei SC, Duffy CR, Allison JP, Fundamental mechanisms of immune checkpoint blockade therapy. Cancer Discov. 8, 1069–1086 (2018). - PubMed
    1. Wang DY, Salem JE, Cohen JV, Chandra S, Menzer C, Ye F, Zhao S, Das S, Beckermann KE, Ha L, Rathmell WK, Ancell KK, Balko JM, Bowman C, Davis EJ, Chism DD, Horn L, Long GV, Carlino MS, Lebrun-Vignes B, Eroglu Z, Hassel JC, Menzies AM, Sosman JA, Sullivan RJ, Moslehi JJ, Johnson DB, Fatal Toxic Effects Associated With Immune Checkpoint Inhibitors: A Systematic Review and Meta-analysis. JAMA Oncol. 4, 1721–1728 (2018). - PMC - PubMed
    1. Larkin J, Chiarion-Sileni V, Gonzalez R, Grob JJ, Rutkowski P, Lao CD, Cowey CL, Schadendorf D, Wagstaff J, Dummer R, Ferrucci PF, Smylie M, Hogg D, Hill A, Márquez-Rodas I, Haanen J, Guidoboni M, Maio M, Schöffski P, Carlino MS, Lebbé C, McArthur G, Ascierto PA, Daniels GA, Long GV, Bastholt L, Rizzo JI, Balogh A, Moshyk A, Hodi FS, Wolchok JD, Five-year survival with combined nivolumab and ipilimumab in advanced melanoma. N. Engl. J. Med 381, 1535–1546 (2019). - PubMed
    1. Haslam A, Prasad V, Estimation of the Percentage of US Patients With Cancer Who Are Eligible for and Respond to Checkpoint Inhibitor Immunotherapy Drugs. JAMA Netw. open 2, e192535 (2019). - PMC - PubMed
    1. De Filette J, Andreescu CE, Cools F, Bravenboer B, Velkeniers B, A Systematic Review and Meta-Analysis of Endocrine-Related Adverse Events Associated with Immune Checkpoint InhibitorsHorm. Metab. Res 51, 145–156 (2019). - PubMed

Publication types