. 2023 May 19;9(20):eadg3032.
doi: 10.1126/sciadv.adg3032. Epub 2023 May 17.

Cross-reactive EBNA1 immunity targets alpha-crystallin B and is associated with multiple sclerosis

Affiliations

Cross-reactive EBNA1 immunity targets alpha-crystallin B and is associated with multiple sclerosis

Olivia G Thomas et al. Sci Adv. .

Abstract

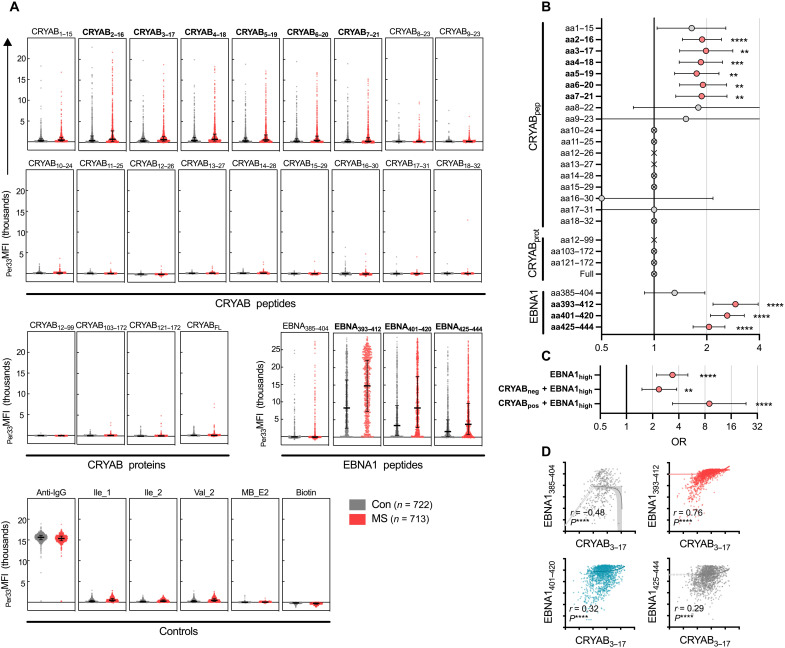
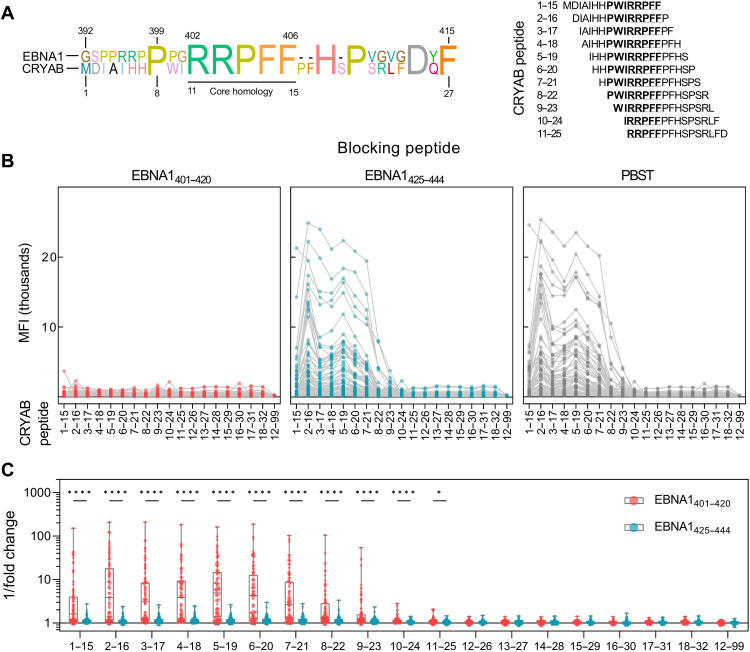
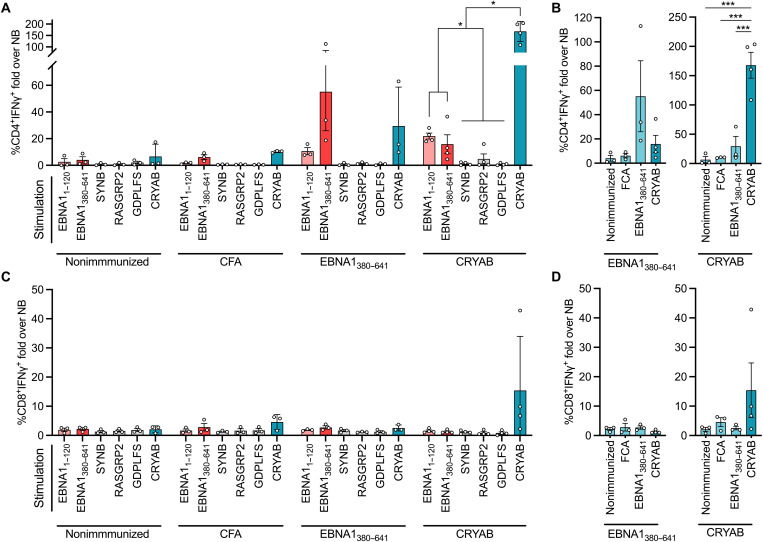
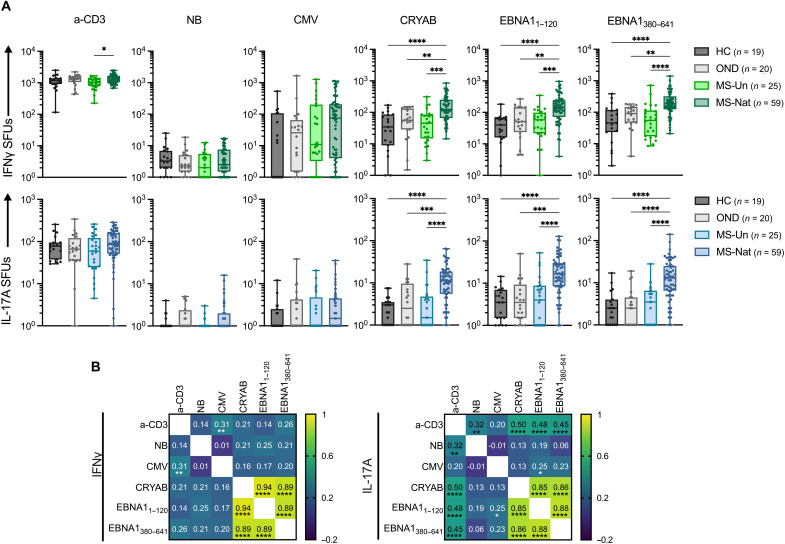
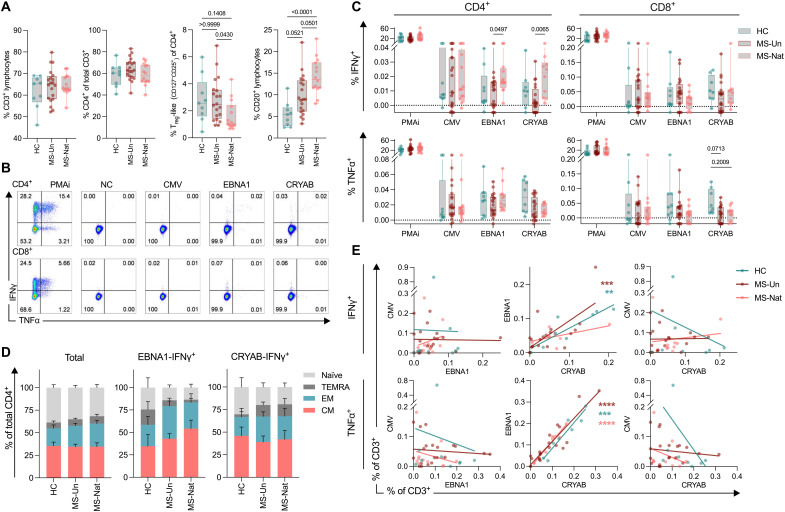
Multiple sclerosis (MS) is an inflammatory disease of the central nervous system, for which and Epstein-Barr virus (EBV) infection is a likely prerequisite. Due to the homology between Epstein-Barr nuclear antigen 1 (EBNA1) and alpha-crystallin B (CRYAB), we examined antibody reactivity to EBNA1 and CRYAB peptide libraries in 713 persons with MS (pwMS) and 722 matched controls (Con). Antibody response to CRYAB amino acids 7 to 16 was associated with MS (OR = 2.0), and combination of high EBNA1 responses with CRYAB positivity markedly increased disease risk (OR = 9.0). Blocking experiments revealed antibody cross-reactivity between the homologous EBNA1 and CRYAB epitopes. Evidence for T cell cross-reactivity was obtained in mice between EBNA1 and CRYAB, and increased CRYAB and EBNA1 CD4+ T cell responses were detected in natalizumab-treated pwMS. This study provides evidence for antibody cross-reactivity between EBNA1 and CRYAB and points to a similar cross-reactivity in T cells, further demonstrating the role of EBV adaptive immune responses in MS development.


Figures

Fig. 1.
Fig. 1.. Increased anti-CRYAB IgG in MS.
Suspension bead array measuring immunoglobulin G (IgG) against alpha-crystallin B (CRYAB) and Epstein-Barr nuclear antigen 1 (EBNA1) using plasma from a cohort of persons with multiple sclerosis (pwMS) (n = 713) and controls (Con) (n = 722). (A) Background-adjusted mean fluorescent intensity [33rd percentile MFI (Per33MFI)] values of CRYAB-stepped peptides (top panel), CRYAB protein fragments and CRYAB full length protein (CRYABFL) (middle left panel), EBNA1 peptides associated with MS risk (middle right panel), and controls (bottom panel). Each dot represents one individual, and staples denote the median and interquartile range (IQR). (B) Odds ratio (ORs) of MS versus Con for the different reactivities in (A), with positive responses defined as >99.9th percentile of negative control peptide responses. ORs were calculated using the Baptista-Pike method with Fisher’s exact test for P values and Holm-Sidak correction for multiple comparisons. Staples denote 95% confidence interval (CI). ORs based on 1 or 0 events are depicted as crossed circles (>infinity) or as a cross (no OR). aa, amino acids. (C) ORs for combinations of antibody responses: EBNA1-high responders (defined as >median + 2 SD of Con response), EBNA1-high and CRYAB-negative responders, and EBNA1-high and CRYAB-positive responders. CRYAB positivity is defined as in (B) and is based on CRYAB3–17. The ORs were calculated as MS versus Con. For both (B) and (C), the exact number of positive and negative individuals is presented in table S2. (D) Correlation between CRYAB3–17 responses and EBNA1 responses (log10 Per33MFI). Spearman correlation coefficient (r) and P values are indicated. The lines and highlighted areas represent linear regression slopes and the 95% CI of slopes. For the whole figure, *P < 0.05; **P < 0.01; ***P < 0.001; ****P < 0.0001 (adjusted P values).
Fig. 2.
Fig. 2.. Anti-CRYAB antibodies cross-react with the homologous sequence in EBNA1.
(A) Alignment of EBNA1392–415 and CRYAB1–27 amino acid sequences with the core homology between EBNA1402–406 and CRYAB11–15 underlined (left panel). Sequences of CRYAB peptides tested with homology are indicated in bold, and core sequences are underlined (right panel). (B) Anti-CRYAB IgG reactivity in pwMS (n = 91) after spiking plasma with EBNA1401–420, EBNA1425–444, or phosphate-buffered saline (PBS)–Tween 20 (PBST). Results are plotted as raw MFI. (C) Fold change of individual antibody responses after blocking with EBNA1401–420 or EBNA1425–444, compared to the PBST assay control [based on the data in (B)]. Presented as 1/fold change, i.e., higher values represent more efficient blocking. P values were calculated using multiple Wilcoxon signed-rank tests with Holm-Sidak correction for multiple comparisons. *P < 0.05; ****P < 10−9.
Fig. 3.
Fig. 3.. EBNA1 and CRYAB immunization cross-prime CD4+ T cells in vivo.
Draining lymph node lymphocytes from nonimmunized mice (n = 3) or mice immunized with recombinant CRYAB (n = 4), EBNA1380–641 (n = 3), or Freund’s complete adjuvant (FCA; n = 3) were examined for antigen reactivity using recall stimulations and intracellular cytokine staining flow cytometry. (A) CD4+ T cells responding to restimulation after 10 days with bead-bound antigens. Data are presented as the fold change of %CD3+CD4+IFNγ+ over the naked bead (NB)–negative stimulation control. (B) Comparison of CD4+ responses within the EBNA1380–641 and CRYAB immunization groups. Data are presented as in (A). (C) Responses of CD8+ T cells from draining lymph node lymphocytes responding to restimulation as in (A). Data are presented as the fold change of %CD3+CD8+IFNγ+ over the NB negative control. (D) Comparison of CD8+ responses within the EBNA1380–641 and CRYAB immunization groups [as in (C)]. Each dot represents one biological replicate. P values were calculated using a two-way analysis of variance (ANOVA) with Tukey’s multiple comparisons test, comparing each different restimulation within the immunization group and indicated where significant. Bars and staples denote means ± SEM. *P < 0.05; ***P < 0.001. RASGRP2, RAS guanyl-releasing protein 2 (29); SYNB, synuclein beta (28); GDPLFS, GDP-l-fucose synthase.
Fig. 4.
Fig. 4.. Increased circulating autoreactive CRYAB-specific cells in MS-Nat.
(A) Number of interferon γ (IFNγ; top graphs) and interleukin-17A (IL-17A; bottom graphs) spot-forming units (SFUs) in a FluoroSpot assay after NB negative control, CRYAB, and EBNA1 stimulations. SFUs <1 are plotted as 1. Boxes represent median ± IQR. Statistical significance was calculated with a nonparametric, two-tailed Kruskal-Wallis test with Dunn’s multiple comparison test. Each group was compared with every other group, and P values are indicated where significant. *P < 0.05; **P < 0.01; ***P < 0.001; ****P < 0.0001. CMV, cytomegalovirus; MS-Un, untreated pwMS; MS-Nat, natalizumab-treated pwMS; HC, healthy control; OND, other neurological disease controls. (B) Correlation matrix of individual’s responses to the different stimulations [based on the data in (A)]. r and P values were calculated using nonparametric Spearman correlation with Holm-Sidak correction for multiple comparisons. Each comparison’s r value is written in the corresponding cell. P values are denoted when significant. *P < 0.05; **P < 0.01; ****P < 0.0001.
Fig. 5.
Fig. 5.. Characterization of CRYAB-responsive T cells.
Spectral flow cytometry analysis of antigen-stimulated peripheral blood mononuclear cells (PBMCs) in a representative subcohort of the complete PBMC cohort presented in Fig. 4: HC (n = 9), MS-Un (n = 20), and MS-Nat (n = 14). (A) Bulk populations of lymphocyte subsets, based on NB-stimulated cells [negative control (NC) stimulation]. P values were calculated using a Kruskal-Wallis test with Dunn’s correction for multiple comparisons. Treg, regulatory T cell. (B) Representative plots for intracellular cytokine staining (ICS). (C) ICS of antigen bead-stimulated CD4+ and CD8+ T cells. All values presented are individually background adjusted (subtraction of NC-stimulated results). P values were calculated using a two-tailed Mann-Whitney U test with Holm-Sidak correction for multiple comparisons. PMAi, phorbol 12-myristate 13-acetate and ionomycin. (D) Distribution of central memory (CM; CCR7+CD45RA), effector memory (EM; CCR7CD45RA), terminally differentiated EM (TEMRA; CCR7CD45RA+), and naïve (CCR7+CD45RA+) in the total bulk CD4+ compartment and EBNA1- and CRYAB-responsive IFNγ+ CD4+ T cell compartments. Bars and staples represent the mean and SEM, respectively. Full data are presented in fig. S11. (E) Correlation of IFNγ and tumor necrosis factor α (TNFα) responses to CMV, EBNA1, and CRYAB. Lines and P values denote the linear regression curve. *P < 0.05; **P < 0.01; ***P < 0.001; ****P < 0.0001.

Comment in

References

    1. C. A. Dendrou, L. Fugger, M. A. Friese, Immunopathology of multiple sclerosis. Nat. Rev. Immunol. 15, 545–558 (2015). - PubMed
    1. International Multiple Sclerosis Genetics Consortium; Wellcome Trust Case Control Consortium 2, S. Sawcer, G. Hellenthal, M. Pirinen, C. C. A. Spencer, N. A. Patsopoulos, L. Moutsianas, A. Dilthey, Z. Su, C. Freeman, S. E. Hunt, S. Edkins, E. Gray, D. R. Booth, S. C. Potter, A. Goris, G. Band, A. B. Oturai, A. Strange, J. Saarela, C. Bellenguez, B. Fontaine, M. Gillman, B. Hemmer, R. Gwilliam, F. Zipp, A. Jayakumar, R. Martin, S. Leslie, S. Hawkins, E. Giannoulatou, S. D’alfonso, H. Blackburn, F. M. Boneschi, J. Liddle, H. F. Harbo, M. L. Perez, A. Spurkland, M. J. Waller, M. P. Mycko, M. Ricketts, M. Comabella, N. Hammond, I. Kockum, O. T. M. Cann, M. Ban, P. Whittaker, A. Kemppinen, P. Weston, C. Hawkins, S. Widaa, J. Zajicek, S. Dronov, N. Robertson, S. J. Bumpstead, L. F. Barcellos, R. Ravindrarajah, R. Abraham, L. Alfredsson, K. Ardlie, C. Aubin, A. Baker, K. Baker, S. E. Baranzini, L. Bergamaschi, R. Bergamaschi, A. Bernstein, A. Berthele, M. Boggild, J. P. Bradfield, D. Brassat, S. A. Broadley, D. Buck, H. Butzkueven, R. Capra, W. M. Carroll, P. Cavalla, E. G. Celius, S. Cepok, R. Chiavacci, F. Clerget-Darpoux, K. Clysters, G. Comi, M. Cossburn, I. Cournu-Rebeix, M. B. Cox, W. Cozen, B. A. C. Cree, A. H. Cross, D. Cusi, M. J. Daly, E. Davis, P. I. W. de Bakker, M. Debouverie, M. B. D’hooghe, K. Dixon, R. Dobosi, B. Dubois, D. Ellinghaus, I. Elovaara, F. Esposito, C. Fontenille, S. Foote, A. Franke, D. Galimberti, A. Ghezzi, J. Glessner, R. Gomez, O. Gout, C. Graham, S. F. A. Grant, F. R. Guerini, H. Hakonarson, P. Hall, A. Hamsten, H.-P. Hartung, R. N. Heard, S. Heath, J. Hobart, M. Hoshi, C. Infante-Duarte, G. Ingram, W. Ingram, T. Islam, M. Jagodic, M. Kabesch, A. G. Kermode, T. J. Kilpatrick, C. Kim, N. Klopp, K. Koivisto, M. Larsson, M. Lathrop, J. S. Lechner-Scott, M. A. Leone, V. Leppä, U. Liljedahl, I. L. Bomfim, R. R. Lincoln, J. Link, J. Liu, A. R. Lorentzen, S. Lupoli, F. Macciardi, T. Mack, M. Marriott, V. Martinelli, D. Mason, J. L. McCauley, F. Mentch, I.-L. Mero, T. Mihalova, X. Montalban, J. Mottershead, K.-M. Myhr, P. Naldi, W. Ollier, A. Page, A. Palotie, J. Pelletier, L. Piccio, T. Pickersgill, F. Piehl, S. Pobywajlo, H. L. Quach, P. P. Ramsay, M. Reunanen, R. Reynolds, J. D. Rioux, M. Rodegher, S. Roesner, J. P. Rubio, I.-M. Rückert, M. Salvetti, E. Salvi, A. Santaniello, C. A. Schaefer, S. Schreiber, C. Schulze, R. J. Scott, F. Sellebjerg, K. W. Selmaj, D. Sexton, L. Shen, B. Simms-Acuna, S. Skidmore, P. M. A. Sleiman, C. Smestad, P. S. Sørensen, H. B. Søndergaard, J. Stankovich, R. C. Strange, A.-M. Sulonen, E. Sundqvist, A.-C. Syvänen, F. Taddeo, B. Taylor, J. M. Blackwell, P. Tienari, E. Bramon, A. Tourbah, M. A. Brown, E. Tronczynska, J. P. Casas, N. Tubridy, A. Corvin, J. Vickery, J. Jankowski, P. Villoslada, H. S. Markus, K. Wang, C. G. Mathew, J. Wason, C. N. A. Palmer, H.-E. Wichmann, R. Plomin, E. Willoughby, A. Rautanen, J. Winkelmann, M. Wittig, R. C. Trembath, J. Yaouanq, A. C. Viswanathan, H. Zhang, N. W. Wood, R. Zuvich, P. Deloukas, C. Langford, A. Duncanson, J. R. Oksenberg, M. A. Pericak-Vance, J. L. Haines, T. Olsson, J. Hillert, A. J. Ivinson, P. L. De Jager, L. Peltonen, G. J. Stewart, D. A. Hafler, S. L. Hauser, G. McVean, P. Donnelly, A. Compston, Genetic risk and a primary role for cell-mediated immune mechanisms in multiple sclerosis. Nature 476, 214–219 (2011). - PMC - PubMed
    1. T. Olsson, L. F. Barcellos, L. Alfredsson, Interactions between genetic, lifestyle and environmental risk factors for multiple sclerosis. Nat. Rev. Neurol. 13, 25–36 (2017). - PubMed
    1. S. S. Soldan, P. M. Lieberman, Epstein-Barr virus and multiple sclerosis. Nat. Rev. Microbiol. 21, 51–64 (2022). - PMC - PubMed
    1. A. Langer-Gould, J. Wu, R. Lucas, J. Smith, E. Gonzales, L. Amezcua, S. Haraszti, L. H. Chen, H. Quach, J. A. James, L. F. Barcellos, A. H. Xiang, Epstein-Barr virus, cytomegalovirus, and multiple sclerosis susceptibility: A multiethnic study. Neurology 89, 1330–1337 (2017). - PMC - PubMed

Substances