. 2023 May 19;9(20):eadf2982.
doi: 10.1126/sciadv.adf2982. Epub 2023 May 17.

Mice with humanized livers reveal the role of hepatocyte clocks in rhythmic behavior

Affiliations

Mice with humanized livers reveal the role of hepatocyte clocks in rhythmic behavior

Anne-Sophie Delbès et al. Sci Adv. .

Abstract

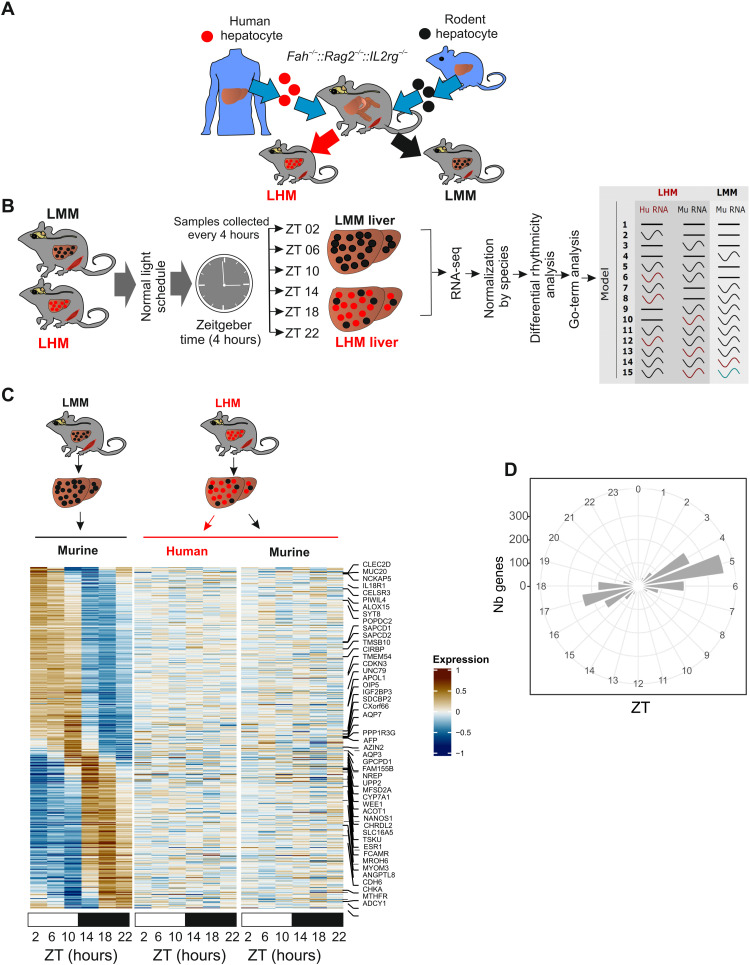
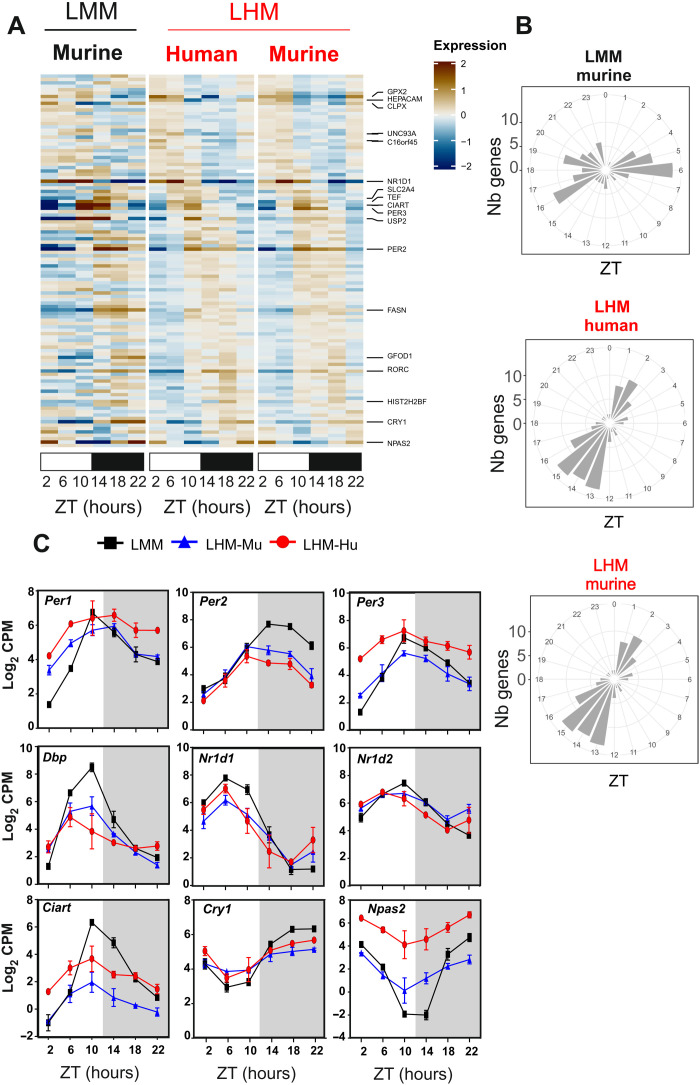
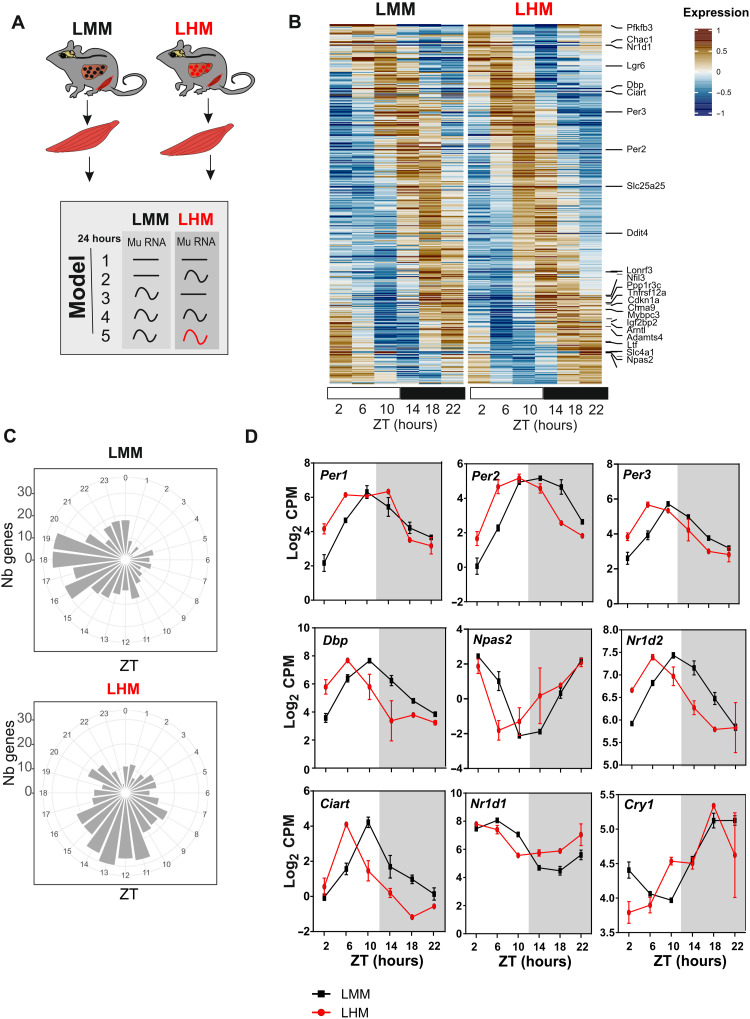
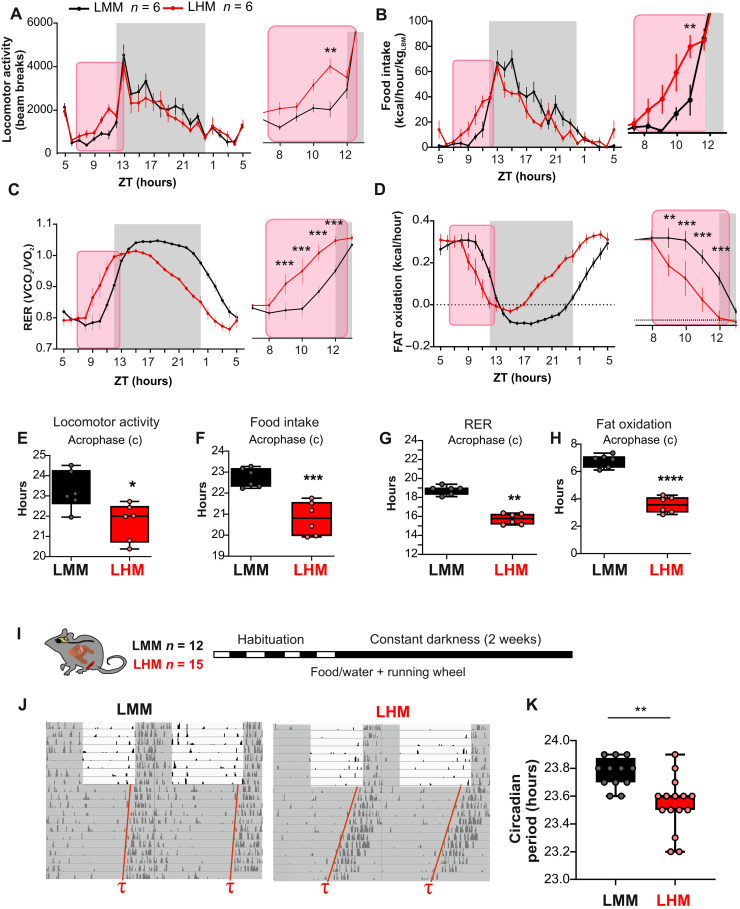
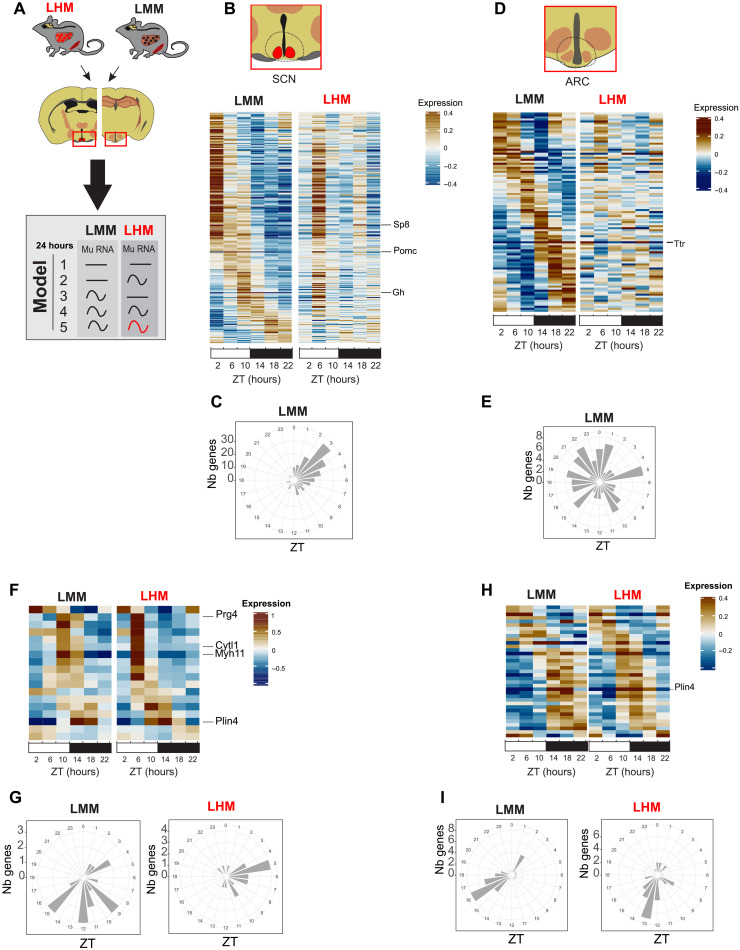
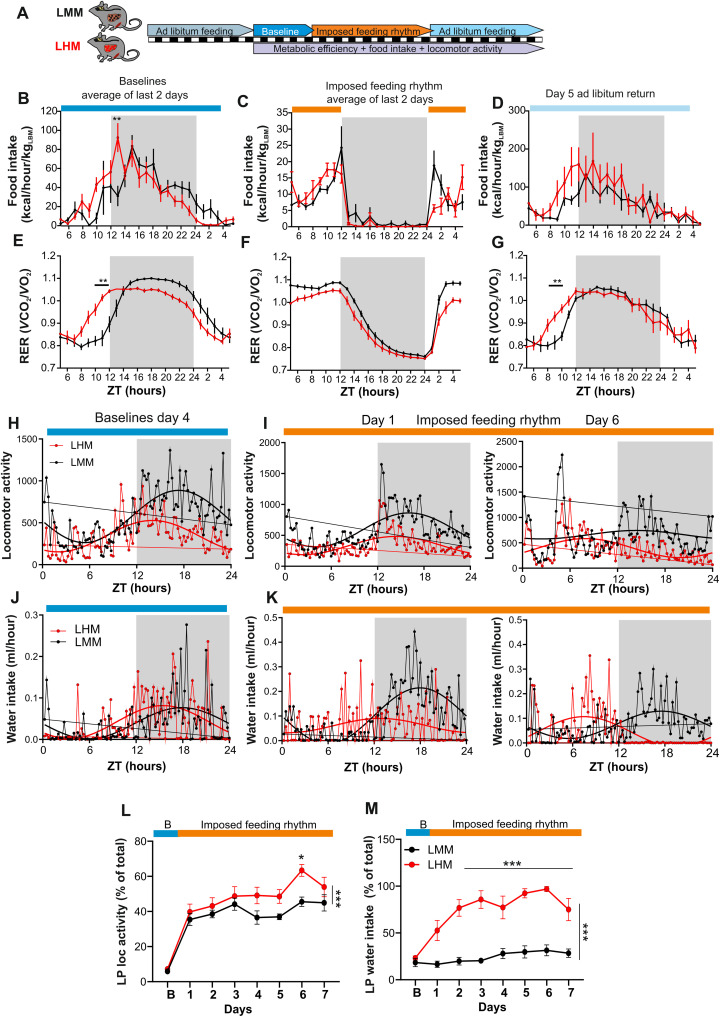
The synchronization of circadian clock depends on a central pacemaker located in the suprachiasmatic nuclei. However, the potential feedback of peripheral signals on the central clock remains poorly characterized. To explore whether peripheral organ circadian clocks may affect the central pacemaker, we used a chimeric model in which mouse hepatocytes were replaced by human hepatocytes. Liver humanization led to reprogrammed diurnal gene expression and advanced the phase of the liver circadian clock that extended to muscle and the entire rhythmic physiology. Similar to clock-deficient mice, liver-humanized mice shifted their rhythmic physiology more rapidly to the light phase under day feeding. Our results indicate that hepatocyte clocks can affect the central pacemaker and offer potential perspectives to apprehend pathologies associated with altered circadian physiology.


Figures

Fig. 1.
Fig. 1.. Engraftment of human hepatocyte affects liver rhythmic gene expression.
(A) Model for humanized Fah−/−, Rag2−/−, Il2rg−/− (FRG-KO) that can be repopulated with primary human (red) or murine (black) hepatocytes to produce LHM or LMM mice. (B) Experimental design for liver tissue collection before RNA extraction, sequencing, and analysis according to gene expression rhythmic properties. Alteration of rhythmic gene expression of murine transcript in the liver of LMM (black, Mu RNA) and both murine (black, Mu-RNA) and human transcript (red, Hu-RNA) in the liver of LHM mice is assessed by model selection (models 1 to 15): black line, stable transcription; black wave, rhythmic transcription; red or green waves, rhythmic profiles with different rhythmic parameters (i.e., phase and/or amplitude). (C) Heatmaps of normalized rhythmic mRNA levels (BICW > 0.3, log2 amplitude > 0.5) in the liver of LMM (black) and LHM (black) murine and human transcript (red) in the liver of LMM and LHM. RNA presented here belonged to model 4 where genes were rhythmic only in LMM. (D) Radial plot of the distribution peak phase of expression for genes rhythmic only in the liver of LMM (model 4, Nb genes, number of genes).
Fig. 2.
Fig. 2.. Engraftment of human hepatocyte affects the phase of the liver circadian clock.
(A) Heatmaps of normalized rhythmic mRNA levels (BICW > 0.3, log2 amplitude > 0.5) in the liver of LMM (black) and LHM (red) murine and human transcript (red) in the liver of LMM and LHM. Genes presented here belonged to model 14 where both LHM-Mu and LHM-Hu ortholog transcripts share the same phase, which is different from LMM. (B) Radial plot distribution of the peak phase of expression for rhythmic genes in the liver of LMM and murine and human orthologs in the liver of LHM from model 14. (C) Rhythmic expression of circadian clock genes for murine (black, LMM) and murine (blue, LHM-Mu) and human (red, LHM-Hu) RNA orthologs in the humanized liver. Data are expressed as means ± SEM of Log2 counts per million reads mapped (CPM) (n = 12 mice per group, 2 points per replicate). For statistical details, see table S1.
Fig. 3.
Fig. 3.. The muscle circadian clock of LHM is phase advanced.
(A) Experimental design for muscle tissue collection before RNA extraction, sequencing, and analysis according to rhythmic properties and alteration of rhythmic gene expression of murine transcript in the muscle of LMM (black) and LHM (red) assessed by model selection (models 1 to 5): black line, stable transcription; black wave, rhythmic transcription; red wave, rhythmic profiles with different rhythmic parameters (i.e., phase and/or amplitude). (B) Heatmaps of normalized rhythmic muscle mRNA levels (BICW > 0.5, log2 amplitude > 0.5) in LMM (black) and LHM (red) from model 5 where LMM and LHM muscle transcript are rhythmic but with different phases. (C) Radial plot distribution of the peak phase of expression for rhythmic genes in the liver of LMM and murine and human orthologs in the liver of LHM from model 5. (D) Rhythmic expression of circadian clock genes in the muscle of LMM and LHM. Data are expressed as means ± SEM (n = 11 to 12 animals per group). For statistical details, see table S1.
Fig. 4.
Fig. 4.. Human hepatocytes advance the phase of circadian metabolism and behavior of LHM.
(A to D) Metabolic evaluation of LMM and LHM represented as 3-day average spontaneous locomotor activity (A), food intake (B, kcal/hour per kg of lean body weight), respiratory exchange ratio (RER, C), and fat oxidation (D). Inserts show magnification of the ZT8 to ZT12 time window. (E to H) Cosinor analysis of rhythmic parameters acrophase (c) for locomotor activity (E), food intake (F), RER (G), and fat oxidation (H). (I) Experimental design for determining the circadian period of LMM and LHM via recording the circadian running wheel activity in constant darkness. (J) Representative actogram and circadian period in LMM and LHM. (K) Circadian period of locomotor activity in LHM and LMM (n = 12 and 15 for LMM and LHM, respectively). Codes for statistical values: *P < 0.05, **P < 0.01, ***P < 0.0001.
Fig. 5.
Fig. 5.. Engrafted human hepatocytes affect rhythmic gene expression in the hypothalamus.
(A) Experimental design for SCN and ARC samples collection before RNA extraction, sequencing, and analysis according to rhythmic properties and alteration of rhythmic gene expression of murine transcript in the liver of LMM (black) and LHM (red) assessed by model selection (models 1 to 5): black line, stable transcription; black wave, rhythmic transcription; red wave, rhythmic profiles with different rhythmic parameters (i.e., phase and/or amplitude). (B to E) Heatmaps of normalized rhythmic mRNA levels (BICW > 0.5, log2 amplitude > 0.5) and radial plot of the distribution of the peak phase of expression of the cycling genes and in the SCN (B and C) and ARC (D and E) in LMM (black) and LHM (red) from genes that lost rhythmicity in LHM (model 3). (F to I) Heatmaps of normalized rhythmic mRNA levels (BICW > 0.5, log2 amplitude > 0.5) and radial plot of the distribution of the peak phase of expression of the cycling genes and in the SCN (F and G) and ARC (H and I) in LMM (black) and LHM (red) from genes that show altered rhythmic parameters in LHM (model 5).
Fig. 6.
Fig. 6.. Engraftment of human hepatocytes reveals the ability of hepatic signals to feedback on the central pacemaker.
(A) Experimental design for the imposed feeding regimen during the light phase. (B to G) Two-day average analysis of rhythmic food intake (B to D) and RER (E and F) during the baseline period (B and E), imposed daylight feeding (C and F), or day 5 after return to ad libitum feeding (D and G) in LMM (black) and LHM (red) (n = 6 per groups). (H to K) Representative of average distribution and nonlinear cosinor fitting of baseline day 4 (H and J) and after 1 and 6 days of imposed light phase feeding rhythm (I and K) for locomotor activity (H and I) and water consumption (J and K). (L and M) Evolution of locomotor activity (L) and water intake (M) during the light phase (LP) after transitioning from baseline (blue) to imposed feeding during the light phase (orange) as a percentage of the baseline value. Data are expressed as means ± SEM (n = 6 animals per condition). *P < 0.05, **P < 0.01, ***P < 0.0001.

References

    1. M. R. Ralph, R. G. Foster, F. C. Davis, M. Menaker, Transplanted suprachiasmatic nucleus determines circadian period. Science 247, 975–978 (1990). - PubMed
    1. S. H. Yoo, S. Yamazaki, P. L. Lowrey, K. Shimomura, C. H. Ko, E. D. Buhr, S. M. Siepka, H. K. Hong, W. J. Oh, O. J. Yoo, M. Menaker, J. S. Takahashi, PERIOD2::LUCIFERASE real-time reporting of circadian dynamics reveals persistent circadian oscillations in mouse peripheral tissues. Proc. Natl. Acad. Sci. U.S.A. 101, 5339–5346 (2004). - PMC - PubMed
    1. F. Sinturel, P. Gos, V. Petrenko, C. Hagedorn, F. Kreppel, K. F. Storch, D. Knutti, A. Liani, C. Weitz, Y. Emmenegger, P. Franken, L. Bonacina, C. Dibner, U. Schibler, Circadian hepatocyte clocks keep synchrony in the absence of a master pacemaker in the suprachiasmatic nucleus or other extrahepatic clocks. Genes Dev. 35, 329–334 (2021). - PMC - PubMed
    1. B. Kornmann, O. Schaad, H. Reinke, C. Saini, U. Schibler, Regulation of circadian gene expression in liver by systemic signals and hepatocyte oscillators. Cold Spring Harb. Symp. Quant. Biol. 72, 319–330 (2007). - PubMed
    1. B. D. Weger, C. Gobet, F. P. A. David, F. Atger, E. Martin, N. E. Phillips, A. Charpagne, M. Weger, F. Naef, F. Gachon, Systematic analysis of differential rhythmic liver gene expression mediated by the circadian clock and feeding rhythms. Proc. Natl. Acad. Sci. U.S.A. 118, e2015803118 (2021). - PMC - PubMed